

doi: 10.1182/bloodadvances.2017012732.
eCollection 2017 Nov 28.
Changes in bone marrow innate lymphoid cell subsets in monoclonal gammopathy: target for IMiD therapy
Affiliations
- PMID: 29296884
- PMCID: PMC5729633
- DOI: 10.1182/bloodadvances.2017012732
Item in Clipboard
Changes in bone marrow innate lymphoid cell subsets in monoclonal gammopathy: target for IMiD therapy
Blood Adv.
.
Erratum in
-
Erratum: Kini Bailur J, Mehta S, Zhang L, et al. Changes in bone marrow innate lymphoid cell subsets in monoclonal gammopathy: target for IMiD therapy. Blood Adv. 2017;1(25):2343-2347.Blood Adv. 2018 Jan 9;2(1):75. doi: 10.1182/bloodadvances.2017015438. eCollection 2018 Jan 9. Blood Adv. 2018. PMID: 29345695 Free PMC article.
Abstract
Altered number, subset composition, and function of bone marrow innate lymphoid cells are early events in monoclonal gammopathies.Pomalidomide therapy leads to reduction in Ikzf1 and Ikzf3 and enhanced human innate lymphoid cell function in vivo.
Conflict of interest statement
Conflict-of-interest disclosure: The authors declare no competing financial interests.
Figures
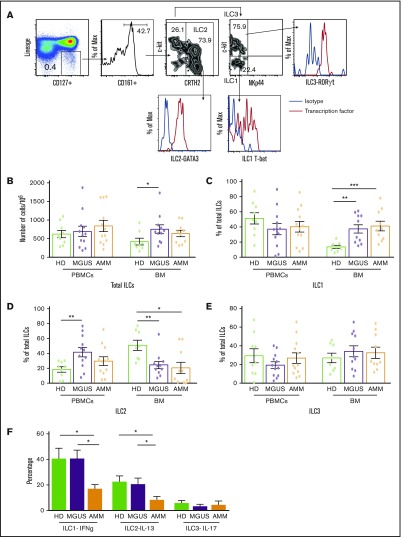
Changes in ILC and ILC subsets in gammopathies. (A) Representative fluorescence-activated cell sorter FACS plots showing the gating strategy to identify ILC1, ILC2, and ILC3 along with their transcription factors T-bet, GATA3, and RORγt, respectively. MNCs were stained with dye to exclude dead cells and a cocktail of antibodies (lineage: CD1a, CD34, CD94, CD123, TCRαβ, TCRγδ, FCεR1, CD303, CD11c, CD14, CD19, CD3, and CD138 in bone marrow from patients with plasma cell disorders) to exclude cells with known lineages. ILCs were then identified in a lineage-negative subset based on the expression of CD127 and CD161, and then classified as ILC1, ILC2, or ILC3 on the basis of the expression of CRTH2, c-kit, and NKp44. ILCs were identified as lineage CD127+CD161+ cells and subclassified as ILC2 (CRTH2+c-kit+/−), ILC1 (NKp44–c-kit–), or ILC3 (Nkp44–c-kit+). (B-E) Total ILCs and ILC subsets in peripheral blood mononuclear cells (PBMCs) or bone marrow (BM) samples from healthy donors (HDs; n = 9) and MGUS (n = 12) or AMM patients (n = 12) were evaluated by using flow cytometry. All graphs show mean ± standard error of the mean (SEM). (B) Total ILCs in peripheral blood and BM of HDs as well as MGUS and AMM patients. Proportion of (C) ILC1, (D) ILC2, and (E) ILC3 in PBMCs and BM samples of HDs and MGUS and AMM patients. (F) Cytokine production by ILC subsets upon stimulation with phorbol myristate acetate (PMA) and ionomycin. Bar graph (mean + SEM) shows the IFN-γ–producing ILC1s, IL-13–producing ILC2s, and IL-17–producing ILC3s in HD BM (n = 4), MGUS BM (n = 6), and AMM BM (n = 6). *P < .05; **P < .01; ***P < .001.
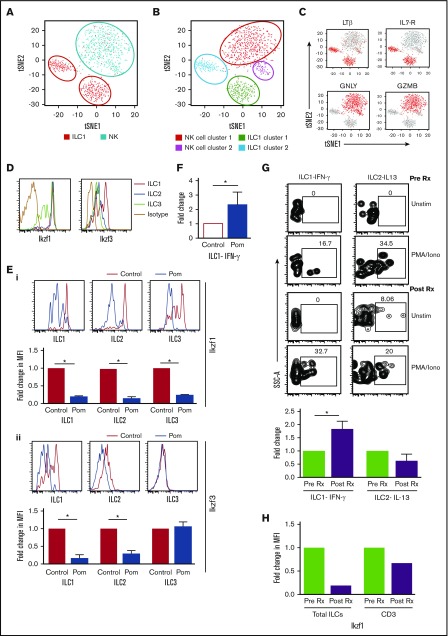
ILC subsets and changes in ILCs after pomalidomide. (A-C) Student t distribution analysis of the single-cell RNA sequencing data showing the NK and (A-B) ILC1 cluster and the (C) key genes (LTβ, IL7-R, GNLY, GZMB) that distinguish ILC1 and NK cells in human marrow. (D) Expression of Ikaros (Ikzf1) and Aiolos (Ikzf3) in ILC subsets (ILC1, ILC2, and ILC3). (E) Depletion of Ikzf1 and Ikzf3 in ILCs following exposure to pomalidomide in vitro. (i) Depletion of IKZF1: representative plot showing the level of Ikaros (Ikzf1) in ILC1, ILC2, and ILC3 in control cells and cells treated with pomalidomide (100 ng/mL). Bar graph shows data from 3 experiments. (ii) Depletion of IKZF3: representative FACS plots showing the level of Aiolos (Ikzf3) in ILC1, ILC2, and ILC3 in control cells and cells treated with pomalidomide (100 ng/mL). Bar graph shows data from 3 experiments. (F) Fold change in IFN-γ–producing ILC1 after culture with pomalidomide. Bar graph shows the IFN-γ production by ILC1 in HD PBMCs (n = 5) after overnight culture with IL-12 (10 ng/mL) alone (control) or with pomalidomide (100 ng/mL). (G) Changes in cytokine production by ILCs after a single dose of pomalidomide. PBMCs from MM patients (n = 3) were isolated before therapy and 4 hours after a single dose of pomalidomide and analyzed for cytokine production by ILCs after stimulation with PMA and ionomycin. Representative FACS plot showing the cytokine production by ILCs. Bar graph shows cumulative data from 3 patients. (H) Change in Ikaros levels in ILCs as well as CD3 in vivo after pomalidomide therapy.
References
-
- Klose CS, Artis D. Innate lymphoid cells as regulators of immunity, inflammation and tissue homeostasis. Nat Immunol. 2016;17(7):765-774. - PubMed
-
- Spits H, Artis D, Colonna M, et al. Innate lymphoid cells--a proposal for uniform nomenclature. Nat Rev Immunol. 2013;13(2):145-149. - PubMed
-
- Carrega P, Campana S, Bonaccorsi I, Ferlazzo G. The yin and yang of innate lymphoid cells in cancer. Immunol Lett. 2016;179:29-35. - PubMed
-
- Irshad S, Flores-Borja F, Lawler K, et al. RORγt(+) innate lymphoid cells promote lymph node metastasis of breast cancers. Cancer Res. 2017;77(5):1083-1096. - PubMed
Grants and funding
LinkOut - more resources
Full Text Sources
Other Literature Sources
Molecular Biology Databases
