

Association of Race and Ethnicity With Live Donor Kidney Transplantation in the United States From 1995 to 2014
- PMID: 29297077
- PMCID: PMC5833543
- DOI: 10.1001/jama.2017.19152
Association of Race and Ethnicity With Live Donor Kidney Transplantation in the United States From 1995 to 2014
Abstract
Importance: Over the past 2 decades, there has been increased attention and effort to reduce disparities in live donor kidney transplantation (LDKT) for black, Hispanic, and Asian patients with end-stage kidney disease. The goal of this study was to investigate whether these efforts have been successful.
Objective: To estimate changes over time in racial/ethnic disparities in LDKT in the United States, accounting for differences in death and deceased donor kidney transplantation.
Design, setting, and participants: A secondary analysis of a prospectively maintained cohort study conducted in the United States of 453 162 adult first-time kidney transplantation candidates included in the Scientific Registry of Transplant Recipients between January 1, 1995, and December 31, 2014, with follow-up through December 31, 2016.
Exposures: Race/ethnicity.
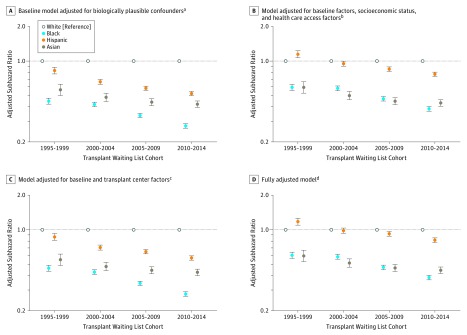
Main outcomes and measures: The primary study outcome was time to LDKT. Multivariable Cox proportional hazards and competing risk models were constructed to assess changes in racial/ethnic disparities in LDKT among adults on the deceased donor kidney transplantation waiting list and interaction terms were used to test the statistical significance of temporal changes in racial/ethnic differences in receipt of LDKT. The adjusted subhazard ratios are estimates derived from the multivariable competing risk models. Data were categorized into 5-year increments (1995-1999, 2000-2004, 2005-2009, 2010-2014) to allow for an adequate sample size in each analytical cell.
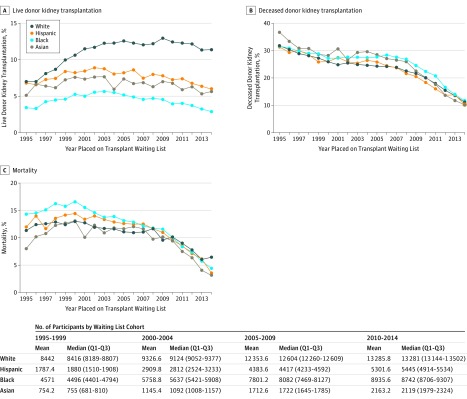
Results: Among 453 162 adult kidney transplantation candidates (mean [SD] age, 50.9 [13.1] years; 39% were women; 48% were white; 30%, black; 16%, Hispanic; and 6%, Asian), 59 516 (13.1%) received LDKT. Overall, there were 39 509 LDKTs among white patients, 8926 among black patients, 8357 among Hispanic patients, and 2724 among Asian patients. In 1995, the cumulative incidence of LDKT at 2 years after appearing on the waiting list was 7.0% among white patients, 3.4% among black patients, 6.8% among Hispanic patients, and 5.1% among Asian patients. In 2014, the cumulative incidence of LDKT was 11.4% among white patients, 2.9% among black patients, 5.9% among Hispanic patients, and 5.6% among Asian patients. From 1995-1999 to 2010-2014, racial/ethnic disparities in the receipt of LDKT increased (P < .001 for all statistical interaction terms in adjusted models comparing white patients vs black, Hispanic, and Asian patients). In 1995-1999, compared with receipt of LDKT among white patients, the adjusted subhazard ratio was 0.45 (95% CI, 0.42-0.48) among black patients, 0.83 (95% CI, 0.77-0.88) among Hispanic patients, and 0.56 (95% CI, 0.50-0.63) among Asian patients. In 2010-2014, compared with receipt of LDKT among white patients, the adjusted subhazard ratio was 0.27 (95% CI, 0.26-0.28) among black patients, 0.52 (95% CI, 0.50-0.54) among Hispanic patients, and 0.42 (95% CI, 0.39-0.45) among Asian patients.
Conclusions and relevance: Among adult first-time kidney transplantation candidates in the United States who were added to the deceased donor kidney transplantation waiting list between 1995 and 2014, disparities in the receipt of live donor kidney transplantation increased from 1995-1999 to 2010-2014. These findings suggest that national strategies for addressing disparities in receipt of live donor kidney transplantation should be revisited.
Conflict of interest statement
Figures
Comment in
-
Disparities in Live Donor Kidney Transplantation: Related to Poverty, Race, or Ethnicity?JAMA. 2018 Jan 2;319(1):24-26. doi: 10.1001/jama.2017.19617. JAMA. 2018. PMID: 29297060 No abstract available.
References
-
- US Renal Data System 2016 USRDS Annual Data Report: Epidemiology of Kidney Disease in the United States. Bethesda, MD: National Institutes of Health, National Institute of Diabetes and Digestive and Kidney Diseases; 2016.
-
- Scientific Registry of Transplant Recipients 2015 SRTR annual data report. https://srtr.transplant.hrsa.gov/annual_reports/Default.aspx. Accessed July 12, 2017.
-
- Gore JL, Danovitch GM, Litwin MS, Pham PT, Singer JS. Disparities in the utilization of live donor renal transplantation. Am J Transplant. 2009;9(5):1124-1133. - PubMed
-
- Hall EC, James NT, Garonzik Wang JM, et al. Center-level factors and racial disparities in living donor kidney transplantation. Am J Kidney Dis. 2012;59(6):849-857. - PubMed
Publication types
MeSH terms
Grants and funding
LinkOut - more resources
Full Text Sources
Other Literature Sources
Medical
Miscellaneous
