. 2018 May;43(6):1425-1435.
doi: 10.1038/npp.2017.304. Epub 2018 Jan 3.

The Protective Action Encoding of Serotonin Transients in the Human Brain

Affiliations

The Protective Action Encoding of Serotonin Transients in the Human Brain

Rosalyn J Moran et al. Neuropsychopharmacology. 2018 May.

Abstract

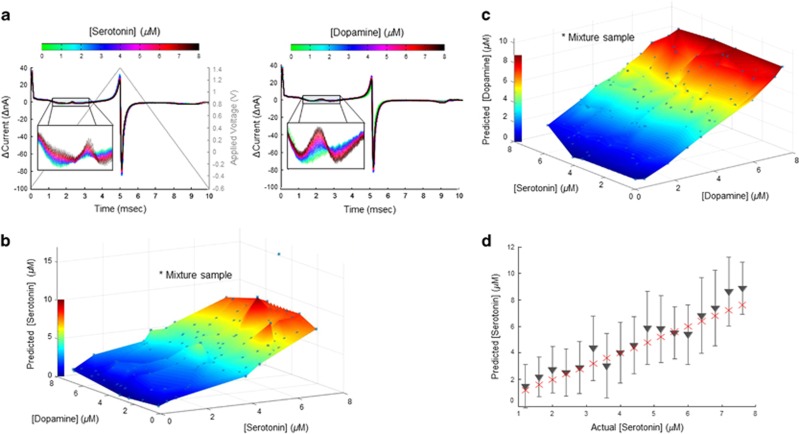
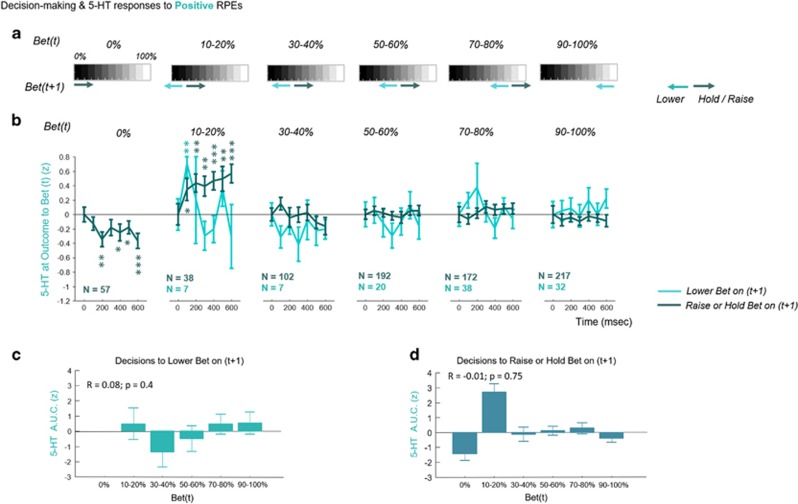
The role of serotonin in human brain function remains elusive due, at least in part, to our inability to measure rapidly the local concentration of this neurotransmitter. We used fast-scan cyclic voltammetry to infer serotonergic signaling from the striatum of 14 brains of human patients with Parkinson's disease. Here we report these novel measurements and show that they correlate with outcomes and decisions in a sequential investment game. We find that serotonergic concentrations transiently increase as a whole following negative reward prediction errors, while reversing when counterfactual losses predominate. This provides initial evidence that the serotonergic system acts as an opponent to dopamine signaling, as anticipated by theoretical models. Serotonin transients on one trial were also associated with actions on the next trial in a manner that correlated with decreased exposure to poor outcomes. Thus, the fluctuations observed for serotonin appear to correlate with the inhibition of over-reactions and promote persistence of ongoing strategies in the face of short-term environmental changes. Together these findings elucidate a role for serotonin in the striatum, suggesting it encodes a protective action strategy that mitigates risk and modulates choice selection particularly following negative environmental events.


Figures

Figure 1
Figure 1
Serotonin concentration prediction from dual transmitter model. (a) An illustration of voltammograms acquired for varying levels of serotonin concentration (left) and dopamine concentration (right) in the flow cell. We see that low to high concentration levels produce changes in current magnitude around the oxidation potentials (insets). Concentration is denoted by []. (b) The flow cell predictions are illustrated for serotonin under varying concentrations of dopamine in the mixture. Serotonin was sampled at each level of concentration from 0.1 to 8 μM in 0.1 μM increments. For each of these 80 concentrations we computed the serotonin prediction over different levels of dopamine. Not all concentration mixtures for dopamine and serotonin were acquired and acquired mixtures are denoted by the asterisk. Over this test grid we interpolated (using linear triangulation) across the acquired tests samples to produce a three-dimensional heat map of serotonin predictions. This plot show that serotonin predictions do not vary systematically with increasing dopamine levels. We illustrate one outlying serotonin prediction, which was observed but not included in the interpolated plot for visualization purposes. (c) Flow cell predictions for dopamine in the mixture, plotted as a function of increasing dopamine and increasing serotonin as per b. Again, dopamine predictions using our model do not appear to be systematically affected by the level of serotonin in the sample. (d) We tested 200 out-of-sample voltammograms for each concentration level to quantify the error in generalizability. Illustrated in gray are predictions for different concentration ranges and their 99.99% confidence intervals. Red crosses denote the mean of the (correct) test range. For each range we randomly selected 20 predictions from the full test set.
Figure 2
Figure 2
Dopamine replication in mixture model. We performed an in vivo validation by replicating the previous dopamine findings using our new multivariate mixture model. We split trials into low (0–50%), medium (60–80%), and high (90–100%) bets and examined dopamine transients at these different bet levels in response to positive and negative reward prediction errors. As per the findings reported previously for a univariate model (Kishida et al, 2016) dopamine estimates from the dual transmitter model predict dopamine encoding of prediction errors. Using two-way ANOVAs with factors RPE (negative RPE and positive RPE) and bet levels (high, medium, low) we found a significant interaction at 200 (p=0.005), 300 (p=0.0001), 400 (p=0.0016), 500 (p=0.0079), and 600 ms (p=0.02). Post hoc two-sample t-test results for each bet level and time point are illustrated (*p<0.05, ***p⩽0.001). For validation purposes, we report here, those measurements from the original cohort of 17 patients reported in Kishida et al, 2016. Data were baseline corrected to zero at 0 ms, and bar graphs depict the mean and SEM.
Figure 3
Figure 3
Investment game and distributions of bets and RPEs over trials. (a) In this figure we provide an illustration of the overall task design. To investigate the role of serotonin we used an investment game (Lohrenz et al, 2007) where participants were endowed with an initial 100 ‘points’ and were instructed to invest a percentage of this amount for investment into a stock market (historic markets, eg, the 1929 Wall St crash). Participants could choose to invest 0–100% (color bar) in 10% increments (blue arrow, Bet(t)). On each trial participants submitted their investment (upper panel) and 840 ms later (±12 ms std) were shown the market return (middle panel). On the outcome, participants either lost or gained in accordance with their investment. From these market moves we calculated the reward prediction error on that trial. Following this outcome, participants submitted their next investment (blue arrow, Bet(t+1)) at their own pace (lower panel). (b) Distribution of investment choices over all participants. (c) Distribution of reward prediction errors, calculated over each market move over all participants.
Figure 4
Figure 4
Serotonin encodes negative reward prediction errors at high bets. (a) Testing across all outcomes and separating according to either a concomitant positive or negative reward prediction error, we found that serotonin fluctuated significantly more positively for negative (black line) compared to positive (cyan line) reward prediction errors. Six two-sample t-tests were performed over temporal bins (100–600 ms) comparing concentration levels; significant effects of RPE were observed at 300 and 400 ms (*p<0.05). Here we baseline corrected at −100 ms. (b) Two-way analyses of variance of serotonin’s transient response at presentation of the outcome or market move were performed for six temporal bins (100–600 ms), with factors reward prediction error polarity; positive and negative and bet level; low (0–50%), and high (60–100%). These revealed a significant interaction of reward prediction error and bet level at 100 (F=14.34, p=0.0002) and 500 ms (F=4.89, p=0.027). Post hoc two-sample t-tests were performed using permutation testing to assess within bet range differences in the response to negative compared to positive reward prediction errors. For the high bet range (60–100% invested), serotonin transients were significantly greater for negative compared to positive reward prediction errors at 100 ms, p=0.001; 300 ms, p=0.011; 400 ms, p=0.005; and 500 ms, p=0.01. While for the low bet range (0–50% invested) responses were significantly greater for positive compared to negative reward prediction errors at 100 ms; p=0.016. Only the differential response at 100 ms in the high bet case survived FWE-correction p=0.005 (**p⩽0.005, *p⩽0.05, (**)FWE-corrected). We also applied one-sample, two-sided t-tests in order to investigate the effects of RPE and bet size on 5-HT responses as compared to baseline. We find that the difference is driven by significant decreases in 5-HT following positive reward prediction errors at high bets, and to negative reward prediction errors at low bets («p<0.005, <p<0.05). Bar graphs depict the mean and SEM. Comparisons of transients with an alternate baseline is presented in Supplementary Figure S3. (c) The area under the curve in b revealed a significant interaction (F=7.13, p=0.0077) of RPE and bet level with larger (in time and amplitude) negative-going transients for positive reward prediction error responses in the high bet condition. (d) We tested the serotonin response at 100 ms and its correlation with the sign and polarity of the RPE. After omitting 65 outliers (~3% of trials) that may drive the effect (outliers defined as RPEs with an absolute magnitude >3 and Z-scores with an absolute magnitude >5) we see a small but significant correlation for the different bet levels. Serotonin transients are negatively correlated with the RPE for high bets (R=−0.0714; p=0.0113) and positively correlated with the RPE for low bets (R=0.0653; p=0.0494). To explore these results more granularly, we examined individual bins. We found that the only significant individual bins were at (20 and 30%), (60 and 70%), and (80 and 90%) with correlation coefficients and p-values of (R=0.19; p=0.01), (R=−0.08; p=0.06), and (R=−0.14; p=0.009), respectively. This suggests that a putative ‘indifference point’ for counterfactual and actual losses occurs around 40–50%.
Figure 5
Figure 5
Serotonin and active avoidance following negative reward prediction errors. (a) Depiction of ‘next actions’. Responses to trial (t) were analyzed for bet(t)=(0%, (10–20%), (30–40%), (50–60%), (70–80%), and (90–100%)). For each of these six levels we examined ‘lower bet’ next actions (black arrows) and ‘hold-or-raise’ bet next actions (gray arrows). (b) The n=842 negative RPE transients presented in Figure 4a and b are represented here but separated according to next-bet decision and current betting level. These results are provided in order to explore the significant negative interaction between serotonin and current bet on predicting change in bet (Supplementary Table 2). Consistent with this negative interaction in the regression analysis, we observe that large positive 5-HT transients at large bets predict a lowering of the bet at trial t+1 (black line, right panels). While dips in 5-HT are associated with reducing one’s bet at low bet levels to even lower levels (black line, left panels). The opposite effect is observed for holding or raising one bets, grey lines (with 0% not showing any significant transient effects). Significance here is indicated for uncorrected t-tests against zero (*p<0.05, **p<0.01, ***p<0.005). (c) Applying a correlation analyses to examine the relationship between serotonin and current bet levels when the next decision is to lower one’s bet. We find that over all ‘lower bet’ decisions, serotonin, and the current bet level were positively correlated (R=0.3; p<0.00001). This indicates that market withdrawal is affected by serotonin following poor outcomes. More specifically it indicates that serotonin may prevent further withdrawal (when investment is already low) and promote withdrawal (when investment is high). (d) Correlating decisions to hold or raise bets suggests the opposite effect (but at only trend-level significance).
Figure 6
Figure 6
Serotonin and active avoidance following positive reward prediction errors. (a) Depiction of ‘next actions’ as per negative RPE analysis in Figure 5. (b) Serotonin transients (n=882) following positive reward prediction errors as per Figure 4a and b but shown here separated according to decision on next trial and current bet level (lower bet on trial (t+1): cyan line; hold-or-raise bet on trial (t+1): dark green line). Only at low bets (where counterfactual losses dominate) did we observe large transients—the direction of the transient was not discriminative however in terms of next-bet decision. (c) Unlike following negative RPES, no parametric effect, in terms of current bet level and serotonin response, was observed for the decision to lower bet following positive reward prediction errors. (d) Similarly, no parametric effects were observed for serotonin responses preceding a decision to raise or increase bet levels (following a positive reward prediction error).

References

    1. Bari A, Theobald DE, Caprioli D, Mar AC, Aidoo-Micah A, Dalley JW et al (2010). Serotonin modulates sensitivity to reward and negative feedback in a probabilistic reversal learning task in rats. Neuropsychopharmacology 35: 1290–1301. - PMC - PubMed
    1. Balasubramani PP, Chakravarthy VS, Ravindran B, Moustafa AA (2014). An extended reinforcement learning model of basal ganglia to understand the contributions of serotonin and dopamine in risk-based decision making, reward prediction, and punishment learning. Front Comput Neurosci 8: 47. - PMC - PubMed
    1. Boureau Y-L, Dayan P (2011). Opponency revisited: competition and cooperation between dopamine and serotonin. Neuropsychopharmacology 36: 74–97. - PMC - PubMed
    1. Chiu PH, Lohrenz TM, Montague PR (2008). Smokers' brains compute, but ignore, a fictive error signal in a sequential investment task. Nat Neurosci 11: 514–520. - PubMed
    1. Cohen JY, Amoroso MW, Uchida N (2015). Serotonergic neurons signal reward and punishment on multiple timescales. Elife 4: e06346. - PMC - PubMed

Publication types