. 2018 Jan 2;22(1):255-268.
doi: 10.1016/j.celrep.2017.12.022.

Interrogating the Spatiotemporal Landscape of Neuromodulatory GPCR Signaling by Real-Time Imaging of cAMP in Intact Neurons and Circuits

Affiliations

Interrogating the Spatiotemporal Landscape of Neuromodulatory GPCR Signaling by Real-Time Imaging of cAMP in Intact Neurons and Circuits

Brian S Muntean et al. Cell Rep. .

Erratum in

Abstract

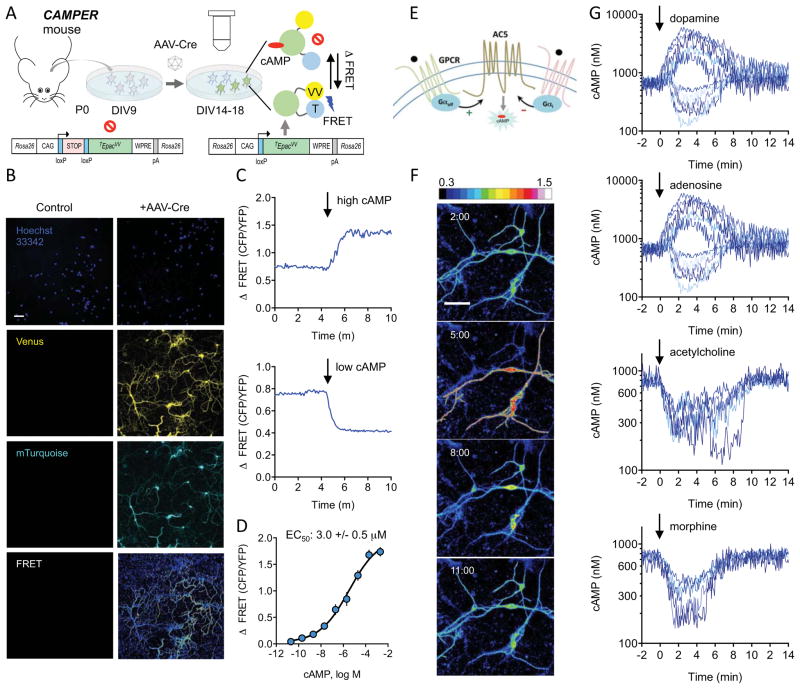
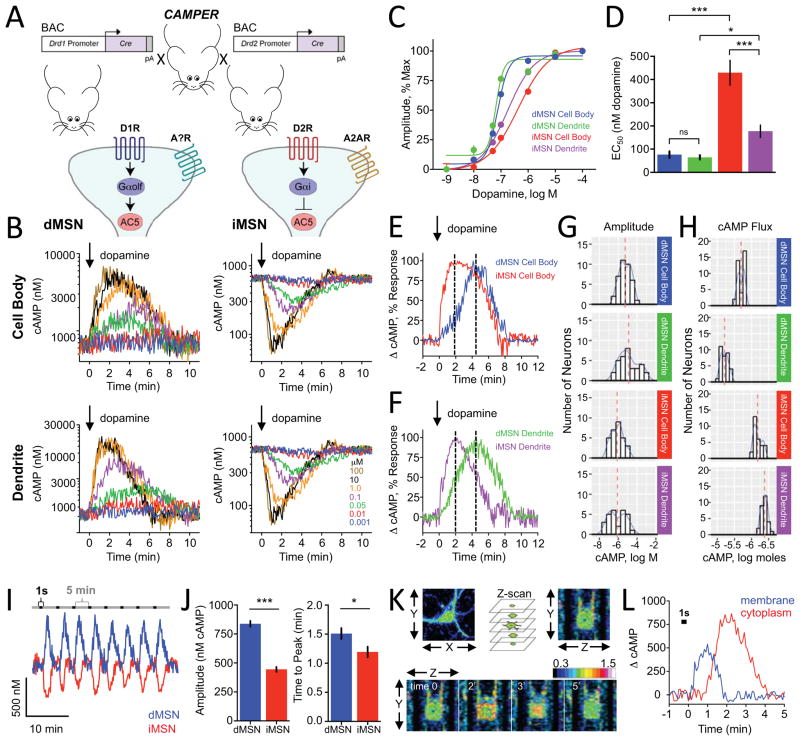
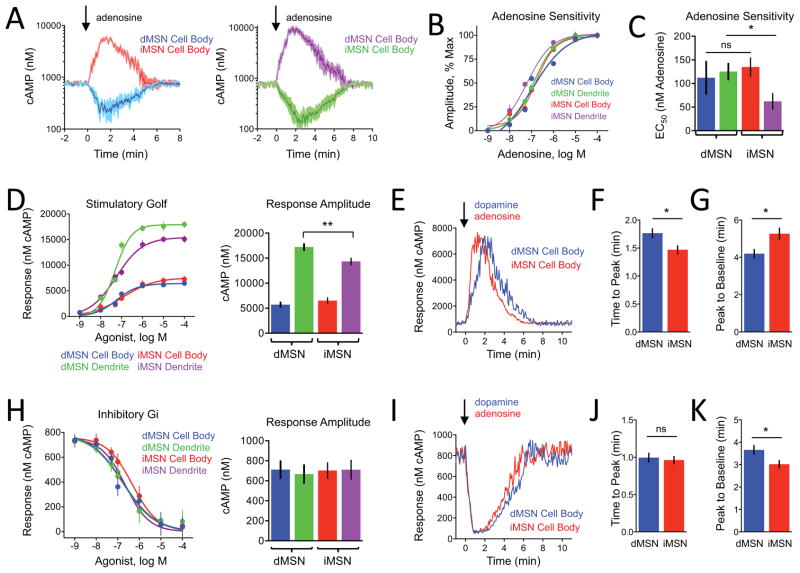
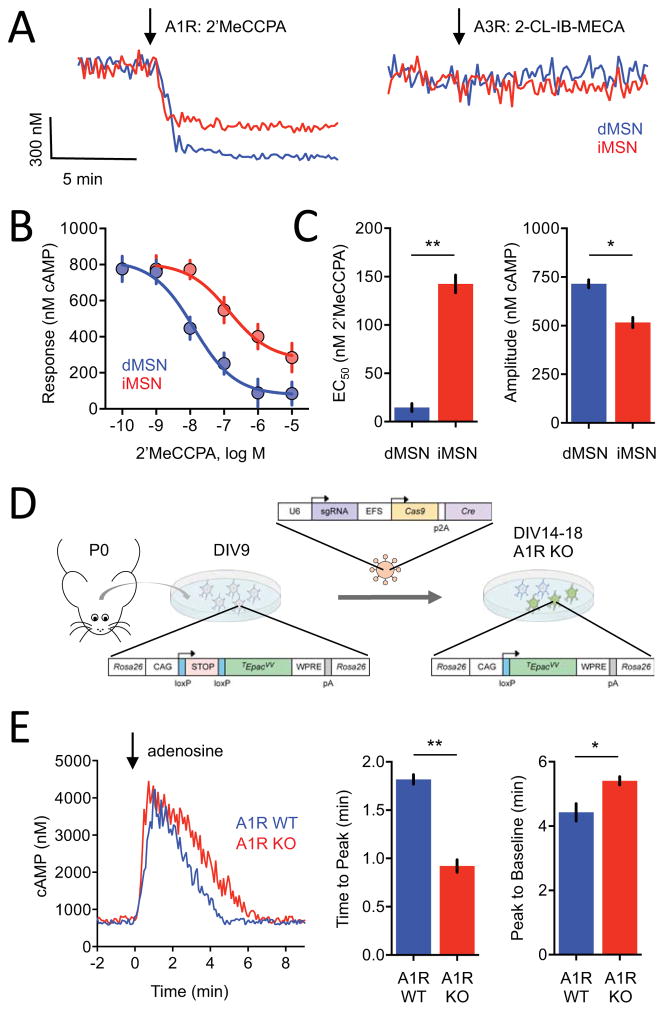
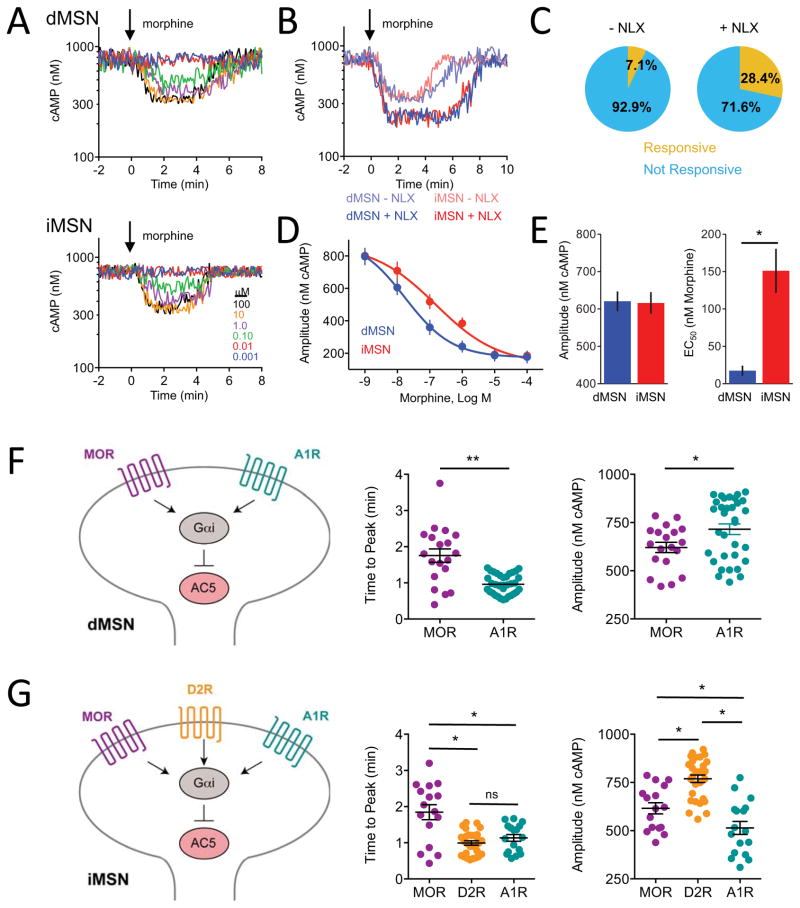
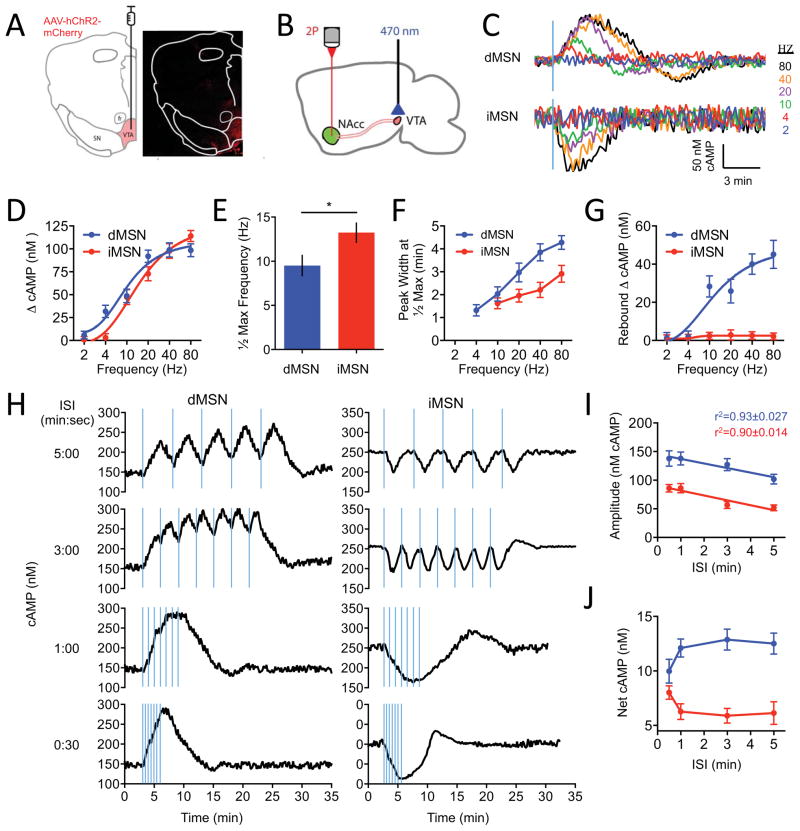
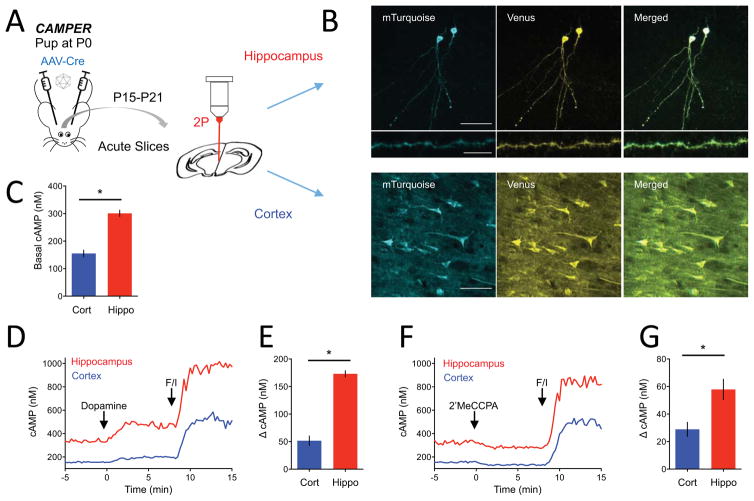
Modulation of neuronal circuits is key to information processing in the brain. The majority of neuromodulators exert their effects by activating G-protein-coupled receptors (GPCRs) that control the production of second messengers directly impacting cellular physiology. How numerous GPCRs integrate neuromodulatory inputs while accommodating diversity of incoming signals is poorly understood. In this study, we develop an in vivo tool and analytical suite for analyzing GPCR responses by monitoring the dynamics of a key second messenger, cyclic AMP (cAMP), with excellent quantitative and spatiotemporal resolution in various neurons. Using this imaging approach in combination with CRISPR/Cas9 editing and optogenetics, we interrogate neuromodulatory mechanisms of defined populations of neurons in an intact mesolimbic reward circuit and describe how individual inputs generate discrete second-messenger signatures in a cell- and receptor-specific fashion. This offers a resource for studying native neuronal GPCR signaling in real time.

Keywords: GPCR; cAMP; dopamine; imaging; neuromodulation; optogenetics; striatum.


Conflict of interest statement

COMPETING FINANCIAL INTERESTS

The authors declare no competing financial interest.

Figures

Figure 1
Figure 1. Mouse model for conditional expression of genetically encoded cAMP sensor
A) Schematic of strategy for imaging cAMP dynamics in primary striatal neurons at DIV14–18. B) Sample confocal images of primary striatal neurons from CAMPER mice at DIV14. Scale bar is 50 μm. C) Imaging changes in FRET in response to forskolin (10 μM) and IBMX (100 μM) (top panel) or digitonin (10 μg/μl) (bottom panel). D) Traces of the FRET change to cAMP standards in digitonin-permeabilized primary striatal neurons. Shading indicates SEM. n ≥ 8 neurons. E) Scheme of GPCRs coupling to cAMP production in striatal neurons. F) Pseudocolored images of FRET responses in primary striatal neurons to dopamine (1 μM). Time is shown as minutes following dopamine application (minutes:seconds format). Scale bar is 50 μm. LUT values displayed in ΔFRET. G) Representative traces to bath application (at time 0) of indicated agonist (1 μM). FRET ratios were converted to cAMP (nM) using the calibration curve shown in panel E. Bidirectional responses were observed for dopamine (52% increased cAMP, 39% decreased cAMP, 9% non-responsive, n=143) and adenosine (55% increased cAMP, 34% decreased cAMP, 11% non-responsive, n=70). Responses to acetylcholine (84% decreased cAMP, 16% non-responsive, n=77) and morphine (6% decreased cAMP, 94% non-responsive, n=215) were always inhibitory.
Figure 2
Figure 2. Benchmarking dopamine mediated signaling dynamics in cultured striatal neurons
A) Schematics of strategy to study cAMP dynamics in genetically defined populations of striatal neurons. B) Population responses to bath applied dopamine (at time=0) to D1R-Cre-CAMPER (dMSNs) and D2R-Cre-CAMPER (iMSNs) primary striatal neurons. 385 out of 462 (83%) of dMSNs responded to dopamine by increasing cAMP. 336 out of 429 (78%) of iMSNs responded by decreasing cAMP level. No dMSNs decreased cAMP and no iMSNs that increased cAMP. C) Dose response curve of cAMP changes to dopamine. n≥10 neurons. D) The EC50 values calculated from data in panel C. dMSN cell body (76.5 ± 13.9 nM dopamine), dMSN dendrite (64 ± 9.4 nM dopamine), iMSN dendrites (177.3 ± 26.2 nM dopamine) and iMSN cell body (429.5 ± 53.3 nM dopamine). Error bars indicate SEM values. * = p<0.05, *** = p<0.0001 E) Comparison of kinetic properties at equivalent sensitivity to dopamine. dMSN cell body exhibited an EC66 of 101.9 ± 14.4 nM dopamine whereas iMSN cell body had an EC66 of 1.02 ± 72.3 μM dopamine. Dotted line indicates time to peak. F) Comparison of kinetic properties at equivalent sensitivity to dopamine. dMSN dendrites had an EC37 of 54.3 ± 10.4 nM dopamine whereas iMSN dendrites had an EC37 of 97.8 ± 12.8 nM dopamine. Normalized percent change in cAMP response was plotted for dMSN dendrite at 50 nM for comparison with iMSN dendrite at 100 nM dopamine. dMSN dendrite required 4.38 ± 0.21 minutes to reach peak response whereas iMSN dendrite required 2.04 ± 0.10 minutes. Dotted line indicates time to peak. G) Histogram of cAMP amplitude to 100 μM dopamine. There was no difference between dMSN cell body and dMSN dendrite (non-parametric t-test; Kolmogorov-Smirnov; p=0.307) or between iMSN cell body and iMSN dendrite (p=0.2398). The dMSN cell body profile significantly differed from iMSN cell body (p<0.001) and dMSN dendrites were significantly different from iMSN dendrites (p<0.05). H) Histogram showing population distribution of neurons according to overall change in their cAMP amount in response to 100 μM dopamine. The net flux of cAMP was significantly greater in dMSN dendrite (6333 ± 261 nmol cAMP) compared with dMSN cell body (2063 ± 74 nmol cAMP) (non-parametric t-test; Kolmogorov-Smirnov; p<0.0001). The net flux of cAMP was significantly greater in iMSN cell body (682 ± 32 nmol cAMP) compared with iMSN dendrite (425 ± 17 nmol cAMP) (non-parametric t-test; Kolmogorov-Smirnov; p<0.0001). I) Responses of striatal neurons to phasic puffs of dopamine (1 μM) applied directly to the neuron being recorded for a brief pulse of 1 second at 5 minute intervals. Representative traces are shown from dMSN and iMSN cell body. J) Quantification of maximum amplitude of phasic dopamine response. dMSN (838 ± 24.6 nM cAMP) was significantly larger compared with iMSN (444 ± 21.1 nM cAMP). Time to peak was significantly faster in iMSNs (1.19 ± 0.09 minutes) compared with dMSNs (1.51 ± 0.10 minutes). Error bars indicate SEM values. N=9 dMSNs and 11 iMSNs. * = p<0.05, *** = p<0.0001 K) Imaging XYZ planes at each time point during application of a single puff of dopamine (1 second; 1 μM) directly to the dMSN being recorded. Pseudocolored FRET images from one representative experiment are shown and time is displayed in minutes relative to dopamine application. LUT values displayed in ΔFRET. L) cAMP response from membrane and cytoplasmic compartments of a dMSN following application of a single puff of dopamine (1 second; 1 μM). Data was averaged from nine neurons.
Figure 3
Figure 3. Probing modulation of cAMP signaling in cultured striatal neurons by adenosine
A) Primary striatal neuron response to bath application of adenosine (1 μM). iMSNs (n=33) positively coupled to cAMP production and dMSNs (n=35 neurons) showed an inhibitory effect. Shading indicates SEM range. B) Dose response curve of cAMP changes to adenosine. n≥10 neurons. Error bars indicate SEM values. C) The EC50 values calculated from data in panel B. The iMSN dendrites (62 ± 17 nM adenosine) were more sensitive to than dMSN dendrites (125 ± 17 nM adenosine) whereas there was no difference between dMSN and iMSN cell body regions (112 ± 34 and 135 ± 19 nM adenosine, respectively). Error bars indicate SEM values. * = p<0.05 D) Comparison of stimulatory Gαolf-mediated responses. There was no difference in the max response at a saturating concentration (100 μM) between dMSN cell body (5701 ± 451 nM cAMP, n=37) and iMSN cell body (6518 ± 562 nM cAMP, n=34), however dMSN dendrite elicited a greater response (17215 ± 607 nM cAMP, n=33) than iMSN dendrite (14352 ± 654 nM cAMP, n=36). Error bars indicate SEM values. * = p<0.05. E) Representative cAMP response from saturating concentration of agonist (100 μM) comparing Gαolf signaling. F) Time to peak at a saturating concentration of agonist (100 μM), dMSN cell body was significantly slower to reach peak response (1.77 ± 0.08 min, n=37) than iMSN cell body (1.47 ± 0.07 min, n=34). Error bars indicate SEM values. * = p<0.05 G) Peak to baseline at a saturating concentration of agonist (100 μM), response termination was significantly faster in dMSN cell body (4.20 ± 0.22 min, n=37) than in iMSN cell body (5.27 ± 0.29 min, n=34). Error bars indicate SEM values. * = p<0.05 H) Comparison of inhibitory Gαi-mediated. There were no differences in the max response elicited at a saturating concentration (100 μM) of agonist between dMSN cell body (711 ± 84 nM cAMP, n=33) and iMSN cell body (702 ± 78 nM cAMP, n=29) or between dMSN dendrite (667 ± 89 nM cAMP, n=36) or iMSN dendrite (711 ± 94 nM cAMP, n=28). Error bars indicate SEM values. I) Representative cAMP response from saturating concentration of agonist (100 μM) comparing Gai signaling. J) Time to peak at a saturating concentration of agonist (100 μM), there was a difference in time-to-peak for responses between dMSN (0.99 ± 0.06 min, n=33) cell body and iMSN cell body (0.96 ± 0.05 min, n=29). Error bars indicate SEM values. K) Peak to baseline at a saturating concentration of agonist (100 μM), response desensitization in dMSN cell body (3.66 ± 0.20 min, n=33) was significantly slower compared with iMSN cell body (3.02 ± 0.17 min, n=29). Error bars indicate SEM values. * = p<0.05.
Figure 4
Figure 4. Defining molecular identity of adenosine receptor subtypes and their segregation across populations of cultured striatal neurons
A) Representative traces of cAMP responses to bath application of A1R agonist (2′MeCCPA, 1 μM) in dMSNs (n= 11) and iMSNs (n= 10) or A3R agonist (2-CL-IB-MECA, 1 μM) in dMSNs (n= 36) or iMSNs (n= 39). B) Dose response curve of cAMP changes to A1R stimulation. n≥7 neurons. Error bars indicate SEM values. C) Response efficacy and potency. The EC50 values in dMSNs (14.6 ± 4.1 nM 2′MeCCPA) were significantly lower than in iMSNs (142.5 ± 9.1 nM 2′MeCCPA). The max amplitude was greater in dMSNs (715 ± 20 nM cAMP) than in iMSNs (516 ± 26 nM cAMP). Error bars indicate SEM values. * =p<0.05, ** = p<0.001 D) Schematic of the CRISPR/Cas9 editing strategy. E) Representative cAMP response in putative iMSNs to bath application of adenosine in either A1R wild-type (WT) or A1R knockout (KO). The time to peak was significantly faster in A1R KO (0.922 ± 0.06 minutes) compared with A1R WT (1.82 ± 0.05 mimutes). The peak to baseline timing was significantly faster in A1R WT (4.43 ± 0.27 minutes) compared with A1R KO (5.41 ± 0.13 minutes). n=18 A1R KO and 33 A1R WT. * =p<0.05, ** = p<0.001
Figure 5
Figure 5. Modulation of cAMP responses in cultured striatal neurons by opioids
A) Responses to neurons to morphine in dMSNs (25 out of 302) and iMSNs (22 out 313). B) Then effect of pretreatment with 50 nM naloxone on subsequent responses to morphine (1 μM). C) Naloxone pretreatment increased the number of responsive neurons from 7.1% (combined dMSNs and iMSNs, n=615) to 28.4% (combined dMSNs and iMSNs, n=356). No differences in behavior of dMSNs and iMSNs neurons were noted. D) Dose response curve of cAMP changes to morphine from naloxone pretreated neurons. n≥7 neurons. Error bars indicate SEM values. E) Response efficacy and potency. Max amplitude of cAMP responses to morphine did not differ between dMSNs and iMSNs (p>0.05) The EC50 was significantly lower for dMSNs (17.4 ± 6.7 nM morphine) than iMSNs (151 ± 29.5 nM morphine). Error bars indicate SEM values. * = p<0.05. F) Comparison of inhibitory Gαi inputs on dMSN. MOR stimulation produced peak response significantly slower (1.75 ± 0.19 min, n= 19) than A1R stimulation (0.96 ± 0.05 min, n= 33) at a saturating concentration of agonist. The response magnitude of MOR-driven response was significantly smaller (621 ± 26 nM cAMP, n= 19) than that of A1R (715 ± 27 nM cAMP, n= 33). Error bars indicate SEM values. * = p<0.05, ** = p<0.001. G) Comparison of inhibitory Gαi inputs on iMSNs. MOR stimulation produced peak response significantly slower (1.84 ± 0.20 min, n= 16) than D2R (0.99 ± 0.06 min, n= 29) or A1R stimulation (1.12 ± 0.09 min, n= 17) at a saturating concentration of agonist. There was no difference in activation time between D2R and A1R-mediated responses. D2R stimulation had a significantly greater response magnitude (769 ± 20 nM cAMP, n= 29) compared with MOR (616 ± 29 nM cAMP, n=16) or A1R (514 ± 34 nM cAMP, n= 17). MOR stimulation was significantly greater than A1R stimulation. Error bars indicate SEM values. * = p<0.05
Figure 6
Figure 6. Interrogating real time cAMP dynamics of striatal circuitry by optogenetics in acute brain slices
A) Schematic of target injection site (left) and validation of AAV expression (right) confined to the ventral tegmental area (VTA) and absent from substantia nigra (SN) and fasciculus retroflexus (fr). B) Schematic of the experimental design in acute slices. C) Representative trace of responses elicited by varying frequency stimulations (20 flashes, 2-ms duration/flash). n≥15 neurons. D) The dependence of cAMP response amplitude on stimulation frequency. Error bars are SEM values. E) dMSNs were more sensitive to lower frequencies of stimulation achieving half maximal response at 9.51 ± 1.16 Hz compared with iMSNs (13.24 ± 1.09 Hz). Error bars are SEM values. * = p<0.05. F) Peak width at half-maximal response for each frequency. Error bars are SEM values. G) Quantification of rebound oscillation amplitude in the opposite direction of the initial response. Error bars are SEM values. H) cAMP response at varying durations of inter-stimulation intervals (ISI). n≥17 neurons. I) Max amplitude of cAMP responses with increase ISI. Linear regression fit shown as r2. Error bars are SEM values. J) cAMP response aggregation as a function of inter-stimulation interval duration. Error bars are SEM values.
Figure 7
Figure 7. Approach for region-specific control of sensor expression to study endogenous GPCR stimulation across brain regions
A) Schematic of experimental strategy targeting hippocampus and cortex. B) TEpacVV fluorescence in CA1 pyramidal neurons in hippocampus (top panel, middle panel) or in cortical neurons (bottom panel). Scale bar in top and bottom panel represents 50 μm whereas scale bar in middle panel represents 10 μm. C) Quantification of basal cAMP level determined by FRET imaging. Error bars are SEM values. * = p<0.05. D) Averaged traces of cAMP response to dopamine (10 μM) and forskolin/IBMX (50/200 μM). n>10 neurons. E) Max cAMP amplitude to dopamine. n>10 neurons. Error bars are SEM values. * = p<0.05. F) Averaged traces of cAMP response to 2′MeCCPA (1 μM) and forskolin/IBMX (50/200 μM. n>10 neurons. G) Max cAMP amplitude to 2′MeCCPA. n>10 neurons. Error bars are SEM values. * = p<0.05.

Comment in

References

    1. Albin RL, Young AB, Penney JB. The functional anatomy of basal ganglia disorders. Trends Neurosci. 1989;12:366–375. - PubMed
    1. Bargmann CI, Marder E. From the connectome to brain function. Nat Methods. 2013;10:483–490. - PubMed
    1. Brinton RE. Neuromodulation: associative and nonlinear adaptation. Brain research bulletin. 1990;24:651–658. - PubMed
    1. Chen Y, Saulnier JL, Yellen G, Sabatini BL. A PKA activity sensor for quantitative analysis of endogenous GPCR signaling via 2-photon FRET-FLIM imaging. Front Pharmacol. 2014;5:56. - PMC - PubMed
    1. Cropper EC, Friedman AK, Jing J, Perkins MH, Weiss KR. Neuromodulation as a mechanism for the induction of repetition priming. Curr Opin Neurobiol. 2014;29:33–38. - PMC - PubMed

Publication types