. 2018 Jan 2;22(1):269-285.
doi: 10.1016/j.celrep.2017.12.039.

The Aging Astrocyte Transcriptome from Multiple Regions of the Mouse Brain

Affiliations

The Aging Astrocyte Transcriptome from Multiple Regions of the Mouse Brain

Matthew M Boisvert et al. Cell Rep. .

Abstract

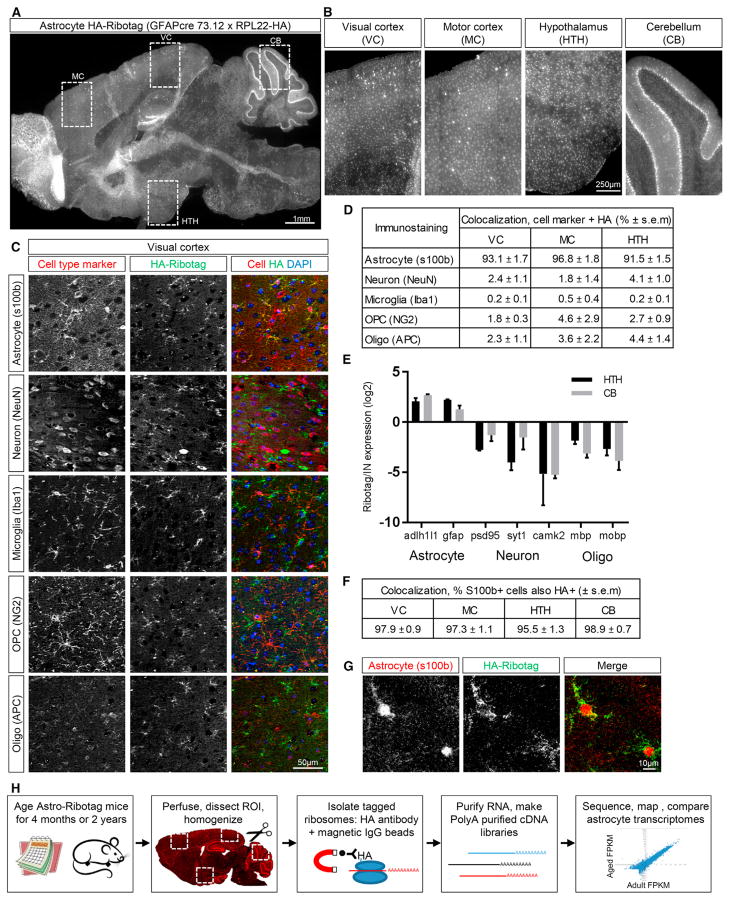
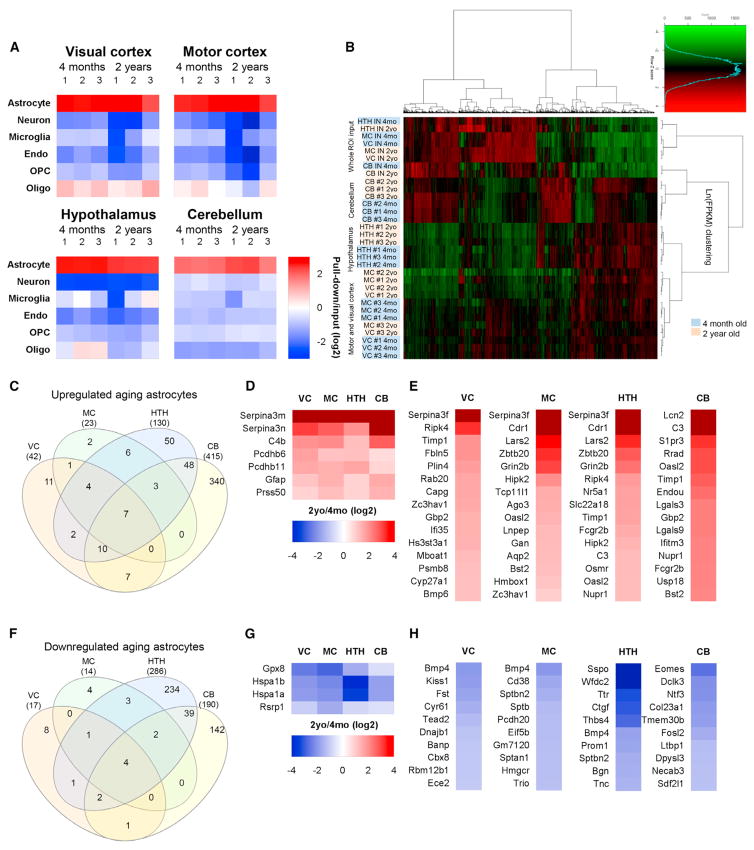
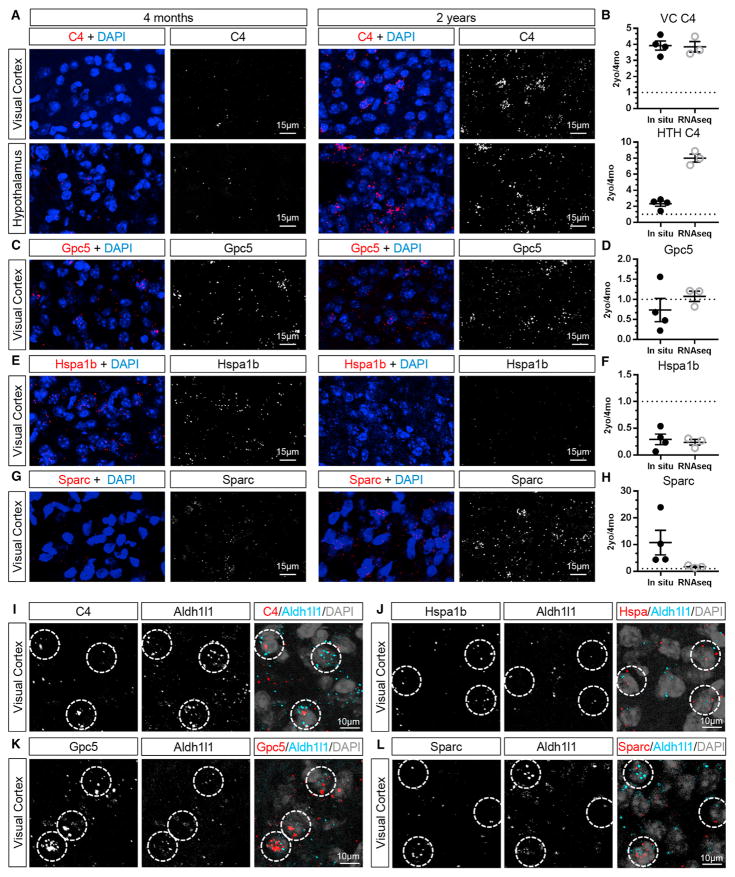
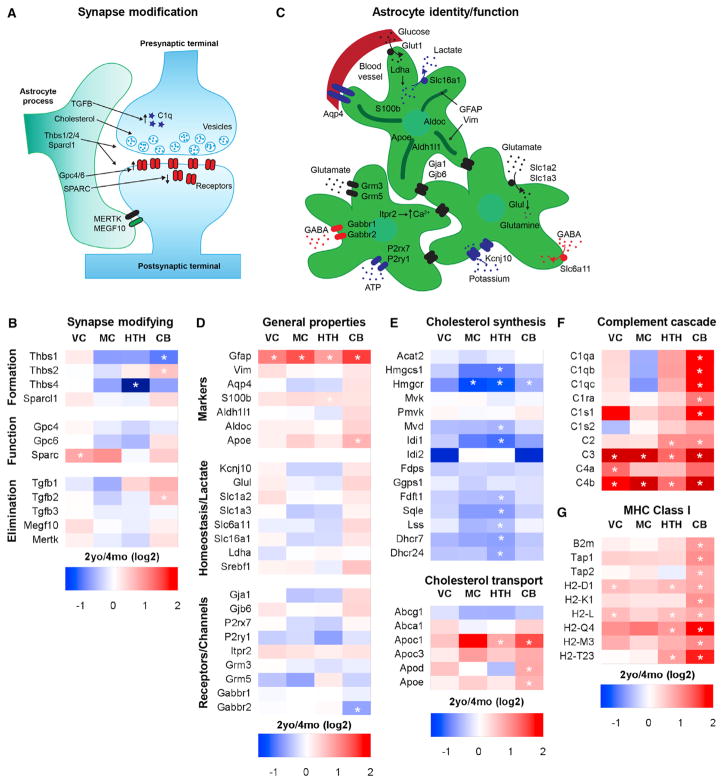
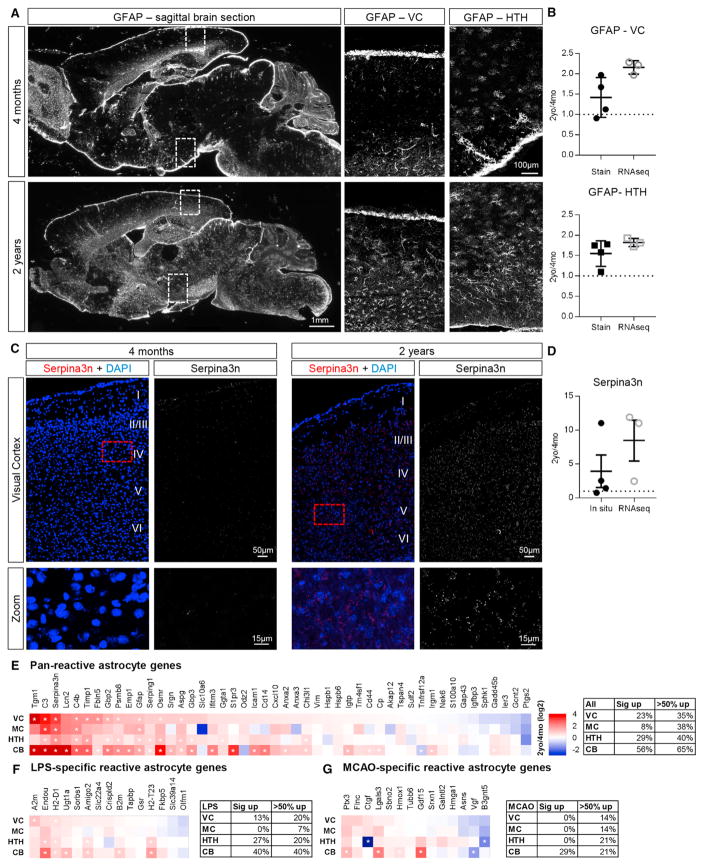
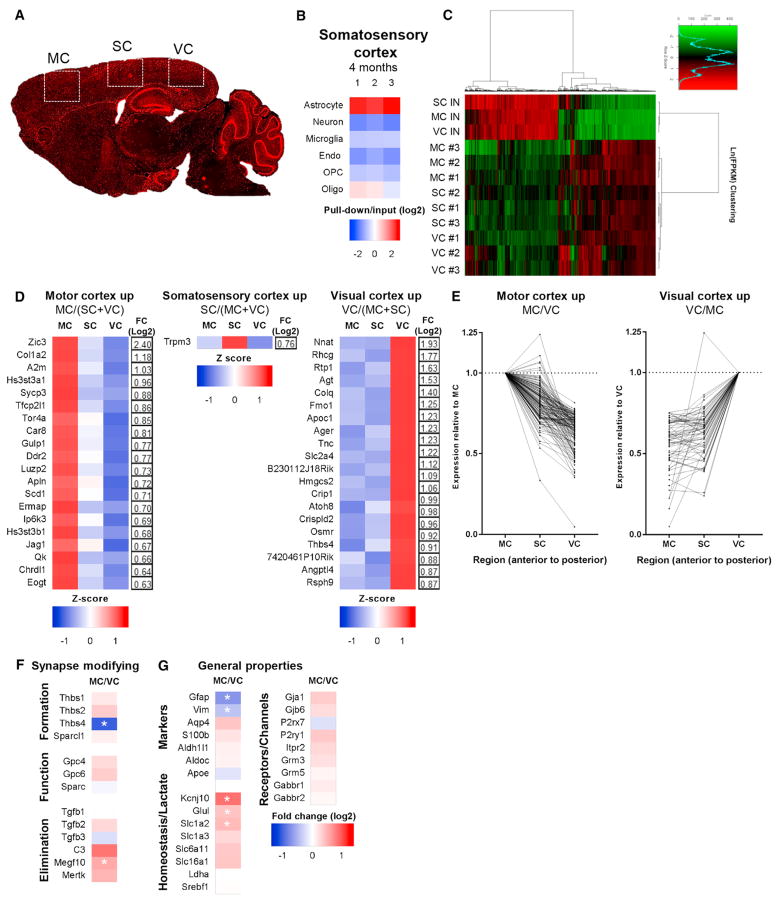
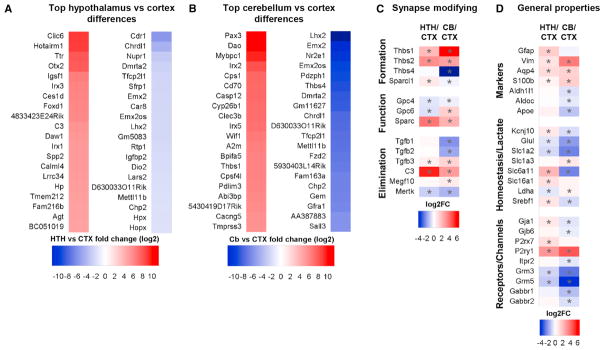
Aging brains undergo cognitive decline, associated with decreased neuronal synapse number and function and altered metabolism. Astrocytes regulate neuronal synapse formation and function in development and adulthood, but whether these properties change during aging, contributing to neuronal dysfunction, is unknown. We addressed this by generating aged and adult astrocyte transcriptomes from multiple mouse brain regions. These data provide a comprehensive RNA-seq database of adult and aged astrocyte gene expression, available online as a resource. We identify astrocyte genes altered by aging across brain regions and regionally unique aging changes. Aging astrocytes show minimal alteration of homeostatic and neurotransmission-regulating genes. However, aging astrocytes upregulate genes that eliminate synapses and partially resemble reactive astrocytes. We further identified heterogeneous expression of synapse-regulating genes between astrocytes from different cortical regions. We find that alterations to astrocytes in aging create an environment permissive to synapse elimination and neuronal damage, potentially contributing to aging-associated cognitive decline.

Keywords: aging; astrocyte; neurodegeneration; synapse.


Conflict of interest statement

DECLARATION OF INTERESTS

The authors declare no competing interests.

Figures

Figure 1
Figure 1. Characterization of the Astrocyte-Ribotag Mouse Model
(A) Sagittal brain section from 4-month-old astrocyte-ribotag mouse immunostained for HA to visualize ribosomes; image is a mosaic of tile images acquired at 10x. (B) Zoomed-in images from (A), regions of HA-tagged ribosome purification (VC, MC, HTH, CB); images are cropped from the mosaic tile image. (C) Immunostaining for HA and cell-specific markers in VC to determine cell-type expression of HA-tagged ribosomes. Images cropped from a larger mosaic of tiles acquired at 20x. (D) Quantification of cell-specific staining shows majority of HA-tagged ribosomes are in astrocytes. n = 3 × 4 month mice/brain region. (E) qRT-PCR from HTH and CB astrocyte-ribotag-isolated mRNA shows enrichment for astrocyte mRNAs over other cell types, compared to total (input) mRNA. n = 3 × 2 year mice/brain region; graph mean ± SEM. (F) Quantification of S100b positive cells that are also HA positive; n = 3 × 4 month mice/brain region. (G) Immunostaining for HA and S100b shows ribosomes present throughout astrocyte processes in VC. (H) Schematic of the experimental paradigm—purification of astrocyte-enriched mRNA from multiple brain regions of adult (4-month-old) and aging (2-year-old) mice, followed by RNA-seq and analysis. See also Figures S1 and S2.
Figure 2
Figure 2. Purification and RNA-Seq of Astrocyte-Enriched mRNA Identifies Differentially Expressed Genes between Adult and Aging Astrocytes
(A) Analysis of RNA-seq data for cell-specific mRNA demonstrates enrichment for astrocytes over other cell types in the pull-down (astrocyte mRNA) compared with input (total mRNA) (see Table S1 for the gene list). (B) Clustering analysis of the top 4,401 expressed genes shows that astrocyte-ribotag pull-down samples cluster away from input mRNA; samples cluster by region of isolation and, within region, by age. n = 3 mice for each brain region and age (astrocyte samples). See Table S2 for FPKM for all genes. (C) Venn diagram showing overlap of genes upregulated in astrocytes from 4 different brain regions between 4 months and 2 years. (D) Heatmap of genes that are significantly upregulated in astrocytes by aging in all regions. (E) Heatmaps of top 15 genes upregulated in astrocytes in each brain region by aging (excluding those in D; see Tables S3 and S4 for a full list). (F) Venn diagram of genes downregulated in astrocytes from 4 different brain regions between 4 months and 2 years. (G) Heatmap of genes that are significantly downregulated in astrocytes by aging in all regions. (H) Heatmaps of the top 10 genes downregulated in astrocytes in each brain region by aging (excluding those in G; see Tables S3 and S4 for a full list). All heatmaps presented as fold change 2 years/4 months (log2). See also Figure S1 and Tables S1, S2, S3, and S4.
Figure 3
Figure 3. Validation of Aging-Induced Changes in Astrocyte Gene Expression by In Situ Hybridization
(A, C, E, and G) In situ hybridization to detect mRNA for candidate genes in 4-month-old (left) and 2-year-old (right) mouse brains, with lipofuscin subtracted for clarity (as in Figure S3). Shown are in situ hybridization for a gene upregulated in astrocytes by aging in the VC and HTH, C4 (A); unchanged in the VC, Gpc5 (C); downregulated in the VC, Hspa1b (E); and upregulated in the VC, Sparc (G). For whole-region images encompassing the area analyzed, see Figure S4. (B, D, F, and H) Quantification of fold change in mRNA expression detected by in situ hybridization between 2 years and 4 months compared with fold change detected by RNA-seq, showing similar fold change (B: C4; D: Gpc5; F: Hspa1b; H: Sparc). Data are presented as a scatterplot of individual points with mean ± SEM. In situ, n = 4 4-month-old and 4 2-year-old mice; RNA-seq, n = 3 4-month-old and 3 2-year-old mice. (I–L) Double in situ hybridization with the astrocyte marker Aldh1l1 and C4 (I), Gpc5 (K), and Sparc (L) in 2-year-old VC and Hspa1b (J) in 4-month-old VC. Circles mark astrocytes expressing the target probe and Aldh1l1. See also Figures S3 and S4.
Figure 4
Figure 4. Astrocyte Marker and Synapse-Modifying Gene Expression in the Aging Brain
(A and B) Schematic of astrocyte-expressed genes that regulate neuronal synapse formation, function, and elimination (A), with the corresponding heatmap (B) demonstrating region-specific increased expression of genes that inhibit synaptic function and eliminate synapses. (C and D) Schematic of genes important for astrocyte identity and function: astrocyte markers and metabolism (top astrocyte), homeostatic functions (right astrocyte), and neurotransmitter receptors (left astrocyte) (C), with the corresponding heatmap (D) showing minimal changes in aging. (E) Enzymes in the cholesterol synthesis pathway are downregulated in aging astrocytes, whereas cholesterol-transporting proteins are upregulated. (F and G) Immune/antigenic response pathways implicated in synapse elimination, the complement cascade (F), and MHC (G), are upregulated in aging astrocytes. All heatmaps are presented as 2-year/4-month (log2) fold change for each brain region. *, significantly altered between 2-year and 4-month astrocytes. See also Table S5.
Figure 5
Figure 5. Aging Astrocytes Upregulate Expression of Genes that Overlap with Reactive Astrocytes
(A) Immunohistochemistry for Gfap in 4-month (top) and 2-year (bottom) mouse brain demonstrates increased Gfap protein in multiple regions (VC and HTH) of the aging brain; overview images are mosaic of tile images acquired at 10x (left) and zoomed-in images are cropped from mosaic of tiles acquired at 20x (right). (B) Quantification of Gfap immunostaining in the VC (top) and HTH (bottom) compared with RNA-seq. (C) In situ hybridization for Serpina3n in 4-month (left) and 2-year (right) VC demonstrates increased Seprina3n in the aging VC. Images are mosaic of tiles acquired at 20x. (D) Quantification of Serpina3n mRNA in the VC, comparing in situ hybridization with RNA-seq. (B and D) Data are presented as scatterplots of individual points with mean ± SEM. Immunostaining and in situ, n = 4 4-month-old and 4 2-year-old mice; RNA-seq, n = 3 4-month-old and 3 2-year-old mice. (E–G) Comparison of fold change in expression of reactive astrocyte genes between adult and aging astrocytes shows that overlap varies by brain region. (E) Pan-reactive astrocyte genes. (F) LPS-specific reactive astrocyte genes. (G) MCAO-specific reactive astrocyte genes. Heatmaps are presented as 2-year/4-month (log2) fold change for each brain region. *, significantly altered between 2-year and 4-month astrocytes.
Figure 6
Figure 6. Adult Cortical Astrocytes Show Region-Dependent Gene Expression
(A) Schematic of cortical regions examined at 4 months. MC and VC, same as before; somatosensory cortex (SC), new. (B) Analysis of RNA-seq data for cell-specific mRNA demonstrates enrichment for SC astrocytes over other cell types in the pull-down (astrocyte mRNA) compared with input (total mRNA) (see Table S1 for the gene list). (C) Clustering analysis of the top 3,487 expressed genes shows that astrocyte-ribotag pull-down samples cluster by cortical region. n = 3 4-month-old mice per region. (D) Heatmaps and fold change of the top 20 genes significantly upregulated in astrocytes in individual cortical regions compared with all other cortical regions (MC, SC, and VC), presented as row Z score. (E) Genes significantly differentially expressed between the MC versus VC show a gradient of gene expression, normalized to the MC (left) or VC (right). One gene (Cdr1) exceeds the axis range and is excluded for clarity (see Table S7 for the full list). (F and G) Heatmap of synapse-modifying (F) and general astrocyte property (G) gene expression changes between the MC and VC, expressed as log2 (fold change). *, significantly altered between regions. See also Tables S1, S6, S7, and S8.
Figure 7
Figure 7. Regional Differences between Adult Astrocytes
(A and B) Heatmaps of the top 20 regional astrocyte-enriched genes between adult regions, presented as log2 fold change of HTH (A) or CB (B) FPKM/combined CTX FPKM (see Table S7 for the full list). (C and D) Comparison of expression of genes that are important for astrocyte regulation of synapses (C) and for astrocyte functions (D), between the HTH and CTX, and CB and CTX, presented as log2 fold change of HTH or CB/CTX. *, significantly altered between regions. See also Tables S6, S7, and S8.

References

    1. Allen NJ. Astrocyte regulation of synaptic behavior. Annu Rev Cell Dev Biol. 2014;30:439–463. - PubMed
    1. Allen NJ, Bennett ML, Foo LC, Wang GX, Chakraborty C, Smith SJ, Barres BA. Astrocyte glypicans 4 and 6 promote formation of excitatory synapses via GluA1 AMPA receptors. Nature. 2012;486:410–414. - PMC - PubMed
    1. Bellaver B, Souza DG, Souza DO, Quincozes-Santos A. Hippocampal Astrocyte Cultures from Adult and Aged Rats Reproduce Changes in Glial Functionality Observed in the Aging Brain. Mol Neurobiol. 2017;54:2969–2985. - PubMed
    1. Berchtold NC, Sabbagh MN, Beach TG, Kim RC, Cribbs DH, Cotman CW. Brain gene expression patterns differentiate mild cognitive impairment from normal aged and Alzheimer’s disease. Neurobiol Aging. 2014;35:1961–1972. - PMC - PubMed
    1. Bialas AR, Stevens B. TGF-β signaling regulates neuronal C1q expression and developmental synaptic refinement. Nat Neurosci. 2013;16:1773–1782. - PMC - PubMed

Publication types