. 2018 Jan 2;22(1):8-16.
doi: 10.1016/j.celrep.2017.12.016.

Dynamic Remodeling of Pericytes In Vivo Maintains Capillary Coverage in the Adult Mouse Brain

Affiliations

Dynamic Remodeling of Pericytes In Vivo Maintains Capillary Coverage in the Adult Mouse Brain

Andrée-Anne Berthiaume et al. Cell Rep. .

Abstract

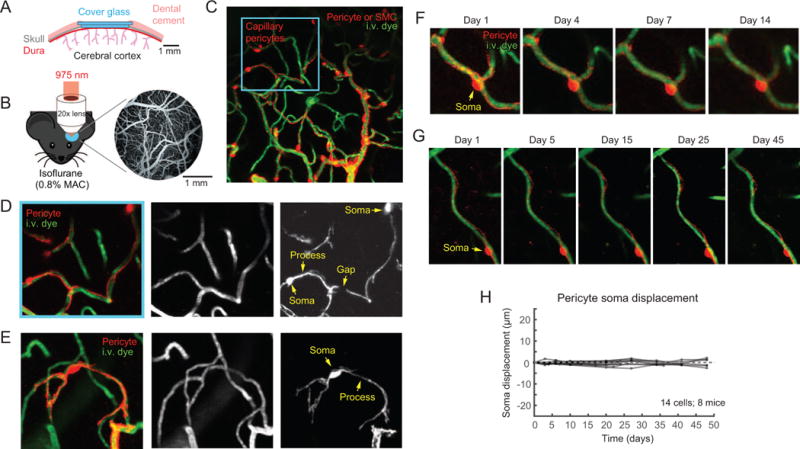
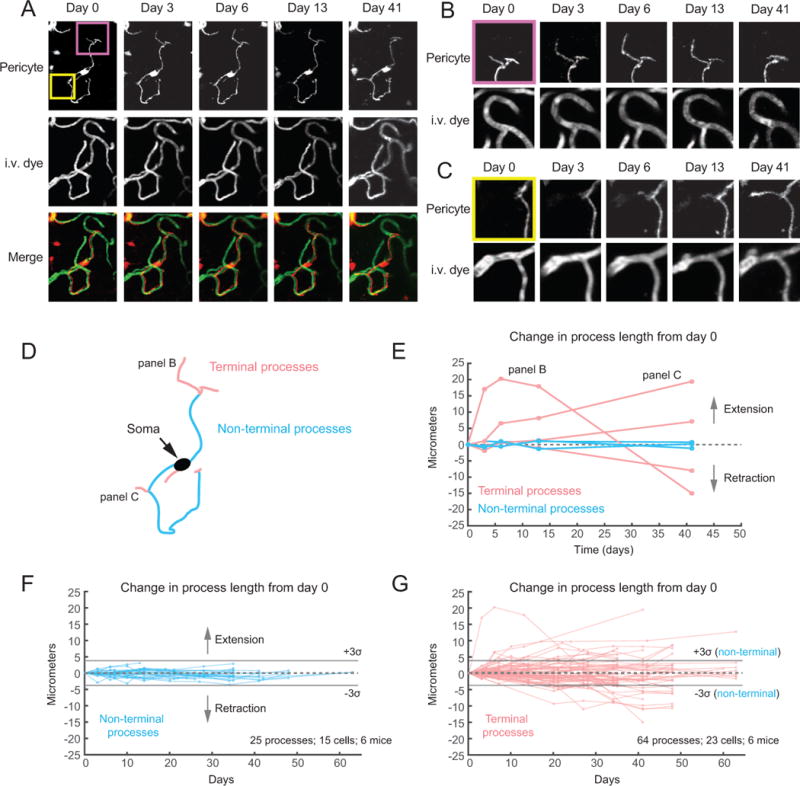
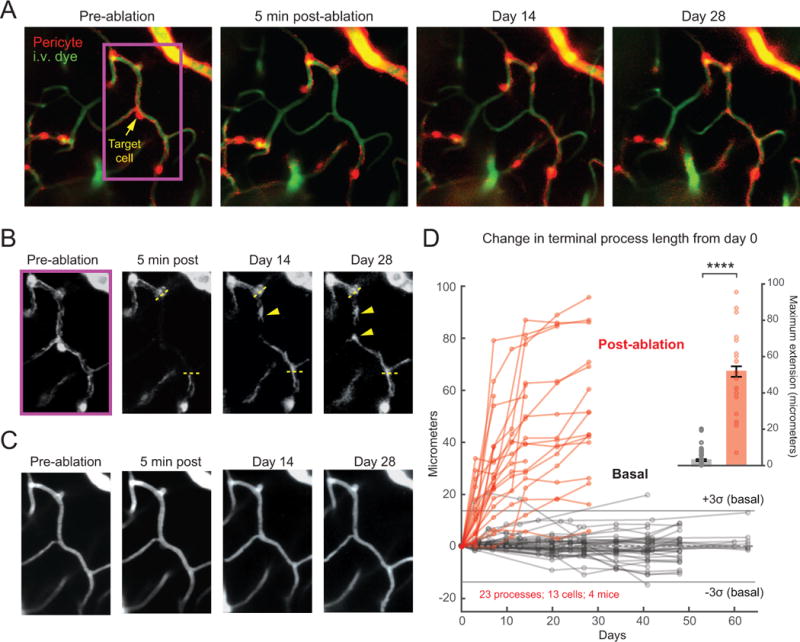
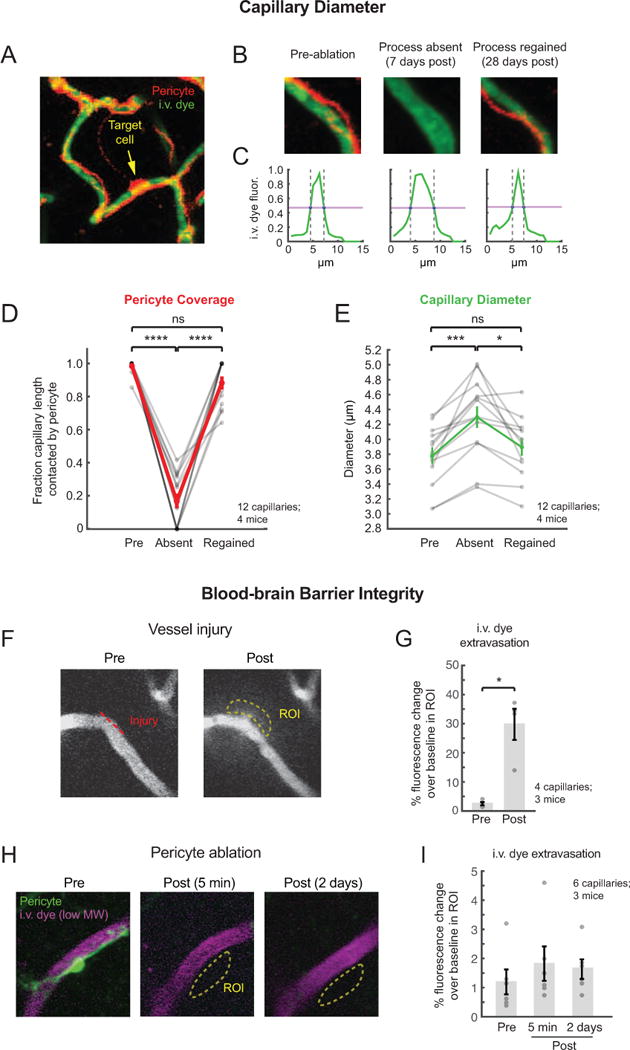
Direct contact and communication between pericytes and endothelial cells is critical for maintenance of cerebrovascular stability and blood-brain barrier function. Capillary pericytes have thin processes that reach hundreds of micrometers along the capillary bed. The processes of adjacent pericytes come in close proximity but do not overlap, yielding a cellular chain with discrete territories occupied by individual pericytes. Little is known about whether this pericyte chain is structurally dynamic in the adult brain. Using in vivo two-photon imaging in adult mouse cortex, we show that while pericyte somata were immobile, the tips of their processes underwent extensions and/or retractions over days. The selective ablation of single pericytes provoked exuberant extension of processes from neighboring pericytes to contact uncovered regions of the endothelium. Uncovered capillary regions had normal barrier function but were dilated until pericyte contact was regained. Pericyte structural plasticity may be critical for cerebrovascular health and warrants detailed investigation.

Keywords: Alzheimer’s disease; blood flow; blood-brain barrier; capillary; dementia; endothelium; pericyte; plasticity; stroke; two-photon imaging.


Conflict of interest statement

Declaration of Interests. The authors declare no competing interests.

Figures

Figure 1
Figure 1. Chronic in vivo imaging of capillary pericytes with two-photon microscopy
A,B) A chronic skull-removed cranial imaging window was implanted over the left somatosensory cortex, and in vivo two-photon microscopy was performed under isoflurane anesthesia. C) Imaging through the cranial window reveals an intricate network of small vessels, labeled green with intravenously administered 2 MDa FITC-dextran (i.v. dye). Mural cells labeled red through genetically expressed tdTomato. Image from Myh11-tdTomato mouse. D) High-resolution imaging allows for the visualization of detailed capillary pericyte structure (inset from panel C). The image highlights two pericyte somata from which arise several thin, elongated processes. Gaps between the processes of adjacent pericytes are also occasionally observed. E) Representative image of an isolated pericyte. Image from Myh11-tdTomato mouse. F,G) Representative images of pericyte somata observed over time. Soma location was determined by measuring the distance from a stable capillary branchpoint (reference point) to the center of the pericyte soma. Images from NG2-tdTomato mouse (panel F) and Myh11-tdTomato mouse (panel G). H) Compiled soma displacement measurements over time (n=14 cells over 8 mice, 5 NG2-tdTomato and 3 Myh11-tdTomato).
Figure 2
Figure 2. Structural dynamics of capillary pericytes under basal conditions
A) Longitudinal in vivo two-photon imaging of a single pericyte reveals the structural plasticity of pericytes processes, in contrast to the stability of the underlying blood vessels. Image from Myh11-tdTomato mouse. B) An inset of a process of interest, which extended beyond its baseline length over the course of 2-weeks, and completely retracted by 41 days. No changes were observed in the structure of capillaries occupied by the pericyte. C) An inset of a second structurally dynamic process that extended along a stable capillary network over the course of 41 days. D) A schematic showing the distinction between terminal (pink) and non-terminal (blue) pericyte processes. E) Quantification of change in process lengths over time for the cell in panels A–D. F) Composite data from all non-terminal processes tracked over time (n = 25 processes from 15 cells over 6 mice; 5 NG2-tdTomato, 1 Myh11-tdTomato). See also Figure S1C,E. G) Composite data from all terminal processes tracked over time (n = 64 processes from 23 cells over 6 mice; 5 NG2-tdTomato, 1 Myh11-tdTomato). A ± 3 standard deviation range (3σ) for data from non-terminal processes is shown for statistical comparison with terminal process change. See also Figure S1D,F and S2.
Figure 3
Figure 3. Robust extension of terminal processes in response to ablation of a single pericyte
A) Example of single pericyte ablation experiment. The tracking of processes from neighboring pericytes over time revealed growth into the territory of the ablated cell (white arrowheads). Image from a Myh11-tdTomato mouse. See also Figure S3. B) High-resolution images of the tdTomato channel showing pericyte structure over time. Yellow dotted line is boundary for domain of ablated pericyte. Yellow arrowheads highlight growth cone-like varicosities. See also Figure S4. C) High-resolution images of FITC-dextran channel showing stable capillary structure. D) Composite data of terminal process change over time following the ablation of a single neighboring pericyte (red). A ± 3 standard deviation range (3σ) for data from terminal processes under basal conditions (black; from Fig. 2G) is shown for statistical comparison with terminal process change in length after ablation. An inset graph compares maximum distances of process extension in basal and post-ablation groups. ****P<0.0001, unpaired t-test (t = 16.17, df = 85; n = 64 terminal processes for basal conditions, and n = 23 terminal processes of neighboring pericytes from 13 ablation experiments over 4 mice; 1 NG2-tdTomato, 2 Myh11-tdTomato, 1 PDGFRβ-YFP). Data is presented as mean ± s.e.m..
Figure 4
Figure 4. Capillary changes following pericyte ablation
A) Image of capillaries covered by a pericyte targeted for ablation from a Myh11-tdTomato mouse. B) Inset region shows a capillary segment measured before pericyte ablation, and 7 and 28 days post-ablation. C) Normalized fluorescence intensity profiles collected across the capillary width (green) were used to calculate capillary diameter at half maximum (purple line) at each time-point. D,E) Plot of pericyte coverage (E) and capillary diameter (F) over time. For each capillary segment, three time points were sampled: one pre-ablation time point, one post-ablation time point where pericyte coverage of the capillary was completely or partially lost (Time 1; selections ranged between 3 to 14 days), and one subsequent post-ablation time point where pericyte coverage was completely or partially regained (Time 2; selections ranged between 7 to 28 days). For pericyte coverage, p<0.0001 main effect, F(1.591, 19.1) = 136.8, one-way ANOVA with repeated measures; ****p<0.0001 for Tukey post hoc test; ns = non-significant. For vessel diameter, p<0.0001 main effect, F(1.702, 18.72) = 16.76, one-way ANOVA with repeated measures; ***p<0.001, *p<0.05 for Tukey post hoc test. N = 12 pericyte ablations/capillaries from 4 mice; 1 NG2-tdTomato, 2 Myh11-tdTomato, 1 PDGFRβ-YFP. Red and green lines report mean ± s.e.m.. F) Example images during i.v. bolus injection of Alexa 647 cadaverine to assess BBB integrity. An image before and after line-scan induced capillary injury is shown. Image from NG2-tdTomato mouse. G) Average Alexa 647 fluorescence change over baseline (fluorescence prior to bolus injection) in ROIs placed immediately adjacent to the injured capillary. *P<0.05, paired t-test (t = 5.305, df = 3; n = 4 capillaries). N = 4 capillaries from 3 mice; 1 NG2-tdTomato, 2 PDGFRβ-YFP. Data is presented as mean ± s.e.m.. H) Example images during i.v. bolus injection of Alexa 647 cadaverine before and after targeted pericyte ablation. Image from PDGFRβ-YFP mouse. I) Average Alexa 647 fluorescence change over baseline in ROIs placed immediately adjacent to uncovered capillary. P=0.45, main effect, one-way ANOVA with repeated measures. N = 6 pericyte ablations/capillaries from 3 mice; 1 NG2-tdTomato, 2 PDGFRβ-YFP. Data is presented as mean ± s.e.m..

References

    1. Allt G, Lawrenson JG. Pericytes: cell biology and pathology. Cells, tissue, organs. 2001;169:1–11. - PubMed
    1. Armulik A, Abramsson A, Betsholtz C. Endothelial/pericyte interactions. Circulation Research. 2005;97:512–523. - PubMed
    1. Armulik A, Genove G, Betsholtz C. Pericytes: Developmental, physiological, and pathological perspectives, problems and promises. Developmental Cell. 2011;21:193–215. - PubMed
    1. Armulik A, Genové G, Mäe M, Nisancioglu MH, Wallgard E, Niaudet C, He L, Norlin J, Lindblom P, Strittmatter K, et al. Pericytes regulate the blood-brain barrier. Nature. 2010;468:557–561. - PubMed
    1. Attwell D, Mishra A, Hall CN, O’Farrell FM, Dalkara T. What is a pericyte? Journal of Cerebral Blood Flow & Metabolism. 2015;36:451–455. - PMC - PubMed

Publication types