. 2018 Jan;30(1):83-100.
doi: 10.1105/tpc.17.00653. Epub 2018 Jan 3.

At-MINI ZINC FINGER2 and Sl-INHIBITOR OF MERISTEM ACTIVITY, a Conserved Missing Link in the Regulation of Floral Meristem Termination in Arabidopsis and Tomato

Affiliations

At-MINI ZINC FINGER2 and Sl-INHIBITOR OF MERISTEM ACTIVITY, a Conserved Missing Link in the Regulation of Floral Meristem Termination in Arabidopsis and Tomato

Norbert Bollier et al. Plant Cell. 2018 Jan.

Abstract

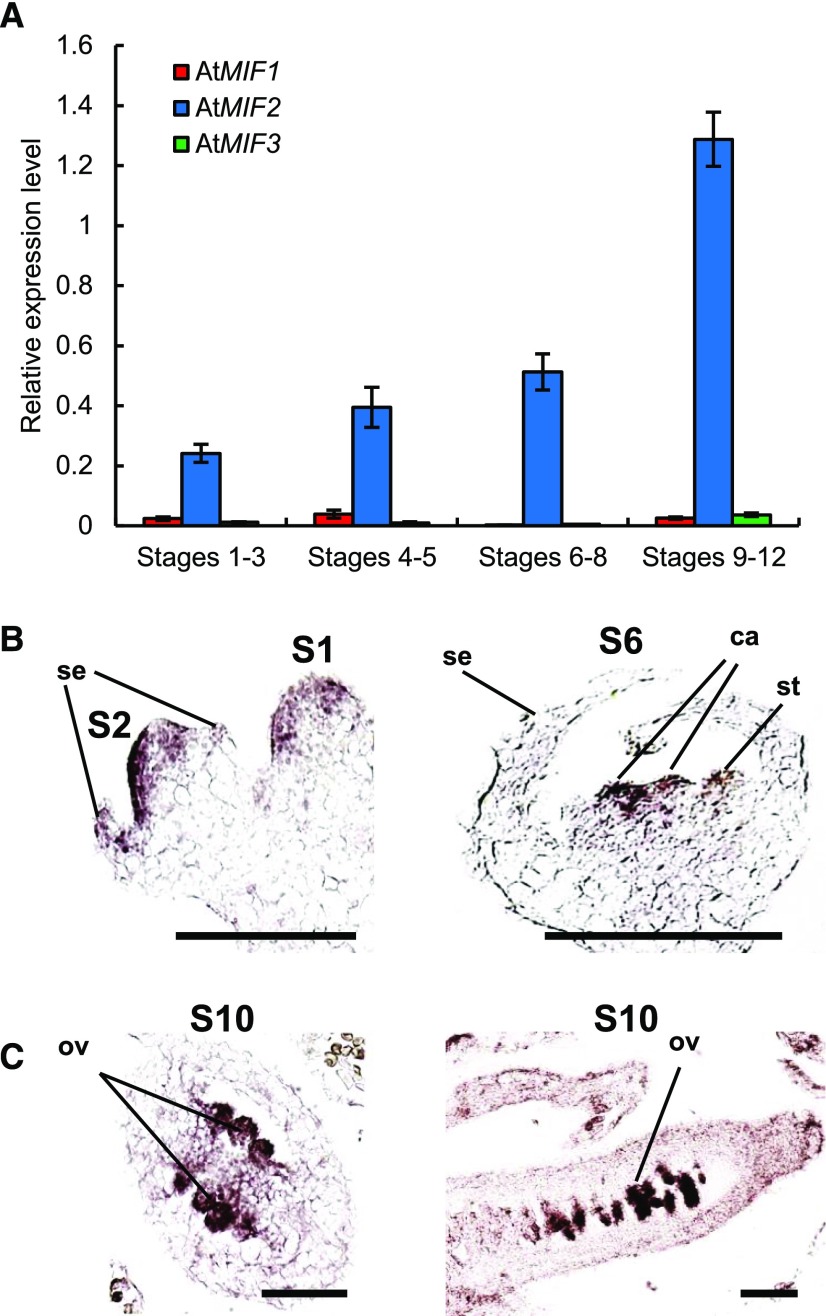
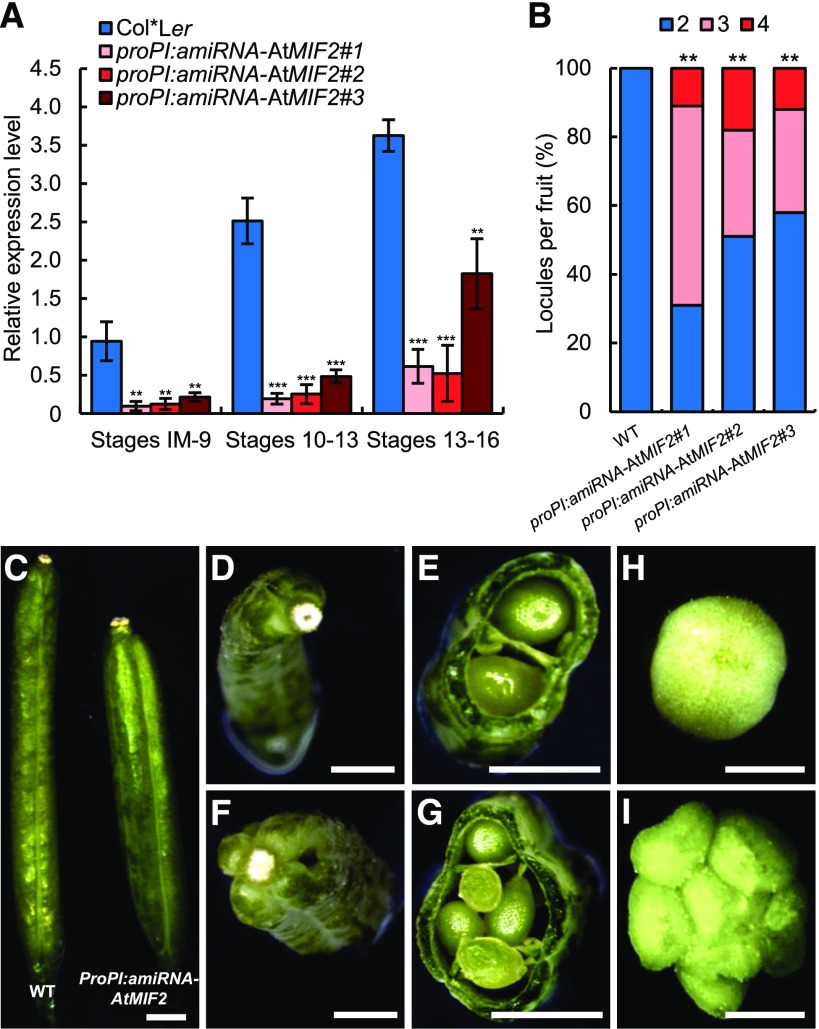
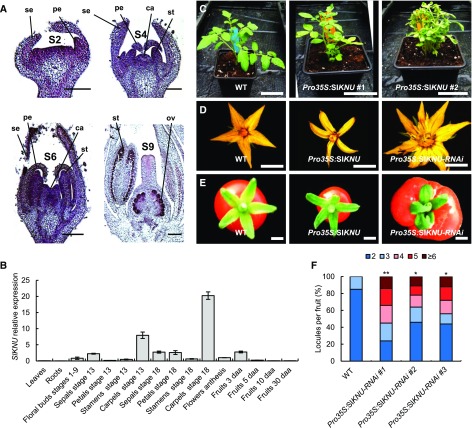
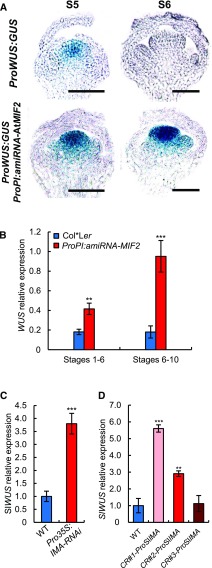
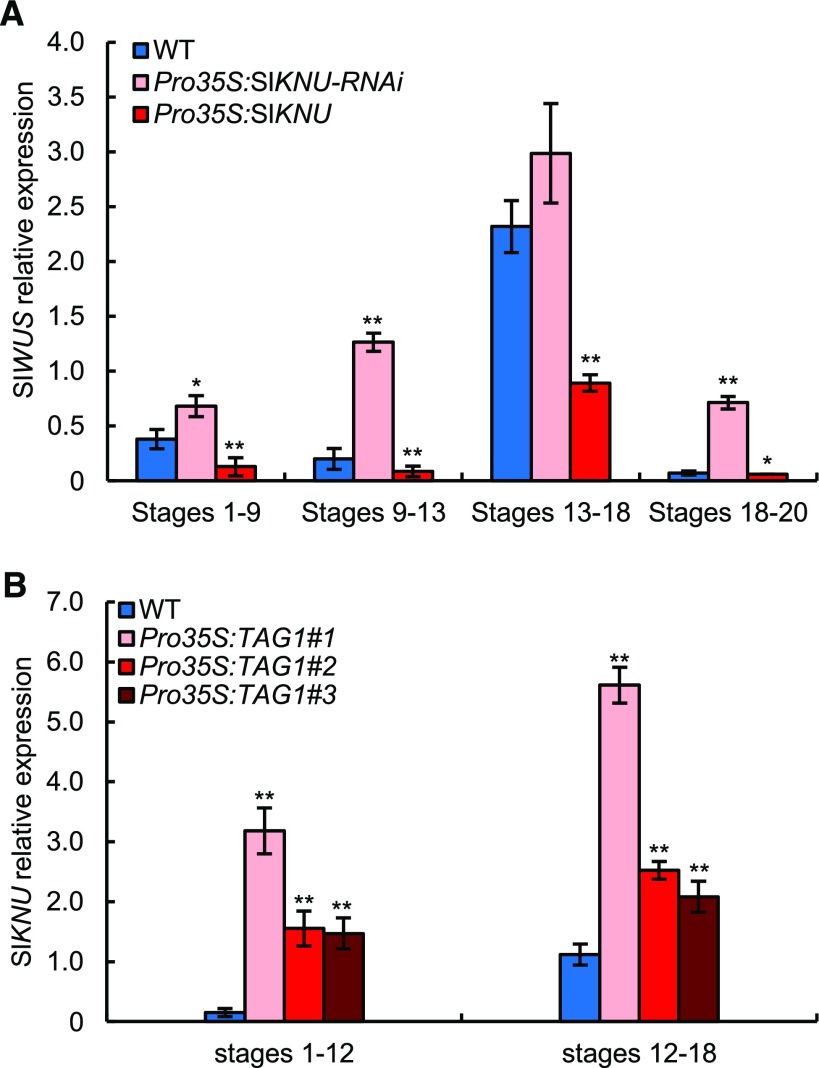
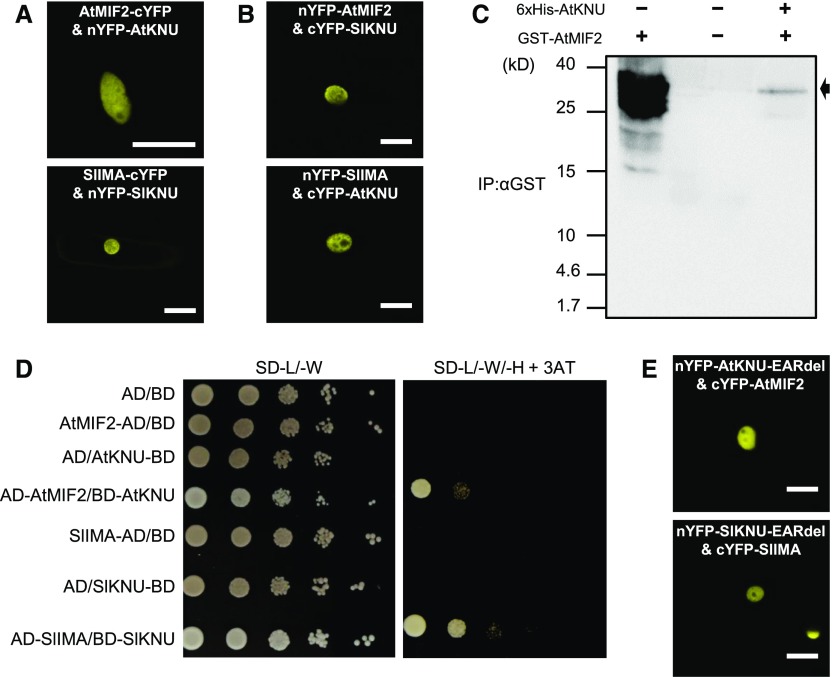
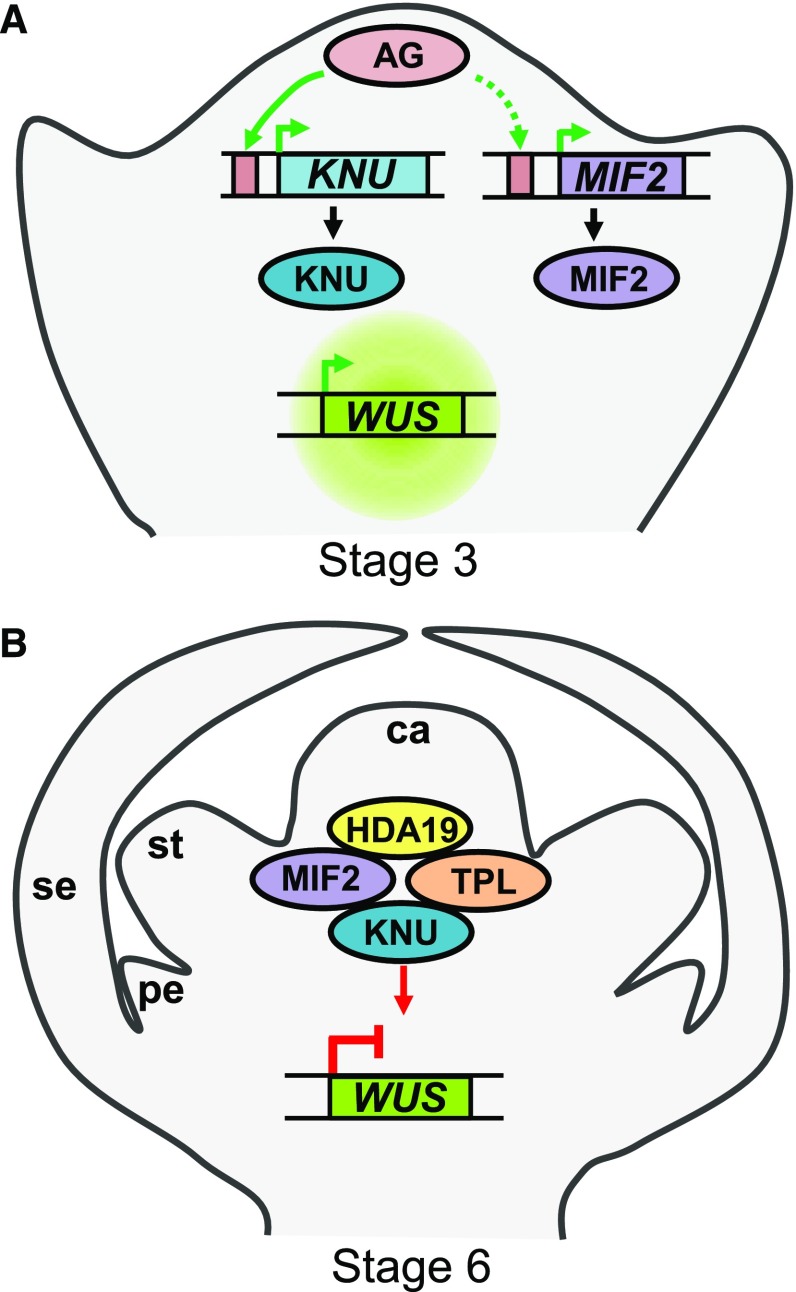
In angiosperms, the gynoecium is the last structure to develop within the flower due to the determinate fate of floral meristem (FM) stem cells. The maintenance of stem cell activity before its arrest at the stage called FM termination affects the number of carpels that develop. The necessary inhibition at this stage of WUSCHEL (WUS), which is responsible for stem cell maintenance, involves a two-step mechanism. Direct repression mediated by the MADS domain transcription factor AGAMOUS (AG), followed by indirect repression requiring the C2H2 zinc-finger protein KNUCKLES (KNU), allow for the complete termination of floral stem cell activity. Here, we show that Arabidopsis thaliana MINI ZINC FINGER2 (AtMIF2) and its homolog in tomato (Solanum lycopersicum), INHIBITOR OF MERISTEM ACTIVITY (SlIMA), participate in the FM termination process by functioning as adaptor proteins. AtMIF2 and SlIMA recruit AtKNU and SlKNU, respectively, to form a transcriptional repressor complex together with TOPLESS and HISTONE DEACETYLASE19. AtMIF2 and SlIMA bind to the WUS and SlWUS loci in the respective plants, leading to their repression. These results provide important insights into the molecular mechanisms governing (FM) termination and highlight the essential role of AtMIF2/SlIMA during this developmental step, which determines carpel number and therefore fruit size.


Figures

Figure 1.
Figure 1.
Flower-Specific Expression of AtMIF Genes in Arabidopsis. (A) Expression analysis of AtMIF1, AtMIF2, and AtMIF3 in Col-0 flower buds at various developing stages using qRT-PCR. Error bars represent sd of three biological replicates. (B) Expression analysis of AtMIF2 by in situ hybridization in Arabidopsis Col-0 developing flower buds at stages 1 and 2 (left panel), and stage 6 (right panel). se, sepal; st, stamen; ca, carpel. Bars = 100 μm. (C) Expression analysis of AtMIF2 by in situ hybridization in ovary of Arabidopsis Col-0 developing flower buds at stage 10. Transverse section of the ovary (left panel); longitudinal section of the ovary (right panel). ov, ovule. Bars = 100 μm.
Figure 2.
Figure 2.
Fruit Phenotypes of AtMIF2 and SlIMA Loss-of-Function Plants in Arabidopsis and Tomato, Respectively. (A) Expression analysis of AtMIF2 in three independent ProPI:amiRNA-AtMIF2 plants compared with Col*Ler wild-type plants at various stages of flower development using qRT-PCR. Error bars represent sd of three biological replicates, and asterisks indicate significant differences from the control (Col*Ler) using two-tailed t test (*P < 0.05, **P < 0.01, and ***P < 0.001). (B) Percentage of locules per fruit in wild-type and three independent ProPI:amiRNA-AtMIF2 lines (n = 50). **P < 0.01 (Tukey HSD). (C), (D), and (F) Siliques from wild-type (Col-0*Ler) (left in [C] and [D]) and ProPI:amiRNA-AtMIF2 plants (right in [C] and [F]). (E) and (G) Cross sections of Col*Ler and ProPI:amiRNA-AtMIF2. (H) and (I) Young tomato fruits from wild-type (H) and Pro35S:SlIMA-RNAi plants (I). Bars = 1 mm in (C) and 2 mm in (D) to (I).
Figure 3.
Figure 3.
SlKNU Expression Pattern and Phenotypes of Pro35S:SlKNU and Pro35S:SlKNU-RNAi Tomato Plants. (A) Expression analysis of SlKNU in developing tomato flower buds analyzed by in situ hybridization. se, sepal; pe, petal; st, stamen; ca, carpel; ov, ovule. Bars = 100 µm (S2 and S4) and 250 μm (S6 and S9). (B) Expression analysis of SlKNU using qRT-PCR in different tissues and during floral and fruit development. daa, days after anthesis. Error bars represent sd of three biological replicates. (C) Vegetative phenotypes of wild-type and two Pro35S:SlKNU lines. Bars = 5 cm. (D) Flowers of wild-type, Pro35S:SlKNU, and Pro35S:SlKNU-RNAi lines. Bars = 5 mm. (E) Fruits of wild-type, Pro35S:SlKNU, and Pro35S:SlKNU-RNAi lines. Bars = 5 mm. (F) Number of locules per fruit in wild-type and Pro35S:SlKNU-RNAi lines. Data are presented as percentage of fruits per locule number category (n = 25 fruits). *P < 0.05 and **P < 0.01 (Tukey HSD).
Figure 4.
Figure 4.
AtMIF2/SlIMA Expression Is Activated by AG/TAG1. (A) In vitro binding of AG to the AtMIF2 promoter sequences analyzed by EMSA. The black arrow points to the mobility shift corresponding to AG binding to the probe; the white arrow indicates an unspecific binding of bacterial proteins to the probe. Control probe is a conserved CArG sequence as described by Riechmann et al. (1996). pAtMIF2-E and pAtMIF2-B: sequences from the AtMIF2 promoter (Supplemental Figure 3). (B) Expression analysis of AtMIF2 in wild-type Ler and ag-3 floral buds at various stages of floral development using qRT-PCR. (C) In situ hybridization against AtMIF2 mRNA in floral bud of ag-3 plant. Bars = 100 µm. (D) Expression analysis of SlIMA in wild-type and Pro35S:TAG1 tomato floral buds at various stages of development using qRT-PCR. (E) GUS staining in fruits of ProSlIMA:GUS and ProSlIMA:GUS Pro35S:TAG1 double-transgenic lines. Bars = 5 mm. (F) CRISPR/Cas9-induced deletions in the CArG motif (CArG-box) of the SlIMA promoter in three independent T0 plants. The three CR-ProSlIMA plants were homozygous for the deletion. Red font highlights sgRNA targets, and bold indicates protospacer-adjacent motif (PAM) sequences. (G) Cross sections of fruit from wild-type, CR#1-ProSlIMA, CR#2-ProSlIMA, and CR#3-ProSlIMA lines. (H) Number of locules per fruit produced by wild-type and CR#ProSlIMA lines. Data are presented as percentage of fruits per locule number category (n = 12 fruits). **P < 0.01 (Tukey HSD). (I) Expression analysis of SlIMA in wild-type and CR#-ProSlIMA floral buds using qRT-PCR. (B), (D), (H), and (I) Error bars represent sd of three biological replicates and asterisks indicate significant differences from the control (WT) using two-tailed t test (*P < 0.05, **P < 0.01, and ***P < 0.001).
Figure 5.
Figure 5.
AtMIF2 and SlIMA Repress WUS and SlWUS Expression during FM Termination in Arabidopsis and Tomato, Respectively. (A) and (B) Expression analysis of WUS in wild-type (Col*Ler) and AtMIF2 loss-of-function (ProPI:amiRNA-AtMIF2 and ProPI:amiRNA-AtMIF2 pWUS:GUS) plants in floral bud at various developmental stages using ProWUS:GUS staining and qRT-PCR. Bars = 100 µm. (C) and (D) Expression analysis of SlWUS in the wild type, SlIMA silencing line (Pro35S:SlIMA-RNAi), and CR#-ProSlIMA flower buds at stage 1-6 using RT-PCR (C) and qRT-PCR (D). (B) to (D) Error bars represent sd of three biological replicates and asterisks indicate significant differences from the control (WT) using two-tailed t test (*P < 0.05, **P < 0.01, and ***P < 0.001).
Figure 6.
Figure 6.
SlKNU Expression Is Promoted by TAG1 to Repress SlWUS in Tomato Floral Bud. (A) Expression analysis of SlWUS in Pro35S:SlKNU-RNAi and Pro35S:SlKNU plants, compared with wild-type plants, using qRT-PCR. (B) Expression analysis of SlKNU in three Pro35S:TAG1 overexpressing lines, compared with wild-type plants, using qRT-PCR. Error bars represent sd of three biological replicates and asterisks indicate significant differences from the control (WT) using two-tailed t test (*P < 0.05 and **P < 0.01).
Figure 7.
Figure 7.
Interaction Analyses between AtMIF2 and AtKNU and between SlIMA and SlKNU. (A) BiFC analysis testing the interaction between AtMIF2 and AtKNU (upper panel) and SlIMA and SlKNU (lower panel) in onion epidermal cells. Bars = 25 µm. (B) BiFC analysis testing the interaction between AtMIF2 and SlKNU (upper panel) and SlIMA and AtKNU (lower panel) in onion epidermal cells. Bars = 50 µm. (C) In vitro pull-down of GST-AtMIF2 with 6xHis-AtKNU as a bait bound to Ni-NTA resin. GST-AtMIF2 was detected using anti-GST antibody. The black arrow indicates GST-AtMIF2. (D) Yeast two-hybrid interactions were tested by transforming fusions of either AtMIF2 or SlIMA with the Gal4 activation domain (AD) and fusions of AtKNU or SlKNU to the Gal4 binding domain (BD). Serial dilutions of yeast cells from 105 to 10 on nonselective SD medium lacking leucine and tryptophan (-L/-W) show normal yeast growth. Only positive interactors are able to grow on restrictive growth medium supplemented with 25 mM 3-AT and lacking leucine, tryptophan, and histidine (-L/-W/-H). (E) BiFC analysis testing the interaction between AtMIF2 and AtKNU-EARdel (upper panel) and SlIMA and SlKNU-EARdel (lower panel) in onion epidermal cells. Bars = 50 µm.
Figure 8.
Figure 8.
AtMIF2/SlIMA Bridges the KNU/SlKNU and TPL/SlTPL1 Interaction and Directly Interacts with HDA19/SlHDA1. (A) BiFC analysis of the interactions between Arabidopsis KNU and TPL (upper panels) and tomato SlKNU and SlTPL1 (lower panels) in the presence of AtMIF2 and SlIMA, respectively, in onion epidermal cells. Bars = 25 µm. (B) Yeast three-hybrid assay demonstrating the formation of AtMIF2-KNU-TPL and SlIMA-SlKNU-SlTPL1 trimeric complexes. Serial dilutions of yeast cells from 105 to 10 on nonselective SD medium lacking leucine, tryptophan, and uracil (-L/-W/-U) show normal growth. Only positive interactions were able to grow on restrictive growth medium supplemented with 75 mM 3-AT and lacking leucine, tryptophan, and histidine (-L/-W/-H). (C) BiFC analysis of the interactions between TPL and HDA19 (left panel) and SlTPL1 and SlHDA1 (right panel) in onion epidermal cells. Bars = 50 µm. (D) BiFC analysis of the interactions between AtMIF2 and HDA19 (left panel) and SlIMA and SlHDA1 (right panel) in onion epidermal cells. Bars = 50 µm.
Figure 9.
Figure 9.
AtMIF2/SlIMA Bind WUS/SlWUS Locus to Repress Their Expression via Histone Deacetylation. (A) Schematic representation of the WUS and SlWUS loci (5′ and 3′UTR are in gray, introns in white, and exons in black) with the different targeted regions (P1 to P8). (B) ChIP assay at the WUS locus using HA- or IgG-antibodies in Col-0, knu, Pro35S:AtMIF2-3HA in Col-0, and Pro35S:AtMIF2-3HA in knu plants. The y axis shows enrichment relative to input using IgG as a control. Error bars represent sd of three biological replicates, and asterisks indicate significant differences from the control (Col-0) using two-tailed t test (*P < 0.05 and **P < 0.01). (C) ChIP assay at the SlWUS locus using GFP or IgG antibodies in wild-type and Pro35S:IMA-YFP plants. The y axis shows relative enrichment to input using IgG as a control. Error bars represent sd of three biological replicates, and asterisks indicate significant differences from the control (Col-0) using two-tailed t test (*P < 0.05 and **P < 0.01). (D) DamID ratios at different regions of the WUS locus prior (NI) and after 24 h of ethanol induction (I) in lines expressing Arabidopsis MIF2 or KNU fused to DAM (Dam-AtMIF2 and Dam-KNU, respectively). (E) Expression analysis of WUS in Col-0, Pro35S:AtMIF2, and hda19 floral buds (stages 1–12) treated or not with 0.5 µM TSA, using qRT-PCR. Error bars represent sd of three biological replicates and asterisks indicate significant differences from the control (Col-0) using two-tailed t test (*P < 0.05 and **P < 0.01). (F) Expression analysis of WUS using GUS staining of ProWUS:GUS Pro35S:AtMIF2 double transgenic plants treated (upper panel) or not (lower panel) with 0.5 µM of TSA. Bars = 10µm.
Figure 10.
Figure 10.
Model Illustrating the Conserved Role of MIF2 in the Regulation of FM Termination. (A) The expression of MIF2 and KNU is activated by AG directly (green arrows) or indirectly (dashed arrow) in floral buds at stage 3. (B) MIF2 and KNU associate with HDA19 and TPL to form a chromatin remodeling complex that binds to the first intron of the WUS locus, enabling the complete repression of WUS (red arrows) and leading consequently to the termination of stem cell activity at stage 6. se, sepal; pe, petal; st, stamen; ca, carpel.

Comment in

References

    1. Belhaj K., Chaparro-Garcia A., Kamoun S., Nekrasov V. (2013). Plant genome editing made easy: targeted mutagenesis in model and crop plants using the CRISPR/Cas system. Plant Methods 9: 39. - PMC - PubMed
    1. Bereterbide A., Hernould M., Farbos I., Glimelius K., Mouras A. (2002). Restoration of stamen development and production of functional pollen in an alloplasmic CMS tobacco line by ectopic expression of the Arabidopsis thaliana SUPERMAN gene. Plant J. 29: 607–615. - PubMed
    1. Bisbis B., Delmas F., Joubès J., Sicard A., Hernould M., Inzé D., Mouras A., Chevalier C. (2006). Cyclin-dependent kinase (CDK) inhibitors regulate the CDK-cyclin complex activities in endoreduplicating cells of developing tomato fruit. J. Biol. Chem. 281: 7374–7383. - PubMed
    1. Cartharius K., Frech K., Grote K., Klocke B., Haltmeier M., Klingenhoff A., Frisch M., Bayerlein M., Werner T. (2005). MatInspector and beyond: promoter analysis based on transcription factor binding sites. Bioinformatics 21: 2933–2942. - PubMed
    1. Causier B., Ashworth M., Guo W., Davies B. (2012). The TOPLESS interactome: a framework for gene repression in Arabidopsis. Plant Physiol. 158: 423–438. - PMC - PubMed

Publication types

MeSH terms