. 2018 Feb 26;92(6):e02110-17.
doi: 10.1128/JVI.02110-17. Print 2018 Mar 15.

Class 1-Selective Histone Deacetylase (HDAC) Inhibitors Enhance HIV Latency Reversal while Preserving the Activity of HDAC Isoforms Necessary for Maximal HIV Gene Expression

Affiliations

Class 1-Selective Histone Deacetylase (HDAC) Inhibitors Enhance HIV Latency Reversal while Preserving the Activity of HDAC Isoforms Necessary for Maximal HIV Gene Expression

Thomas D Zaikos et al. J Virol. .

Abstract

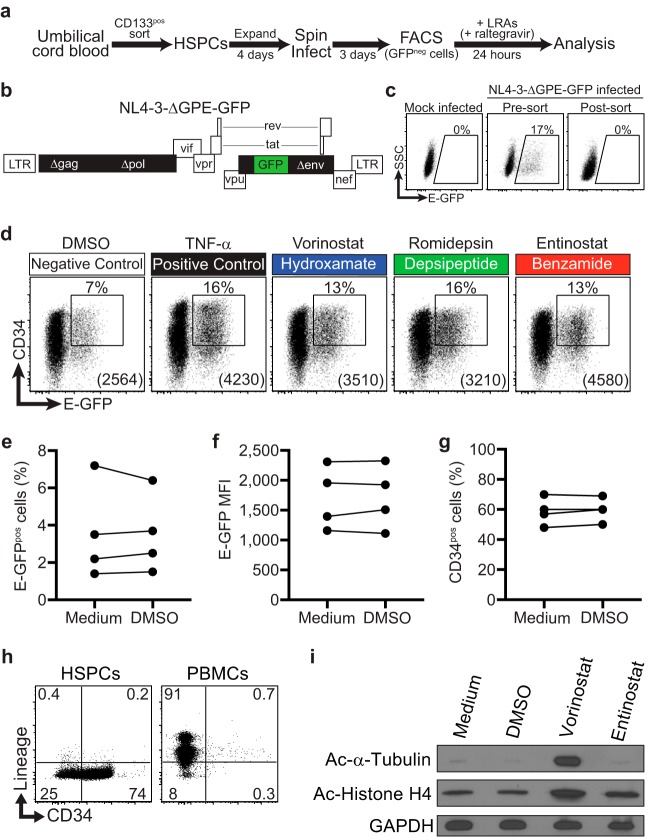
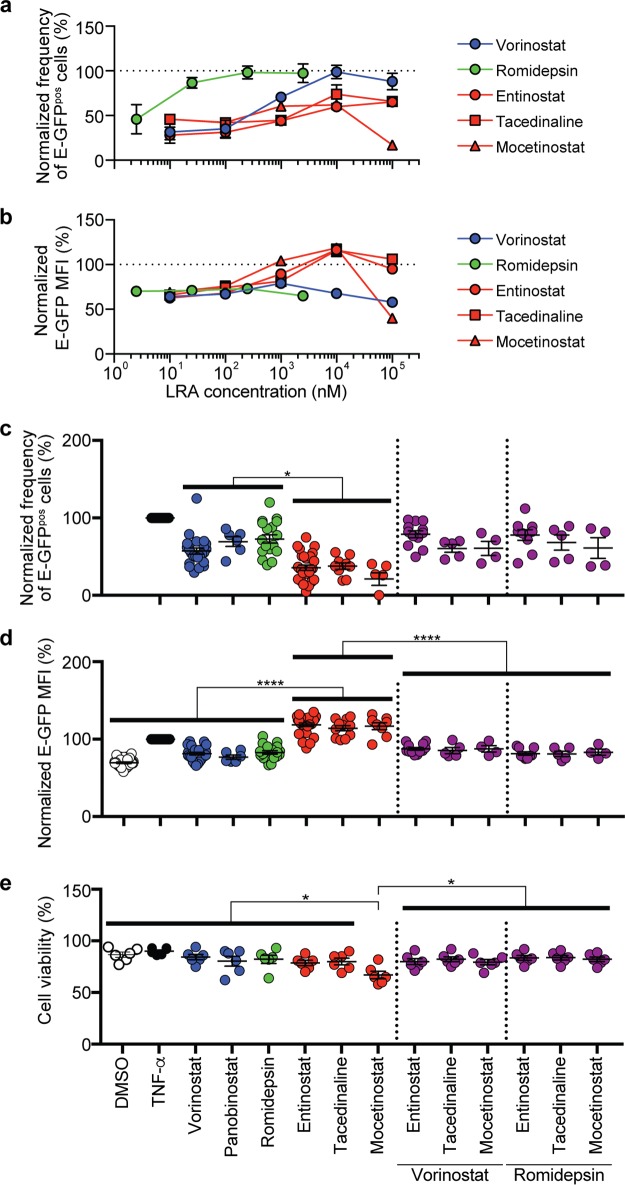
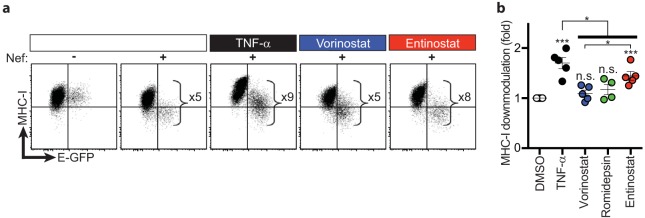
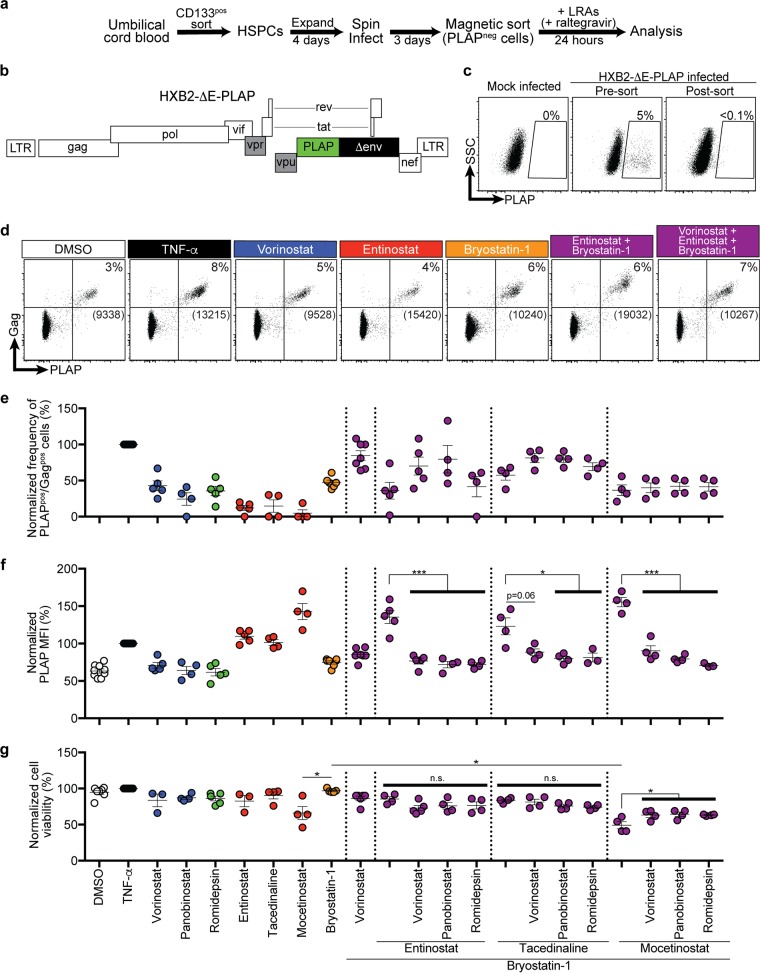
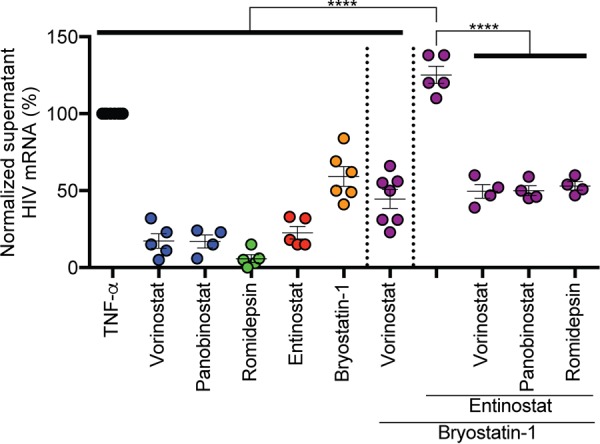
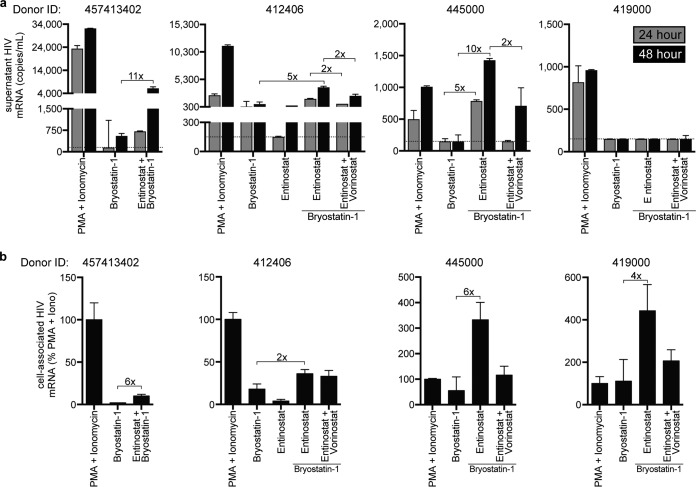
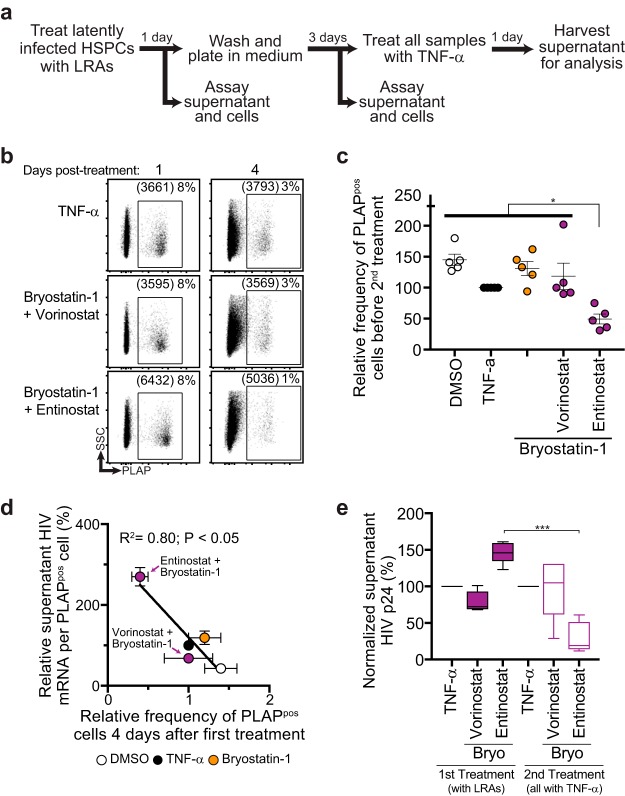
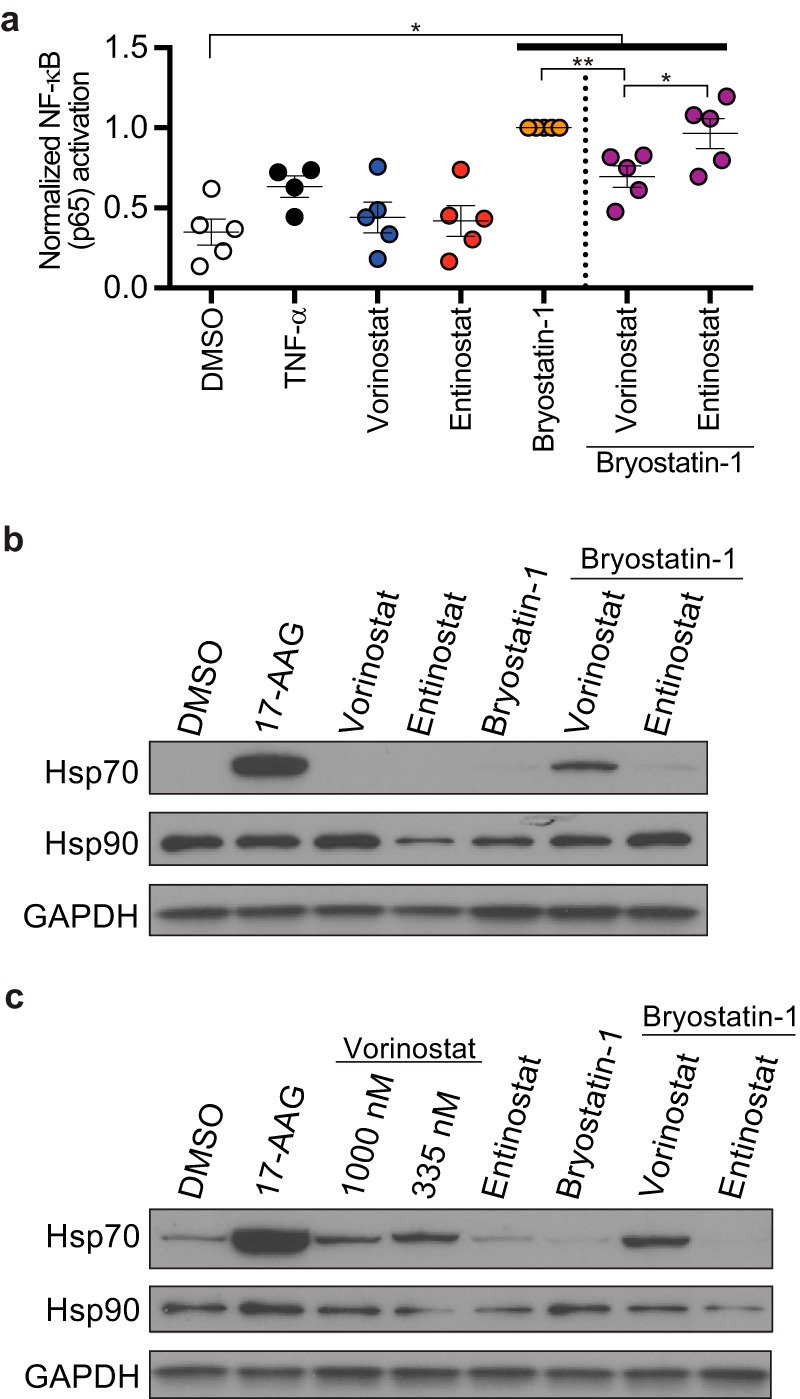
Combinations of drugs that affect distinct mechanisms of HIV latency aim to induce robust latency reversal leading to cytopathicity and elimination of the persistent HIV reservoir. Thus far, attempts have focused on combinations of protein kinase C (PKC) agonists and pan-histone deacetylase inhibitors (HDIs) despite the knowledge that HIV gene expression is regulated by class 1 histone deacetylases. We hypothesized that class 1-selective HDIs would promote more robust HIV latency reversal in combination with a PKC agonist than pan-HDIs because they preserve the activity of proviral factors regulated by non-class 1 histone deacetylases. Here, we show that class 1-selective agents used alone or with the PKC agonist bryostatin-1 induced more HIV protein expression per infected cell. In addition, the combination of entinostat and bryostatin-1 induced viral outgrowth, whereas bryostatin-1 combinations with pan-HDIs did not. When class 1-selective HDIs were used in combination with pan-HDIs, the amount of viral protein expression and virus outgrowth resembled that of pan-HDIs alone, suggesting that pan-HDIs inhibit robust gene expression induced by class 1-selective HDIs. Consistent with this, pan-HDI-containing combinations reduced the activity of NF-κB and Hsp90, two cellular factors necessary for potent HIV protein expression, but did not significantly reduce overall cell viability. An assessment of viral clearance from in vitro cultures indicated that maximal protein expression induced by class 1-selective HDI treatment was crucial for reservoir clearance. These findings elucidate the limitations of current approaches and provide a path toward more effective strategies to eliminate the HIV reservoir.IMPORTANCE Despite effective antiretroviral therapy, HIV evades eradication in a latent form that is not affected by currently available drug regimens. Pharmacologic latency reversal that leads to death of cellular reservoirs has been proposed as a strategy for reservoir elimination. Because histone deacetylases (HDACs) promote HIV latency, HDAC inhibitors have been a focus of HIV cure research. However, many of these inhibitors broadly affect multiple classes of HDACs, including those that promote HIV gene expression (class 1 HDACs). Here, we demonstrate that targeted treatment with class 1-selective HDAC inhibitors induced more potent HIV latency reversal than broadly acting agents. Additionally, we provide evidence that broadly acting HDIs are limited by inhibitory effects on non-class 1 HDACs that support the activity of proviral factors. Thus, our work demonstrates that the use of targeted approaches to induce maximum latency reversal affords the greatest likelihood of reservoir elimination.

Keywords: HIV; Hsp90; histone deacetylase inhibitors; latency reversal; shock and kill.


Figures

FIG 1
FIG 1
Model system of HIV latency in HSPCs. (a) Schematic illustration of HIV activation assay in HSPCs. (b) Schematic diagram of NL4-3-based HIV molecular clone used for activation studies. Filled black and green rectangles indicate genes that have been deleted from or added to the wild-type molecular clone, respectively. (c) Flow cytometric analysis of mock-infected and sorted, infected HSPCs used for activation studies. Numbers above gates indicate the frequency of live E-GFPpos cells. Live cells were gated based on FSC and SSC parameters. (d) Representative flow cytometric analysis of infected HSPCs treated for 24 h with the indicated LRAs. Live cells were gated based on forward scatter (FSC), side scatter (SSC), and 7-AAD. Numbers above gates indicate the frequency of CD34pos, E-GFPpos cells. Numbers in parentheses indicate the E-GFP MFI of cells within the gate. Gates are based on mock-infected cells and staining with an isotype control antibody. (e to g) Summary graphs showing the frequency of E-GFPpos cells (e), E-GFP MFI (f), and the frequency of CD34pos HSPCs (g) following 24 h treatment with medium and 0.1% (vol/vol) DMSO. (h) Flow-cytometric analysis of HSPCs and PBMCs for cell surface CD34 and lineage markers (markers of cells committed to the T, B, NK, myeloid, and erythroid lineages [anti-CD2, CD3, CD14, CD16, CD19, CD56 and CD235a]). (i) Immunoblot analysis of whole-cell lysates from HSPCs treated for 9 h under the indicated conditions, demonstrating HDI selectivity.
FIG 2
FIG 2
HDI combinations reveal an inhibitory effect of pan-HDIs that limits HIV protein production in HSPCs. Summary graphs of frequency of E-GFPpos, CD34pos HSPCs (a) and E-GFP MFI (b) in CD34pos cells bearing activated HIV following 24-h treatment over the range of HDI concentrations indicated (means ± standard errors of the means [SEM], n = 3). (c) Summary graph of the frequency of E-GFPpos, CD34pos cells following treatment with the indicated LRAs at the concentrations described in Materials and Methods and used in all subsequent assays. The frequency of spontaneous reactivation observed under DMSO solvent conditions was subtracted from each experiment to reflect the actual frequency of reactivated provirus. Each symbol represents data from an independent experiment (mean ± SEM, n ≥ 4). (d) Summary graph of E-GFP MFI in E-GFPpos, CD34pos cells (mean ± SEM, n ≥ 4). (e) Summary graph of frequency of viable HSPCs following 24-h treatment with HDIs alone and in combinations at the concentrations used for HIV latency reversal studies. Cell viability was calculated using the percentage of cells within the live-cell gating strategy based on FSC, SSC, and 7-AAD. Data are presented as percentages of the effect of TNF-α. P values were calculated by two-tailed, unpaired Student's t test. *, P < 0.05; ****, P < 0.0001. Solid bars indicate statistically significant differences between groups subjected to different conditions.
FIG 3
FIG 3
Entinostat induces more Nef-dependent downmodulation of MHC-I than pan-HDIs. (a) Representative flow cytometric analysis of MHC-I downmodulation on latently infected HSPCs treated with the indicated LRAs. The magnitude of MHC-I downmodulation in HSPCs with induced viral gene expression was calculated by dividing the MHC-I median fluorescence intensity (MedFI) of the E-GFPneg population by that of the E-GFPpos population for each sample (E-GFPnegMHC-I MedFI/E-GFPposMHC-I MedFI). (b) Summary graph of fold MHC-I downmodulation. Data are presented relative to DMSO (means ± SEM, n ≥ 4). P values were calculated by two-tailed, unpaired Student's t test. *, P < 0.05; ***, P < 0.001. Asterisks above each condition indicate statistically significant differences compared to DMSO. Solid bar indicates statistically significant differences between groups subjected to different conditions.
FIG 4
FIG 4
Class 1-selective HDIs plus bryostatin-1 maximally induce latency reversal and viral protein production, whereas pan-HDIs are inhibitory when added to these combinations. (a) Schematic illustration of modified HIV latency model system in HSPCs. (b) Schematic diagram of the HXB2-based HIV molecular clone. Filled black and green rectangles indicate genes that have been deleted from or added to the wild-type molecular clone, respectively. Filled gray rectangles indicate genes that are dysfunctional in the wild-type HXB2 molecular clone. (c) Flow-cytometric analysis of mock-infected and sorted, infected HSPCs. Numbers above gates indicate the frequency of live PLAPpos cells. Live cells were gated based on FSC and SSC parameters. (d) Representative flow-cytometric analysis of infected HSPCs treated for 24 h with the indicated LRAs. Live cells were gated based on FSC and SSC. Numbers above gates indicate the frequencies of PLAPpos, Gagpos cells. Numbers in brackets indicate PLAP MFI of cells within the double-positive gate. Gates are based on mock-infected cells and staining with an isotype control antibody. Summary graphs of frequency of PLAPpos, Gagpos cells (e) and PLAP MFI of PLAPpos, Gagpos cells (f) and relative cell viability following treatment with the indicated LRAs (g). The frequency of spontaneous reactivation observed under DMSO solvent conditions was subtracted from each experiment to reflect the actual frequency of reactivated provirus. Data are presented as a percentage of the effect of TNF-α (mean ± SEM, n ≥ 3). P values were calculated by two-tailed, unpaired Student's t test. *, P < 0.05; ***, P < 0.001.
FIG 5
FIG 5
Entinostat plus bryostatin-1 induces maximum viral outgrowth from latently infected cells, whereas pan-HDIs are inhibitory when added in combination. Summary graph of genomic HIV mRNA copies/ml measured in supernatants from cultures of latently infected HSPCs treated as described for Fig. 4. Viral outgrowth observed with spontaneous reactivation under DMSO solvent conditions was subtracted from each experiment. Data are presented as a percentage of the effect of TNF-α (means ± SEM, n ≥ 4). P values were calculated by two-tailed, unpaired Student's t test. ****, P < 0.0001.
FIG 6
FIG 6
Entinostat plus bryostatin-1 induces maximum viral outgrowth and gene expression in latently infected rCD4pos T cells from HIV-infected individuals. (a) Graphical analysis of HIV released by patient rCD4pos T cells following treatment with indicated LRAs (means ± SD for experimental duplicates). The limit of quantification is indicated by a dotted gray horizontal line. (b) Induced cell-associated HIV mRNA in rCD4pos T cells treated for 48 h with indicated LRAs (means ± SD for experimental duplicates).
FIG 7
FIG 7
Potency of latency reversal is correlated with survival of affected cells bearing reactivated HIV. (a) Schematic of in vitro assay to test the survival of latently infected HSPCs following treatment with LRAs. (b) Representative flow-cytometric analysis of HSPCs 1 and 4 days after treatment with LRAs. (c) Summary graph showing the relative frequency of residual PLAPpos cells in culture 4 days post-LRA treatment. (d) Summary graph showing inverse correlation between frequency of residual infected cells on 4 days after LRA treatment and potency of induced viral outgrowth by the indicated LRAs. Data were fit to a least-squares nonlinear regression. (e) Box and whisker plot (5th to 95th percentiles) of virus released into culture supernatant by HSPCs treated with TNF-α 4 days after initial LRA treatment. To facilitate comparisons across multiple experiments, data were normalized to TNF-α (n = 5). P values were calculated by two-tailed, unpaired Student's t test. *, P < 0.05; ***, P < 0.001.
FIG 8
FIG 8
Vorinostat inhibits cellular factors important for robust HIV gene expression. (a) Summary graph showing abundance of activated NF-κB/p65 in PBMCs treated for 24 h with indicated LRAs. Data were normalized to the effect of bryostatin-1 (means ± SEM, n ≥ 4). Immunoblot analysis of whole-cell lysates from HSPCs (b) and PBMCs (c) treated for 24 h with indicated LRAs. P values were calculated by two-tailed, unpaired Student's t test. *, P < 0.05; **, P < 0.01.

References

    1. Finzi D, Hermankova M, Pierson T, Carruth LM, Buck C, Chaisson RE, Quinn TC, Chadwick K, Margolick J, Brookmeyer R, Gallant J, Markowitz M, Ho DD, Richman DD, Siliciano RF. 1997. Identification of a reservoir for HIV-1 in patients on highly active antiretroviral therapy. Science 278:1295–1300. doi:10.1126/science.278.5341.1295. - DOI - PubMed
    1. Chun TW, Carruth L, Finzi D, Shen X, DiGiuseppe JA, Taylor H, Hermankova M, Chadwick K, Margolick J, Quinn TC, Kuo YH, Brookmeyer R, Zeiger MA, Barditch-Crovo P, Siliciano RF. 1997. Quantification of latent tissue reservoirs and total body viral load in HIV-1 infection. Nature 387:183–188. doi:10.1038/387183a0. - DOI - PubMed
    1. Deeks SG. 2012. HIV: shock and kill. Nature 487:439–440. doi:10.1038/487439a. - DOI - PubMed
    1. Archin NM, Espeseth A, Parker D, Cheema M, Hazuda D, Margolis DM. 2009. Expression of latent HIV induced by the potent HDAC inhibitor suberoylanilide hydroxamic acid. AIDS Res Hum Retroviruses 25:207–212. doi:10.1089/aid.2008.0191. - DOI - PMC - PubMed
    1. Rasmussen TA, Søgaard OS, Brinkmann C, Wightman F, Lewin SR, Melchjorsen J, Dinarello C, Østergaard L, Tolstrup M. 2013. Comparison of HDAC inhibitors in clinical development. Hum Vaccin Immunother 9:993–1001. doi:10.4161/hv.23800. - DOI - PMC - PubMed

Publication types

MeSH terms

LinkOut - more resources