. 2018 Jan 16;115(3):513-518.
doi: 10.1073/pnas.1714401115. Epub 2018 Jan 3.

Slow domain reconfiguration causes power-law kinetics in a two-state enzyme

Affiliations

Slow domain reconfiguration causes power-law kinetics in a two-state enzyme

Iris Grossman-Haham et al. Proc Natl Acad Sci U S A. .

Abstract

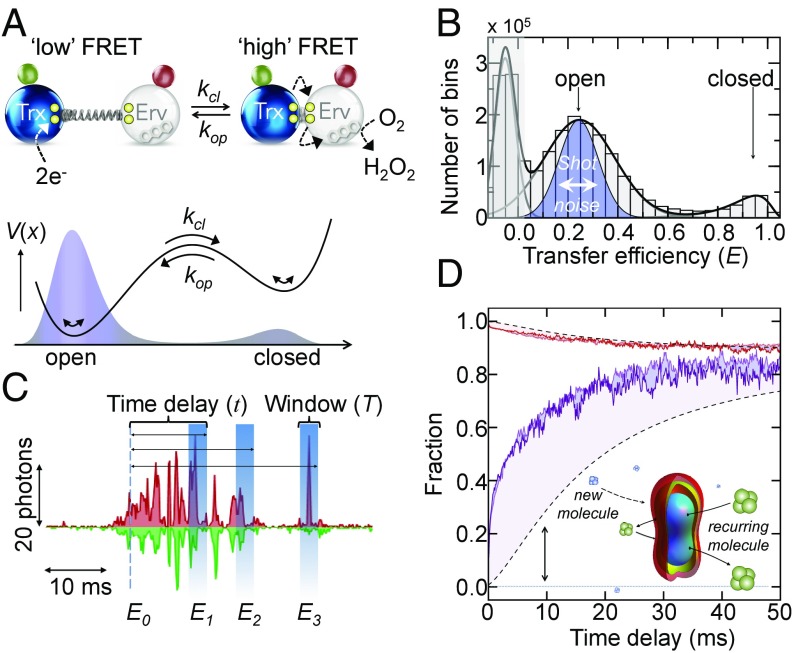
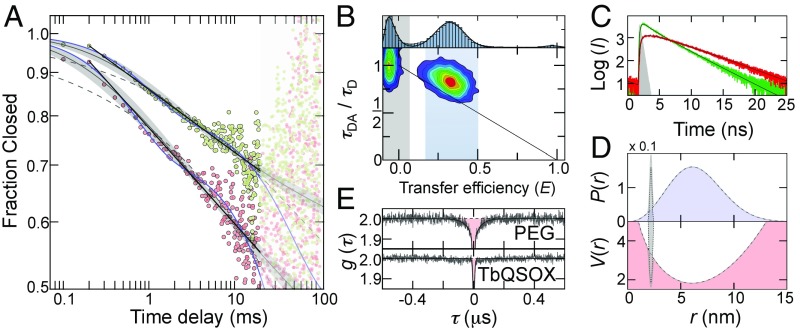
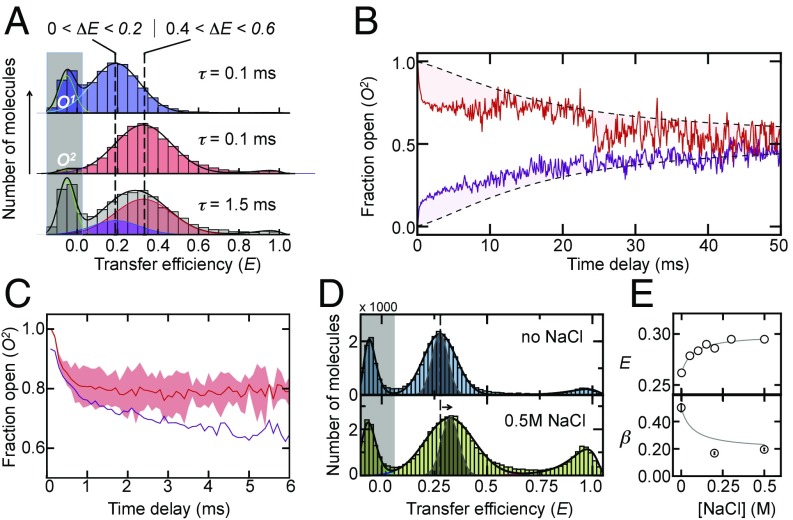
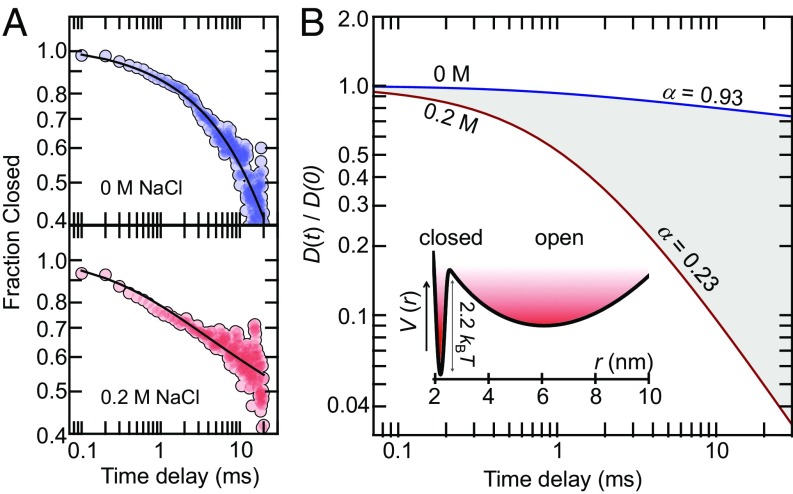
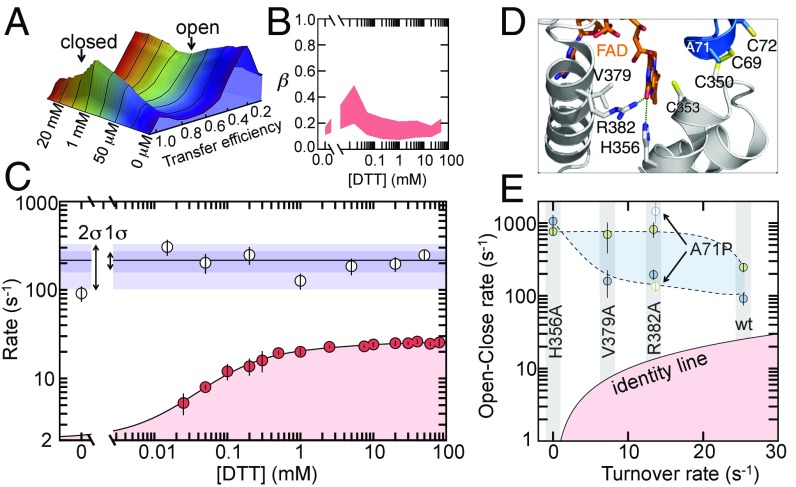
Protein dynamics are typically captured well by rate equations that predict exponential decays for two-state reactions. Here, we describe a remarkable exception. The electron-transfer enzyme quiescin sulfhydryl oxidase (QSOX), a natural fusion of two functionally distinct domains, switches between open- and closed-domain arrangements with apparent power-law kinetics. Using single-molecule FRET experiments on time scales from nanoseconds to milliseconds, we show that the unusual open-close kinetics results from slow sampling of an ensemble of disordered domain orientations. While substrate accelerates the kinetics, thus suggesting a substrate-induced switch to an alternative free energy landscape of the enzyme, the power-law behavior is also preserved upon electron load. Our results show that the slow sampling of open conformers is caused by a variety of interdomain interactions that imply a rugged free energy landscape, thus providing a generic mechanism for dynamic disorder in multidomain enzymes.

Keywords: enzyme dynamics; memory effects; protein disorder; single-molecule FRET; subdiffusion.


Conflict of interest statement

The authors declare no conflict of interest.

Figures

Fig. 1.
Fig. 1.
Two-state opening and closing measured with smFRET. (A) Trx domain (blue) and Erv domain (white) in the open and closed state are schematically depicted with the flexible linker (spring), CXXC motifs (yellow), the FAD cofactor (Erv domain), and the donor (green) and acceptor (red) fluorophores. A double-well free energy profile (black line) results in a bimodal distribution of open and closed states (shaded in blue). (B) Transfer efficiency histogram of doubly labeled TbQSOX in the absence of substrate (bin time: 100 μs). The peak close to E = 0 results from molecules without an active acceptor dye (gray shading). The blue-shaded region indicates the expected distribution of the open state based on photon noise. The black line is a fit with a superposition of two log-normal and a Gaussian function. (C) Time trace donor (green) and acceptor (red) signals. Transfer efficiencies (E1, E2, E3) of bins that follow an originally selected bin with E0 within a window T after a delay τ will be different due to conformational switching and the arrival of new molecules. (D) Time course of the fraction of open molecules after initial selection of closed molecules (purple) and open molecules (red) for two different laser intensities, 50 μW (lighter color) and 100 μW (darker color). Black dashed lines indicate the expected kinetics in the absence of conformation switching based on psame(t). (Inset) Confocal volume.
Fig. 2.
Fig. 2.
Power-law kinetics and heterogeneity detected with smFRET. (A) Time decay of the closed population corrected for the arrival of new molecules with (red circles) and without (green circles) 1 mM DTT. Weighted fits with a power law (black lines), Eq. 2 (gray lines) with a 95% CI (gray shading), a stretched exponential fit with Eq. 3 (gray dashed lines), and a double exponential fit with the COO-model (blue lines) are shown for comparison. Data points >20 ms were excluded from the fit. (B) FRET histogram (Top) and 2D correlation map between donor fluorescence lifetime and transfer efficiency in the absence of substrate. The solid line shows the dependence for a single donor-acceptor distance. The blue region indicates molecules selected for the fluorescence lifetime analysis shown in C. (C) Subpopulation-specific fluorescence intensity (I) decays for donor (green) and acceptor (red) of open TbQSOX. Black lines are global fits based on the distance distribution in Eq. 4 (SI Appendix). The instrumental response function is shown in gray. (D) Distance distribution (Top) and free energy potential in units of kBT (Bottom) of open TbQSOX (black dashed line) resulting from the fits in C. An estimate of the closed distribution based on the X-ray structure of TbQSOX (34) is shown for comparison (dotted lines). (E) Normalized donor-acceptor cross-correlation functions for doubly labeled PEG 5000 (Top) and TbQSOX in the absence of substrate (Bottom). Black lines are fits with a product of exponential functions (SI Appendix).
Fig. 3.
Fig. 3.
Slow exchange within the open state detected with RASP. (A) Single-molecule recurrence histograms of the open populations, O1 (blue) and O2 (red), at different delay times (indicated). The Bottom shows the amount of O1 (blue) that is formed 1.5 ms after starting with 100% O2 (red). The transfer efficiency ranges for the selection of O1 (Left) and O2 (Right) are indicated. Solid lines are fits to a sum of Gaussian functions. (B) Time course of the fraction of O2 after initial selection of molecules from O1 (purple) and O2 (red). Black dashed lines indicate the kinetics in the absence of conformation switching due to the arrival of new molecules. (C) Time course of the fraction of O2 corrected for the arrival of new molecules (red) in comparison with the decay of the closed population (purple). The red-shaded area is the error resulting from averaging the kinetics in B. (D) Transfer efficiency histograms in the absence (Top) and presence (Bottom) of NaCl. The gray-shaded distribution indicates the expected distribution based on photon noise. (E) Mean transfer efficiencies (Top) and β-exponents (Bottom) as a function of the salt concentration. The solid line is an empirical fit. RASP, recurrence analysis of single particles.
Fig. 4.
Fig. 4.
Estimate of the relative diffusion coefficients for opening and closing at low and high salt concentrations. (A) Experimental decays (circles) at 0 M NaCl (Top) and 0.2 M NaCl (Bottom) are shown in comparison with fits (black lines) using the numerical solution of the fractional Brownian motion model (Eq. 5) with the empirical relationship D(t)=D(0)(1+bt)c. The fit results in b = 1.52 ms−1 and c = −0.08 at 0 M NaCl and b = 0.89 ms−1 and c = −1.03 at 0.2 M NaCl. (B) Time dependence of the relative diffusion coefficients at 0 M NaCl (blue) and 0.2 M NaCl (red), obtained from the fits shown in A. The apparent power-law exponents α (in the text) in the region from 1 ms to 20 ms are indicated in the figure. (Inset) Estimated free energy potential along the experimental distance coordinate (SI Appendix).
Fig. 5.
Fig. 5.
The effect of substrate and mutations on the conformational kinetics and activity of TbQSOX. (A) Transfer efficiency histograms measured under steady-state conditions at different concentrations of DTT. (B) β-Exponents obtained at varying DTT concentrations. The upper border results from weighted fits of the decays with Eq. 2 and the lower border comes from unbounded power law fits. (C) Rates (defined as the inverse half-life) for turnover (red circles) and open-closing reactions (white circles). Error bars are the SD for the turnover data (n = 3) and errors of the weighted fit for the open-close rates. Blue shaded areas indicate 1 and 2 SDs of all rates in the presence of DTT. The turnover rates were fitted with a previous model (37) (SI Appendix). (D) Structure of the active site of TbQSOX in the closed conformation (PDB ID: 3QD9). The Trx and Erv domains are indicated in gray and blue, respectively. The side chains of catalytically important residues are represented as sticks. (E) Comparison of open-close rates in the absence (blue circles) and presence (green circles) of 50 mM DTT with the turnover rate. Open symbols represent the variant A71P. The black solid line is the identity line.

References

    1. Hammes-Schiffer S, Benkovic SJ. Relating protein motion to catalysis. Annu Rev Biochem. 2006;75:519–541. - PubMed
    1. Boehr DD, Dyson HJ, Wright PE. An NMR perspective on enzyme dynamics. Chem Rev. 2006;106:3055–3079. - PubMed
    1. Wolf-Watz M, et al. Linkage between dynamics and catalysis in a thermophilic-mesophilic enzyme pair. Nat Struct Mol Biol. 2004;11:945–949. - PubMed
    1. Fraser JS, et al. Hidden alternative structures of proline isomerase essential for catalysis. Nature. 2009;462:669–673. - PMC - PubMed
    1. Eisenmesser EZ, et al. Intrinsic dynamics of an enzyme underlies catalysis. Nature. 2005;438:117–121. - PubMed

Publication types

MeSH terms

LinkOut - more resources