. 2018 Jan 3;9(1):42.
doi: 10.1038/s41467-017-02465-5.

A machine learning approach to integrate big data for precision medicine in acute myeloid leukemia

Affiliations

A machine learning approach to integrate big data for precision medicine in acute myeloid leukemia

Su-In Lee et al. Nat Commun. .

Abstract

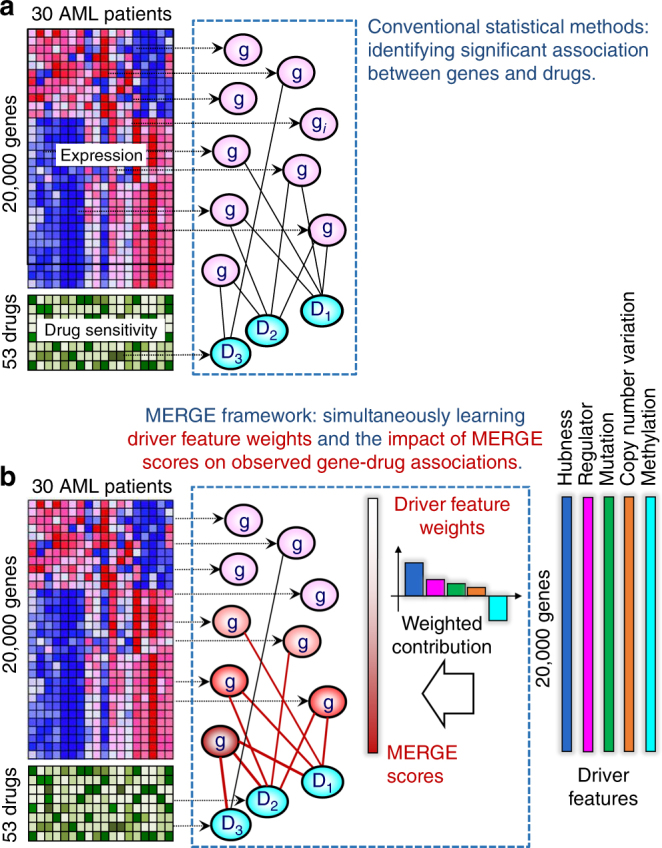
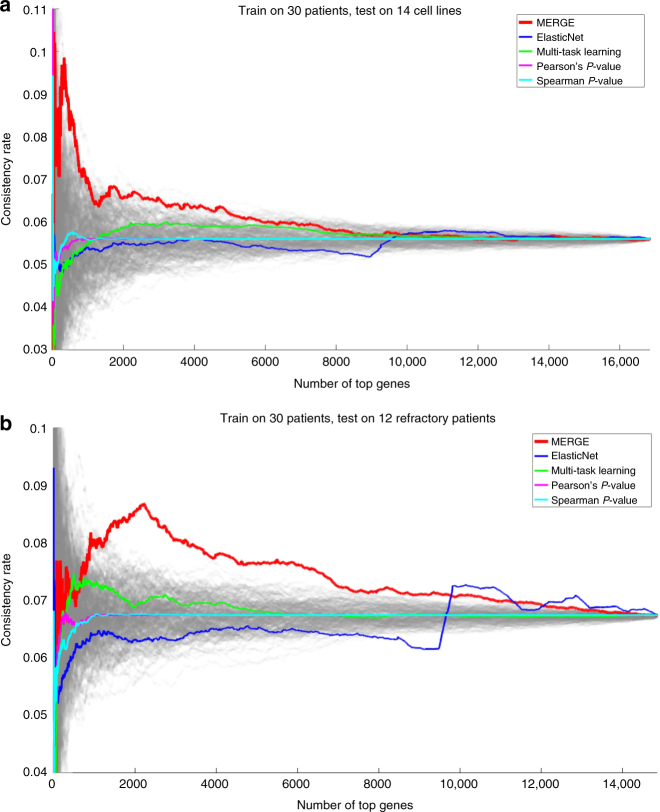
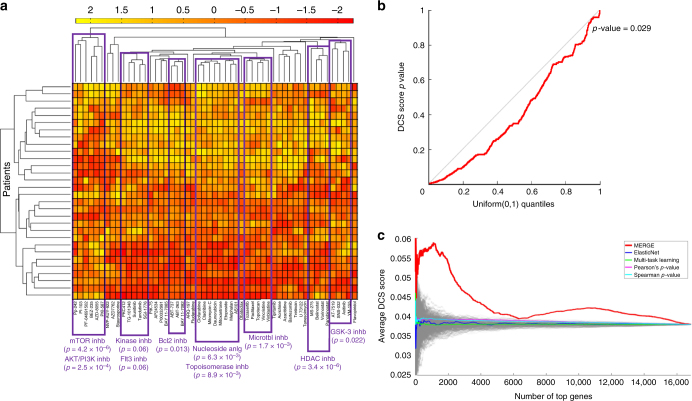
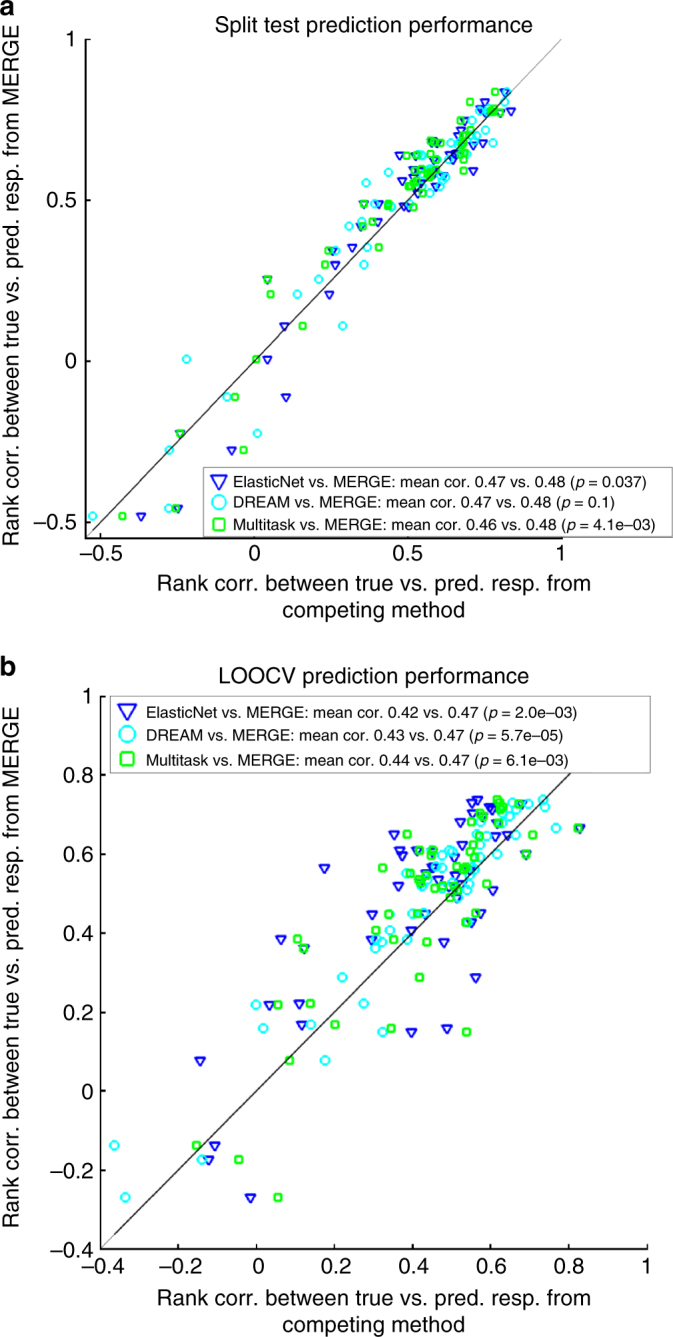
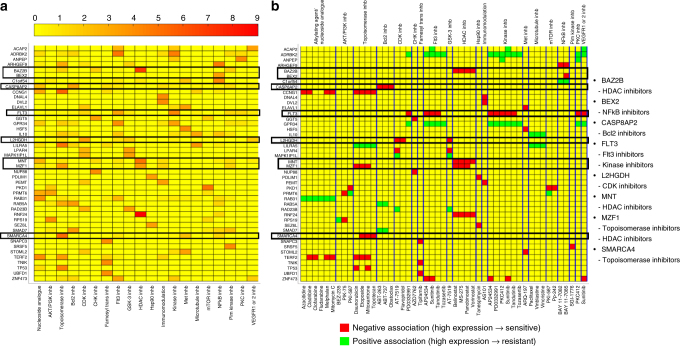
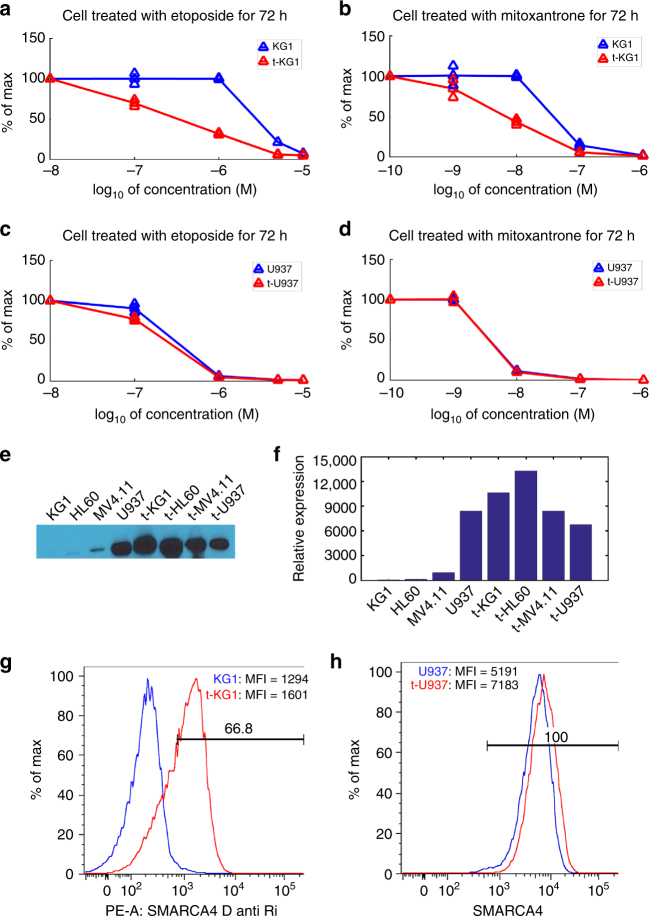
Cancers that appear pathologically similar often respond differently to the same drug regimens. Methods to better match patients to drugs are in high demand. We demonstrate a promising approach to identify robust molecular markers for targeted treatment of acute myeloid leukemia (AML) by introducing: data from 30 AML patients including genome-wide gene expression profiles and in vitro sensitivity to 160 chemotherapy drugs, a computational method to identify reliable gene expression markers for drug sensitivity by incorporating multi-omic prior information relevant to each gene's potential to drive cancer. We show that our method outperforms several state-of-the-art approaches in identifying molecular markers replicated in validation data and predicting drug sensitivity accurately. Finally, we identify SMARCA4 as a marker and driver of sensitivity to topoisomerase II inhibitors, mitoxantrone, and etoposide, in AML by showing that cell lines transduced to have high SMARCA4 expression reveal dramatically increased sensitivity to these agents.


Conflict of interest statement

The authors declare no competing financial interests.

Figures

Fig. 1
Fig. 1
Conventional statistical methods vs. MERGE. a Conventional methods identify gene expression markers for drugs based on expression data and drug sensitivity data. They measure the statistical significance of associations between expression levels for each gene and sensitivity measures for each drug. b The MERGE framework models the marker potential (MERGE score) of each gene based on a weighted combination of the gene’s driver features. MERGE simultaneously learns the driver feature weights (and correspondingly, MERGE scores for all genes) and the impact of the MERGE score on the observed gene-drug associations
Fig. 2
Fig. 2
Importance of each driver feature in predicting the drug response based on the MERGE algorithm. a Learned driver feature weight values. The methylation feature has a negative weight, consistent with our prior knowledge that when DNA is methylated in the promoter region, the corresponding genes are inactivated and silenced. b We sort genes based on the MERGE score (x-axis) and plot the sum of the contribution of all driver features to the MERGE score (i.e., weighted combination of driver features) (y-axis). We decomposed the weighted combination into the five driver features and indicated the magnitude of the contribution of each feature (driver feature weight × driver feature value) with different colors. Expression hubness contributes the most to the score, followed by regulatory function and (lack of) methylation
Fig. 3
Fig. 3
Comparison of MERGE with four alternative methods in terms of the percentage of the significant associations replicated in the left-out test data. We discovered gene-drug associations within the data from all 30 samples, and we tested on a the 14 cell line samples, and b the data from the additional 12 refractory patient samples. Each gray line corresponds to a random ordering of all genes. We note that the x-axis in b contains a lower total number of genes; some of the genes existing in the microarray gene expression data from the 30 patient and cell line samples did not exist in the RNA-seq data from the 12 refractory patient samples
Fig. 4
Fig. 4
Drug class specificity (DCS) of the associations prioritized based on the MERGE algorithm. a The result of the agglomerative hierarchical clustering that is applied to the AUC values of all drugs across 30 patient samples. AUC values are standardized before applying the hierarchical clustering, and the color bar at the top represents the standardized AUC values. For several branches in the resulting dendrogram, we report the drug classes that have significant enrichment with the drugs in that branch; we also report the corresponding Fisher’s exact test p-values. The result shows that drugs in at least 10 of 15 classes (that contain >1 drug) are expectedly grouped together in the dendrogram; for each group, Fisher’s exact test p-value associated with the overlap between the drug class and the dendrogram group is ≤0.06. b A QQ (quantile–quantile) plot of the observed DCS score p-values from 1000 random permutation tests for all genes with at least one significant gene-drug association. In each permutation test, drug labels were shuffled. Dots falling below the diagonal imply that the overlap with known drug classes is more significant than would be expected by random chance (permutation test p-value = 0.029). c For varying N (x-axis), we plotted the average DCS score over the N genes (y-axis) associated with the top (53 × N) gene-drug pairs based on the five methods in comparison
Fig. 5
Fig. 5
Comparison of prediction performance of MERGE to the prediction performances of three other methods: ElasticNet, Bayesian multi-task MKL and multi-task learning. a One batch of the samples is used for training, and a different batch is used for validation. b LOOCV setting. Performance is measured in terms of the Spearman correlation of the predicted response with the actual response. This evaluation metric was used in the NCI-DREAM Drug Sensitivity Prediction Challenge. Each dot corresponds to a different drug, and each color to a different method’s prediction on the x-axis compared to the MERGE prediction on the y-axis. The mean correlation from each of the methods in comparison and the associated p-values from a one-sided Wilcoxon signed-rank test are reported in the legend
Fig. 6
Fig. 6
The 44 genes in total each of which was identified, by the MERGE approach, as being one of the top three important marker genes for a drug mechanism class. a A heat map that shows the level of specificity of each of the 44 genes (row) to each drug class (column) measured by −log10 (Fisherʹs exact test p-value). For clarity, we considered only Fisher’s exact test p-value <0.05 to be significant; other values are indicated in yellow. The drug classes that are not assigned by MERGE any genes with associations specific to the class and consistent in the cell line data are not shown. We highlighted the genes whose biological significance, we discussed in the Results section with black-colored boxes. b A heat map that shows the gene-drug association for genes and drug classes shown in a. Yellow indicates that the corresponding gene-drug pair does not have a statistically significant association (genome-wide FDR corrected p-values <0.1), while green indicates a positive and red a negative association. The drugs are grouped by blue lines based on their classes, and the class names for each group are written on top of the heat map. Drugs that are members of more than one drug class (e.g., sunitinib) are shown multiple times for each class to which the drug belongs. The list on the right shows the genes whose biological significance we discussed in the Results section, and the drug classes they are specific to
Fig. 7
Fig. 7
SMARCA4 plasmid transfection experiments on cell lines KG1 and U937 for comparison of response to etoposide and mitoxantrone between original and transfected cells. a, b Comparison of the 72-h dose-response curves between KG1 cells (blue) and transfected KG1 cells (red) when cells are treated with (a) etoposide, and (b) mitoxantrone. c, d Comparison of the dose-response curves between U937 cells (blue) and transfected U937 cells (red) when cells are treated with (c) etoposide and (d) mitoxantrone. Three triangular marks at each point on the line indicate individual data points in duplicates and the average among them. The line connects averages of duplicates in each concentration measured. e Representative cropped western blot of control and transfected AML cell lines: KG1, U937, HL60, and MV4.11. Uncropped version is shown in Supplementary Fig. 6. f Quantifications of the SMARCA4 protein expression pattern of each of AML cell lines in (e). g Flow cytometry of SMARCA4 surface expression data confirm the overexpression for KG1 (blue) vs. transfected KG1 (red). h Flow cytometry of SMARCA4 surface expression data for U937 (blue) vs. transfected U937 (red). We note that U937 already strongly expresses SMARCA4, while KG1 exhibits minimal expression until after transfection. Abbreviations in d and f are as follows: PE-A, P-phycoerythrin area; MFI, mean fluorescence intensity; D anti Ri, Donkey anti-Rabbit

References

    1. PhRMA. Summer 2016 chart pack of the Pharmaceutical Research and Manufacturers of America (PhRMA, 2016).
    1. Garnett MJ, et al. Systematic identification of genomic markers of drug sensitivity in cancer cells. Nature. 2012;483:570–575. doi: 10.1038/nature11005. - DOI - PMC - PubMed
    1. Barretina J, et al. The Cancer Cell Line Encyclopedia enables predictive modelling of anticancer drug sensitivity. Nature. 2012;483:603–607. doi: 10.1038/nature11003. - DOI - PMC - PubMed
    1. Zou H, Hastie T. Regularization and variable selection via the elastic net. J. R. Stat. Soc. Ser. B. 2005;67:768–768. doi: 10.1111/j.1467-9868.2005.00527.x. - DOI
    1. Heiser LM, et al. Subtype and pathway specific responses to anticancer compounds in breast cancer. Proc. Natl Acad. Sci. USA. 2012;109:2724–2729. doi: 10.1073/pnas.1018854108. - DOI - PMC - PubMed

Publication types

MeSH terms