. 2018 Jan 3;9(1):1.
doi: 10.1038/s41419-017-0012-9.

Oxidative stress preconditioning of mouse perivascular myogenic progenitors selects a subpopulation of cells with a distinct survival advantage in vitro and in vivo

Affiliations

Oxidative stress preconditioning of mouse perivascular myogenic progenitors selects a subpopulation of cells with a distinct survival advantage in vitro and in vivo

Cesare Gargioli et al. Cell Death Dis. .

Abstract

Cell engraftment, survival and integration during transplantation procedures represent the crux of cell-based therapies. Thus, there have been many studies focused on improving cell viability upon implantation. We used severe oxidative stress to select for a mouse mesoangioblast subpopulation in vitro and found that this subpopulation retained self-renewal and myogenic differentiation capacities while notably enhancing cell survival, proliferation and migration relative to unselected cells. Additionally, this subpopulation of cells presented different resistance and recovery properties upon oxidative stress treatment, demonstrating select advantages over parental mesoangioblasts in our experimental analysis. Specifically, the cells were resistant to oxidative environments, demonstrating survival, continuous self-renewal and improved migration capability. The primary outcome of the selected cells was determined in in vivo experiments in which immunocompromised dystrophic mice were injected intramuscularly in the tibialis anterior with selected or non-selected mesoangioblasts. Resistant mesoangioblasts exhibited markedly enhanced survival and integration into the host skeletal muscle, accounting for a more than 70% increase in engraftment compared with that of the unselected mesoangioblast cell population and leading to remarkable muscle recovery. Thus, the positive effects of sorting on mesoangioblast cell behaviour in vitro and in vivo suggest that a selection step involving oxidative stress preconditioning may provide a novel methodology to select for resistant cells for use in regenerative tissue applications to prevent high mortality rates upon transplantation.


Conflict of interest statement

The authors declare that they have no competing financial interests.

Figures

Fig. 1
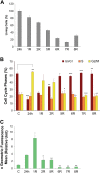
Fig. 1. Selection of growth culture condition for experiments on A6 cells
a Histograms  of cell cycle phase distribution: control cells 'C' and treated cells for 24 h with H2O2: 50, 100, 200, and 400 μM. b Effects of oxidative stress on cell viability: control cells 'C' and treated cells for 24 h with 50, 100, 200, and 400 μM. H2O2 assayed by trypan blue exclusion assays. c Histograms of cell cycle phase distribution during 24 h of treatment: control cells 'C' and treated cells with 400 μM H2O2 for 4, 8, 14 and 24 h. All data in histograms A, B and C were obtained from three independent experiments. The error bars indicate standard deviation. **P < 0.05, ***P < 0.005 vs control group. p38 is responsible for cell cycle progression. d-e Phosphorylated p38 kinase level of A6 cells after a 400 μM H2O2 24 h treatment. Western blot d and quantification e of the two phosphorylated p38 kinase isoforms. Phosphorylated p38 levels in control A6 cells 'C' and in treated A6 cells (400 μM H2O2 for 4, 8, 14, 24 h). The levels of p38 were valuated after quantification of immunoreactive bands by Quantity One software. Data were obtained from three independent experiments. The error bars indicate standard deviation. f Histograms of cell  cycle phase distribution of treated A6 cells in presence of the p38 inhibitor SB202190. Control A6 cells 'C', treated A6 cells (400 μM H2O2 for 24 h) '24 h', treated (as 24 h) A6 cells with p38 inhibitor '24 h + SB202190'. Displayed are typical histograms from three independent experiments. Error bars indicate standard deviation
Fig. 2
Fig. 2. Effect of 400 μM H2O2 treatment on A6 cells during recovery time
a Histograms of cell viability assayed by trypan blue exclusion assays: treated cells '24 h' with 400 μM H2O2 and after 1, 2, 5, 6, 7 and 8 days of recovery (R) calculated respect to 24 h. b Histograms of cell cycle phase distribution: control cells 'C', treated cells (400 μM H2O2 24 h) and after 1, 2, 5 and 8 days of recovery are represented. c Histograms of ROS content: control cells “C”, treated cells (400 μM H2O2 24 h) and after 1, 2, 5, 6, 7 and 8 days of recovery are represented. The ROS values of samples were reported in graph as multiple of cell control value (see methods). All data were obtained from three independent experiments. Error bars indicate standard deviation. *P < 0.5, **P < 0.05, ***P < 0.005 vs control group, or H2O2 group
Fig. 3
Fig. 3. Differentiation of A6 cells and H2 cell clone in vitro
a A6 cells a and cell clone b after differentiation in adipocytes, A6 cells c and cell clone d differentiated in adipocyte and stained by oil red. Showed are typical photographs with 20X magnification. Scale bar is 15 μm. All data were obtained from three independent experiments. b A6 cells a, b and cell clone c, d labeled with lentiviral infection with nuclear nLacZ differentiated in myotube in co-culture with C2C12 mouse myoblast cell line. Immunofluorescence against LacZ (green) and Myosin Heavy Chain (MyHC) (red) revealing H2 nuclei participation in fusing and forming myotubes c while A6 nuclei remain undifferentiated outward MyHC positive myofibers a; nuclei are counterstained with DAPI (blue) b, d. The inserts are enlarged view of the dashed area, highlighting H2 enrolment into myotube formation. Scale bar values: a, c = 25 μm; inserts = 10μm. c Number of LacZ positive nuclei of A6 cells and cell clone in myotubes. Error bars indicate standard deviation. ***P < 0.005
Fig. 4
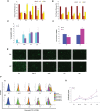
Fig. 4. A second oxidative stress does not arrest H2 cells in G2/M cell cycle phase
a- b Cell cycle phase distribution after 200 μM H2O2 treatment and recovery time. Histograms of cell cycle phase distribution of A6 cells a and cell clone b: control cells 'C', treated cells (200 μM H2O2 24 h) and after 1, 2, 5 days of recovery time are represented. Error bars indicate standard deviation. *P < 0.5, **P < 0.05, ***P < 0.005 vs control group or H2O2 treated group. c Summary of the apoptosis data in histogram form (Annexin V positive+Annexin V and Sytox green double positive cells). d Cell number of both A6 cells and cell clone after oxidative stress. Total cell number of A6 cells and cell clone after 24 h of 200 μM H2O2, and the same at 1 day of recovery period (R), Error bars indicate standard deviation. ***P < 0.005. Histograms a-d  are representative of three independent experiments.  e-g H2 and A6 cell proliferation monitored using CFSE labeling. e Representative fluorescence images of CFSE dye labeled A6 and H2 cells incubated with or without 200 µM of H2O2 and observed at the indicated time point. Showed are typical photographs with 20X magnification. Scale bar is 10 µm. f Cells were harvested at different time point and proliferation was analyzed by FACS. Representative analyses from three separate experiments are shown. g Proliferation index are reported. Results are expressed as mean of three independent experiments. Error bars indicate standard deviation. *P < 0.1, **P < 0.01, ***P < 0.001 vs 0 h
Fig. 5
Fig. 5. Different amount of MMP2 in cell clone and A6 cells
a qRT-PCR analysis of MMP2 mRNA in A6 cells and cell clone. Relative quantities of mRNA were first normalized to GAPDH and actin genes, and then A6 samples were arbitrarily set to a value of 1 (n = 3). Data are expressed as mean ± Standard Error of the Mean. ***P < 0.001. b, c Western blot assay and histogram of MMP2 in untreated A6 cells and cell clone. The levels of MMP2 were valuated after quantification of immunoreactive bands, obtained by immunoblot assay, by Quantity one software. d-e Different migration capability of A6 cells vs H2 cells. Scratch test of A6 cells and cell clone under normal growth conditions and after 200 μM H2O2 treatment for 24 h ' + H2O2'. d Both cell types were plated in 6–well plates and subjected to wound healing assays and immediately subjected to 200 μM H2O2 treatment for 24 h. Results are a representative experiment from at least three independently performed experiments with similar results. e The number of migrated cells was recorded and the data of three independent experiments are expressed as means. A6 samples were arbitrarily set to a value of 100
Fig. 6
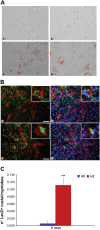
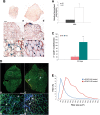
Fig. 6. H2 clone transplanted into mouse immunocompromised dystrophic model is more resistant and have a higher integration capability
a LacZ qRT-PCR of A6 cells and cell clone. RNA was isolated from the treated TA 48 h after mabs intramuscular injection. b Immunohistochemistry against laminin (brown) and X-Gal staining (blue) on TA section showing A6 cells a-c and H2 cell clone d-f, modified for nLacZ and implanted intramuscularly in mouse dystrophic model, after 20 days from injection. Dotted boxes in a and d indicate areas of enlarged view (b, e) revealing LacZ positive nuclei into host TA, showing in e integrated LacZ positive nuclei inside regenerating host myofibers. The images in a and d are collage resulting to obtain whole TA section images. a, d Magnification 10X, b, e magnification 20X, c, f magnification 40X. Scale bars: a 300 μm; b) 40 μm; c 20 μm. c Number of LacZ positive nuclei of A6 cells and cell clone injected in the muscle. The data are representative from three independently experiments. The error bars indicate standard deviation. **P < 0.05, ***P < 0.005. d Muscle recovery upon 40 days H2 treatment. a-d Collage resulting images from TA section immunofluorescence against Laminin (green) and αSarcoglycan (αSG) (red) revealing morphology and overall αSG expression recovery areas (arrows in b) upon H2 intramuscular injection c, d comparing with A6 infusion a, b. b, d Enlarged view of dashed boxes showing still small, centre-nucleated degenerating myofibers (arrowheads) after A6 graft b and αSG expression (arrows) and recovered morphology - myofibers with uniform size—upon cell clone injection d nuclei were labeled by DAPI (blue). e Fibres Cross Sectional Analysis (CSA) highlights the muscle recovery due to H2 effect on αSGKO dystrophic muscle, presenting the disappearance of small (under 500 μm2) degenerating muscle fibres

References

    1. Chavakis E, Urbich C, Dimmeler S. Homing and engraftment of progenitor cells: a prerequisite for cell therapy. J. Mol. Cell. Cardiol. 2008;45:514–522. doi: 10.1016/j.yjmcc.2008.01.004. - DOI - PubMed
    1. Sampaolesi M, et al. Cell therapy of alpha-sarcoglycan null dystrophic mice through intra-arterial delivery of mesoangioblasts. Science. 2003;301:487–492. doi: 10.1126/science.1082254. - DOI - PubMed
    1. Li F, et al. Apoptotic cells activate the “phoenix rising” pathway to promote wound healing and tissue regeneration. Sci. Signal. 2010;3:ra13–ra32. - PMC - PubMed
    1. Giannotta M, et al. Targeting endothelial junctional adhesion molecole-A/ EPAC/Pap-1 axis as a novel strategy to increase stem cell engraftment in dystrophic muscles. EMBO Mol Med. 2014;6:239–258. - PMC - PubMed
    1. Kang SK, Shin IS, Ko MS, Jo JY, Ra JC. Journey of mesenchymal stem cells for homing: strategies to enhance efficacy and safety of stem cell therapy. Stem Cells Int. 2012;2012:342968–342978. doi: 10.1155/2012/342968. - DOI - PMC - PubMed

Publication types

MeSH terms

LinkOut - more resources