. 2018 Jan 3;553(7686):86-90.
doi: 10.1038/nature25021.

Acoustic reporter genes for noninvasive imaging of microorganisms in mammalian hosts

Affiliations

Acoustic reporter genes for noninvasive imaging of microorganisms in mammalian hosts

Raymond W Bourdeau et al. Nature. .

Abstract

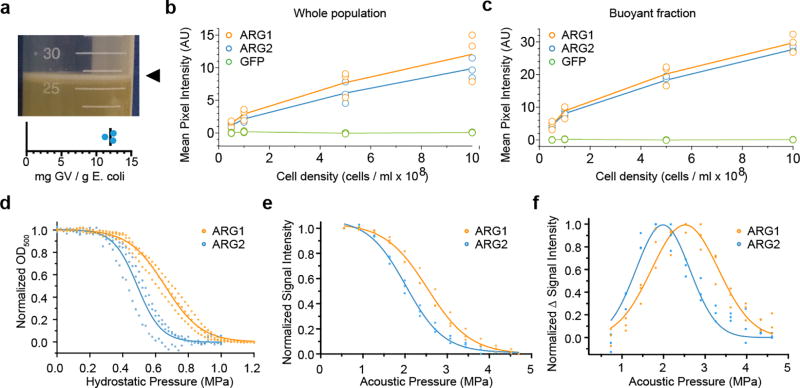
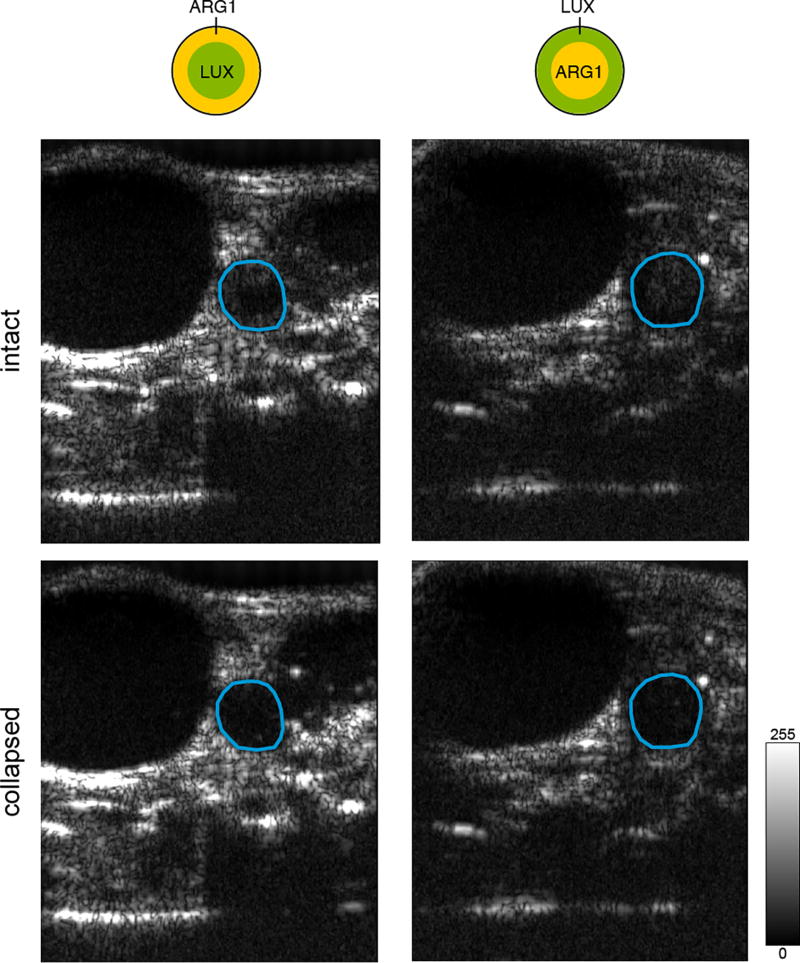
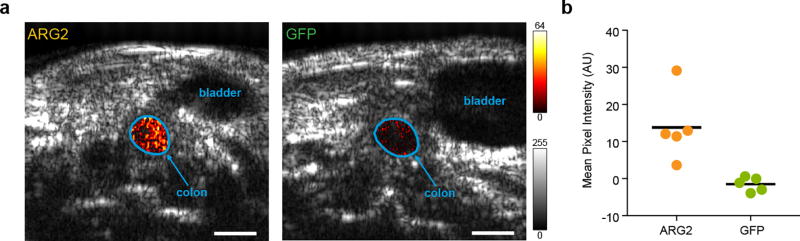
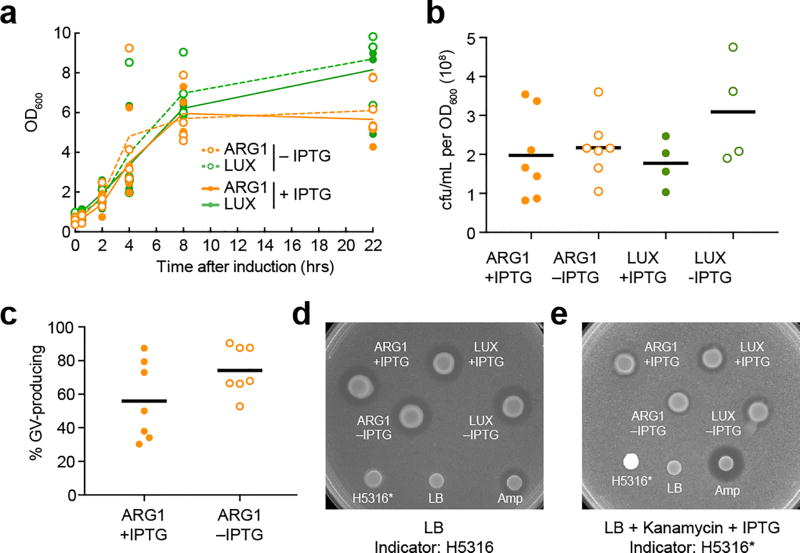
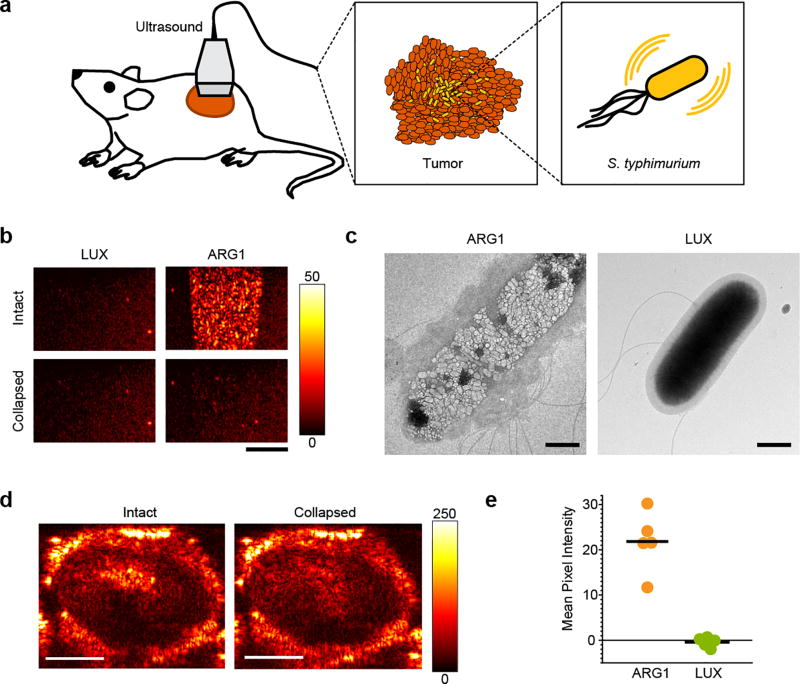
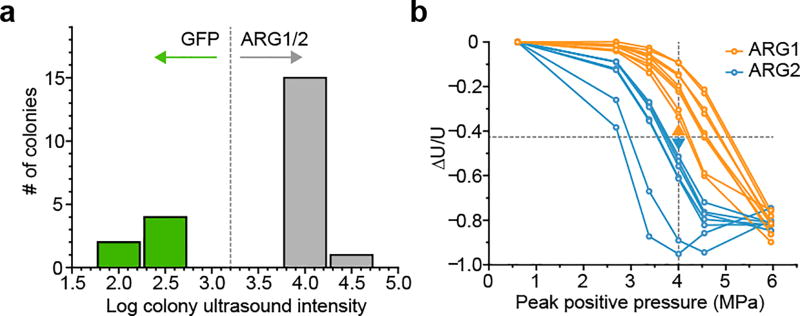
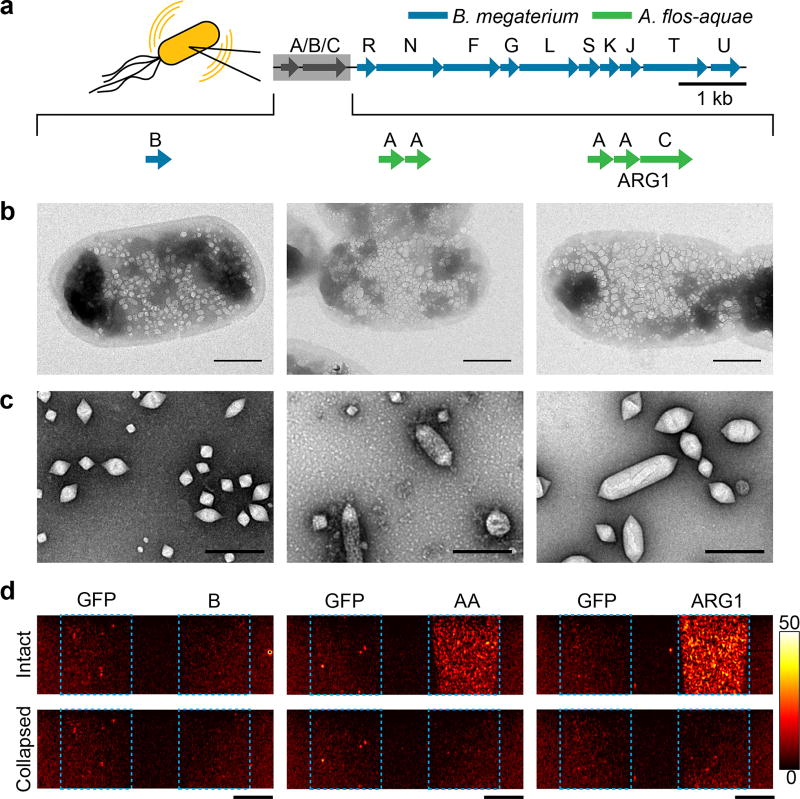
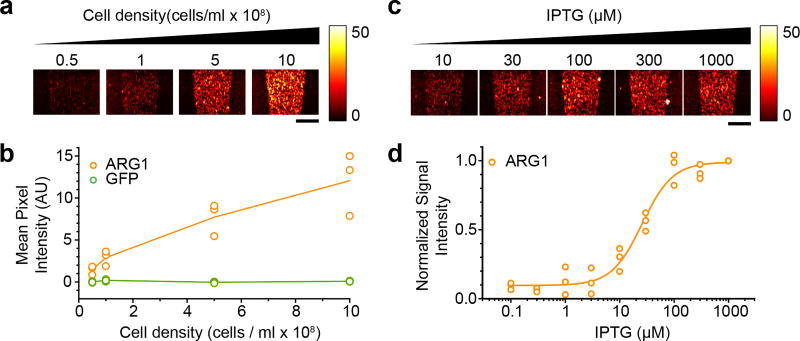
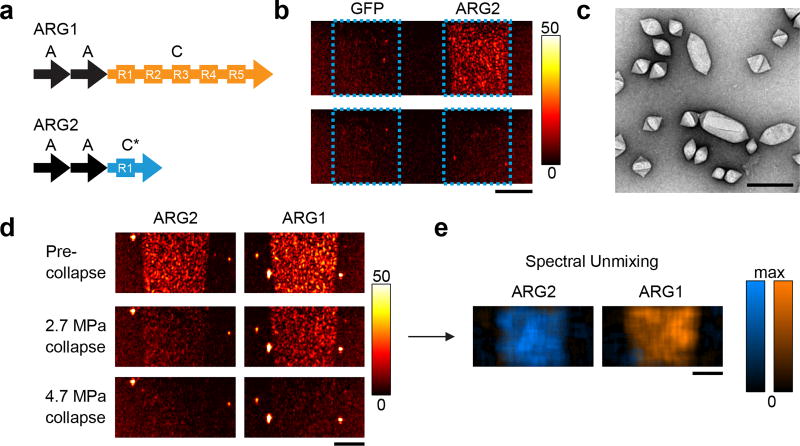
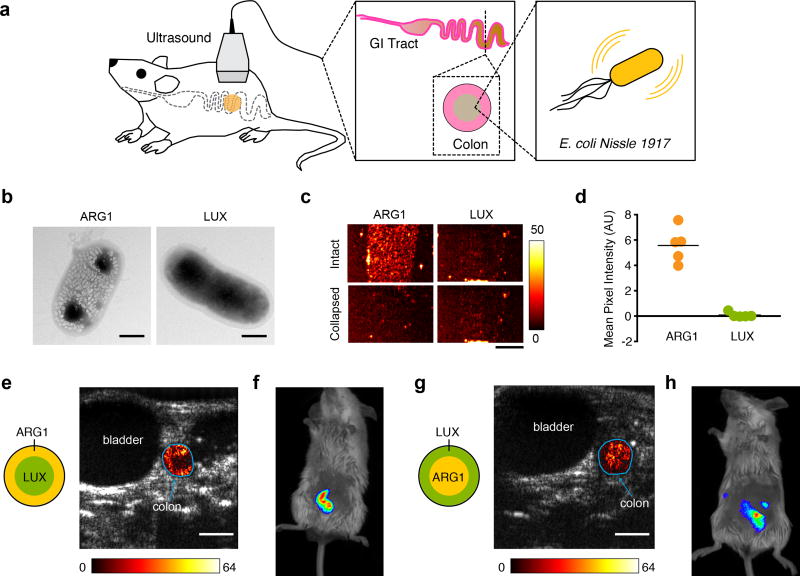
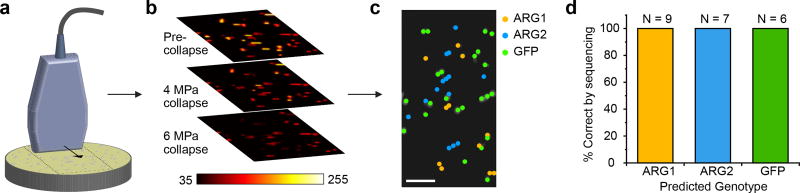
The mammalian microbiome has many important roles in health and disease, and genetic engineering is enabling the development of microbial therapeutics and diagnostics. A key determinant of the activity of both natural and engineered microorganisms in vivo is their location within the host organism. However, existing methods for imaging cellular location and function, primarily based on optical reporter genes, have limited deep tissue performance owing to light scattering or require radioactive tracers. Here we introduce acoustic reporter genes, which are genetic constructs that allow bacterial gene expression to be visualized in vivo using ultrasound, a widely available inexpensive technique with deep tissue penetration and high spatial resolution. These constructs are based on gas vesicles, a unique class of gas-filled protein nanostructures that are expressed primarily in water-dwelling photosynthetic organisms as a means to regulate buoyancy. Heterologous expression of engineered gene clusters encoding gas vesicles allows Escherichia coli and Salmonella typhimurium to be imaged noninvasively at volumetric densities below 0.01% with a resolution of less than 100 μm. We demonstrate the imaging of engineered cells in vivo in proof-of-concept models of gastrointestinal and tumour localization, and develop acoustically distinct reporters that enable multiplexed imaging of cellular populations. This technology equips microbial cells with a means to be visualized deep inside mammalian hosts, facilitating the study of the mammalian microbiome and the development of diagnostic and therapeutic cellular agents.


Conflict of interest statement

The authors declare no competing financial interests. Readers are welcome to comment on the online version of the paper.

Figures

Extended Data Figure 1
Extended Data Figure 1. Sequence homology of GvpA/B
Amino acid sequence alignment of the primary gas vesicle structural protein, GvpB from B. megaterium (the GvpA analog in this species) and GvpA from A. flos-aquae.
Extended Data Figure 2
Extended Data Figure 2. Ultrasound contrast from buoyancy-enriched cells
(a) Diagram of centrifugation-assisted enrichment of buoyant cells. (b) Image of ARG1 E. coli culture 22 hours after induction and 4 hours of centrifugation at 350 g, showing the presence of buoyant cells. Arrow points to meniscus layer containing buoyant cells. Experiment repeated 3 times with similar results. (c) Ultrasound images of E. coli expressing ARG1 at various cellular concentrations, with and without buoyancy enrichment. Experiment was repeated 4 times with similar results. (d) Ultrasound contrast from E. coli expressing ARG1, with and without buoyant enrichment, and GFP at various cell densities. N=3 biological replicates; lines represent the mean.
Extended Data Figure 3
Extended Data Figure 3. Time course of acoustic reporter gene contrast after induction
(a) Ultrasound images of ARG1-expressing E. coli at various times after induction with IPTG. Experiment repeated 4 times with similar results. (b) Mean ultrasound contrast at each time point N=4 biological replicates; line represents the mean. Cell concentration was 5 × 10⁸ cells/ml. Scale bar represents 2 mm.
Extended Data Figure 4
Extended Data Figure 4. Acoustic reporter gene expression and ultrasound imaging does not affect cell viability
(a) Growth curves of E. coli containing the ARG1 or GFP expression plasmid, with or without induction using 0.4 mM IPTG. N=3 biological replicates per sample; lines represent the means. (b) Representative TEM images of whole E. coli cells expressing ARG1 with and without exposure to acoustic collapse pulses, and E. coli cells expressing GFP. Images were acquired from 3 biologically independent samples for ARG1, two for ARG1 with ultrasound collapse and one for GFP (more than 50 cells imaged per sample) with similar results. (c) Dark field optical image of agar plate containing colonies of E. coli expressing ARG1 14 hours after seeding. (d) Image of the same plate after the right half of the plate was insonated with high-pressure ultrasound. (e) Image of the same plate 20 hours after insonation. (f) Image after the right half of the plate in (e) was insonated with high-pressure ultrasound. Zoomed in images of representative colonies shown below each plate image. Scale bars represent 500 nm. Experiment was repeated 3 times with similar results.
Extended Data Figure 5
Extended Data Figure 5. Multiplexed imaging of genetically engineered reporter variants
(a) Top: image of ARG2 E. coli culture 22 hours after induction showing the presence of buoyant cells. Experiment repeated 3 times with similar results. Bottom: mass fraction of gas vesicles produced 22 hours after induction. N=3 biological replicates; line represents the mean. (b) Ultrasound contrast from the whole population of cells expressing ARG1, ARG2 or GFP. N=3 biological replicates; lines represent the mean. (c) Ultrasound contrast from the buoyancy-enriched population of cells expressing ARG1, ARG2 or GFP. N=3 biological replicates; lines represent the mean. (d) Normalized optical density (representing the intact fraction) of gas vesicles isolated from ARG1- or ARG2-expressing E. coli as a function of applied hydrostatic pressure. (e) Normalized ultrasound intensity as a function of peak positive pressure from 0.6 to 4.7 MPa for E. coli expressing ARG1 or ARG2. (f) Acoustic collapse spectra derived by differentiating the data and curves in (e) with respect to applied pressure. N=3 biological replicates per sample in d-f. Curves represent fits of the data using the Boltzmann sigmoid function to assist visualization.
Extended Data Figure 6
Extended Data Figure 6. Anatomical ultrasound images of acoustic bacteria in the gastrointestinal tract
Raw images underlying the difference maps shown in Fig. 4, e and g. The cyan outline identifies the colon region of interest for difference processing. This experiment was repeated 3 times with similar results.
Extended Data Figure 7
Extended Data Figure 7. Ultrasound imaging of ARG-expressing cells in the mouse colon
(a) Transverse ultrasound images of mice whose colon contains BL21 E. coli expressing either ARG2 or GFP at a final concentration of 109 cells/ml. A difference heat map of ultrasound contrast within the colon ROI before and after acoustic collapse is overlaid on a grayscale anatomical image. (b) Signal intensity in mice with E. coli expressing either ARG2 or GFP. N=5 biological replicates per sample. P-value = 0.02 using two-sided heteroscedastic t-test. Scale bar represents 2 mm.
Extended Data Figure 8
Extended Data Figure 8. Impact of ARG1 and LUX expression on E. coli Nissle 1917 (EcN) cell growth, viability and microcin release
(a) Optical density at 600 nm measured 0 to 22 hours after induction with 3 µM IPTG, or without induction, in EcN cells transformed with ARG1 or LUX. N=4 biological replicates per time point. Lines represent the mean. The p-value comparing induced ARG1 and induced LUX values at 22 hours is 0.06. The p-value comparing uninduced ARG1 and induced LUX at 22 hours is 0.02. Comparisons at all other time points have p-values greater than 0.14. (b) Colony-forming units (cfu) per mL culture per OD600 after 22 hours of induction with 3 µM IPTG, or uninduced growth, of EcN cells transformed with ARG1 or LUX. All p-values greater than or equal to 0.22. N=7 biological replicates for ARG1 samples and N=4 biological replicates for LUX samples. Lines represent the mean. (c) Fraction of opaque, GV-producing colonies produced by plating ARG1-transformed EcN cells 22 hours after induction with 3 µM IPTG, or uninduced growth. Cells are plated on dual-layer IPTG induction plates, allowed to grow overnight at 30°C, and imaged as in Fig. 3, c-f. p-value=0.12. N=7 biological replicates. Lines represent the mean. (d) Left image: microcin release assay using a uniform layer of the indicator strain E. coli K12 H5316 in soft agar, after 17-hour incubation with filters containing microcin sources and controls, as indicated. EcN cells transformed with ARG1 or LUX were induced for 22 hours with 3 µM IPTG, or grown without induction, before spotting. H5316* indicates H5316 cells transformed with mWasabi and cultured for 22 hours as with EcN cells. All cells were washed before spotting to remove antibiotic. LB is LB media. Amp is 100 mg/ml ampicillin. Experiment was performed 4 times with similar results. (e) Results of the same experiment as in (d), but with the indicator strain comprising H5316* cells and the agar containing 50 µg/mL kanamycin, 3 µM IPTG and 50 µM desferal, to show that microcin release also occurs during transgene expression. Note that the H5316* spot appears bright because plate image is acquired with blue light transillumination, resulting in mWasabi fluorescence. Experiment was performed 4 times with similar results. All p-values were calculated using a two-sided heteroscedastic t-test.
Extended Data Figure 9
Extended Data Figure 9. Ultrasound imaging of S. typhimurium in tumor xenografts
(a) Diagram of tumor imaging experiment. S. typhimurium expressing ARG1 were introduced into the tumor of mice and imaged with ultrasound. (b) Ultrasound images of a gel phantom containing S. typhimurium expressing ARG1 or the LUX operon. Cell concentration is 109 cells/ml. Experiment repeated 3 times with similar results. (c) TEM images of whole S. typhimurium cells expressing ARG1 with and without exposure to acoustic collapse pulses. At least 20 cellular images were acquired for each sample type (from one biological preparation each) with similar results. (d) Ultrasound images of mouse OVCAR8 tumors injected with 50 µL of 3.2 × 10⁹ cells/ml ARG1-expressing S. typhimurium, before and after acoustic collapse. Experiment repeated 5 times with similar results. (e) Collapse-sensitive ultrasound contrast in tumors injected with ARG1-expressing or LUX-expressing cells. N=5 animals. Line represens the mean. P-value = 0.002 using a two-sided heteroscedastic t-test. Scale bars 2 mm (b), 500 nm (c) and 2.5 mm (d).
Extended Data Figure 10
Extended Data Figure 10. High throughput screening of acoustic phenotypes
(a) Ultrasound intensity histogram of 22 randomly picked colonies. Colonies with low contrast were predicted to contain the GFP gene and those with high contrast to contain ARG1 or ARG2 genes. (b) Normalized change in ultrasound intensity for each of the 15 ARG1 or ARG2 colonies after insonation at increasing pressures. At 4 MPa, colonies with signal above the indicated threshold were predicted to be ARG1 and below to be ARG2. This experiment was performed once; each colony was treated as a biological replicate.
Fig. 1
Fig. 1. Genetic engineering of acoustic reporter genes
(a) Architecture of acoustic reporter gene clusters. Panels (b)–(f) are organized in columns corresponding to each of these constructs. (b) TEM images of representative E. coli cells expressing each construct. (c) TEM images of gas vesicles isolated from E. coli expressing each construct. (d) Ultrasound images of agarose phantoms containing E. coli expressing each construct or GFP. The cell concentration is 109 cells/ml. Images in bottom panels were acquired after acoustic collapse. Blue outlines indicate the location of each specimen. Color bar represents linear signal intensity. Scale bars represent 500 nm in (b), 250 nm in (c) and 2 mm in (d). All imaging experiments were repeated 3 times with similar results.
Fig. 2
Fig. 2. Imaging dilute bacterial populations and dynamically regulated gene expression
(a) Ultrasound images of ARG1-expressing E. coli at various cellular concentrations, before and after acoustic collapse. (b) Mean ultrasound contrast from E. coli expressing ARG1 and GFP at various cell densities. N=3 biological replicates per sample; lines show the mean. (c) Ultrasound images of E. coli expressing ARG1 after induction with various IPTG concentrations. Cell concentration was 5 × 10⁸ cells/ml. (d) Normalized ultrasound contrast as a function of IPTG concentration. N=3 biological replicates per sample. Line shows a fit of the data with the Hill equation to facilitate visualization. Scale bars represent 2 mm. Each imaging experiment was repeated 3 times with similar results.
Fig. 3
Fig. 3. Multiplexed imaging of genetically engineered reporter variants
(a) Diagram of the GvpA and GvpC sequences included in the ARG1 and ARG2 gene clusters. (b) Ultrasound images of a gel phantom containing E. coli expressing ARG2 or GFP (109 cells/ml). Blue outlines indicate the location of each specimen. (c) Transmission electron micrographs of isolated ARG2 gas vesicles. (d) Ultrasound images of gel phantoms containing ARG1 or ARG2 before collapse, after collapse at 2.7 MPa and after collapse at 4.7 MPa (109 cells / mL). (e) Overlay of the blue and orange-colored maps from spectral unmixing of ARG2 and ARG1, based on the series of images in (d). Scale bars represent 2 mm in (b), (d), (e) and 250 nm in (c). Each imaging experiment was repeated 3 times with similar results.
Fig. 4
Fig. 4. Ultrasound imaging of bacteria in the gastrointestinal tract
(a) Diagram of GI imaging experiment. (b) Representative TEM images of whole EcN cells expressing ARG1 or the LUX operon. Images were acquired from 3 biologically independent samples for ARG1 and one for LUX (approximately 35 cells imaged in each sample) with similar results. (c) Ultrasound images of a gel phantom containing EcN expressing ARG1 or the LUX operon. Experiment repeated 5 times with similar results. (d) Mean collapse-sensitive ultrasound signal in phantoms containing EcN cells expressing ARG1 or LUX. Line represents mean. (P-value = 0.0007, N=5). Cell concentration in (c–d) was 109 cells/ml. (e) Transverse ultrasound image of a mouse whose colon contains EcN expressing ARG1 proximal to the colon wall, and EcN expressing LUX at the center of the lumen. (f) Luminescence image of mouse with the same arrangement of colonic bacteria. (g and h) Same as (e) and (f), but with EcN expressing ARG1 at the center of the lumen and EcN expressing LUX at the periphery. Cells are loaded at a final concentration of 109 cells/ml. In (e) and (g), a difference heat map of ultrasound contrast within the colon ROI before and after acoustic collapse is overlaid on a grayscale anatomical image. In (f) and (h), a thresholded luminescence map is overlaid on a bright field image of the mouse. Scale bars represent 500 nm in (b), 2 mm in (c), and 2.5 mm in (e and g). In vivo imaging experiments were repeated 3 times with similar results.
Fig. 5
Fig. 5. High throughput screening of acoustic phenotypes
(a) Illustration of acoustic colony screening. (b) Colony ultrasound images of a mixed population of ARG1, ARG2, and GFP expressing E. coli colonies. Images were acquired before collapse and after collapse at 4.0 and 6.0 MPa peak acoustic pressures. This imaging experiment was performed once; each colony was treated as a biological replicate. (c) Predicted genotypes of each colony based on the acoustic phenotype seen in the images in (b). Scale bar represents 10 mm. (d) Confirmation of predicted genotypes by colony picking and sequencing. N=the number of sequenced colonies of each type.

Comment in

References

    1. Round JL, Mazmanian SK. The gut microbiota shapes intestinal immune responses during health and disease. Nature Reviews Immunology. 2009;9:313–323. - PMC - PubMed
    1. Wang Y, Kasper LH. The role of microbiome in central nervous system disorders. Brain, behavior, and immunity. 2014;38:1–12. - PMC - PubMed
    1. Danino T, et al. Programmable probiotics for detection of cancer in urine. Science translational medicine. 2015;7:289ra284–289ra284. - PMC - PubMed
    1. Steidler L, et al. Treatment of murine colitis by Lactococcus lactis secreting interleukin-10. Science. 2000;289:1352–1355. - PubMed
    1. Claesen J, Fischbach MA. Synthetic microbes as drug delivery systems. ACS synthetic biology. 2014;4:358–364. - PMC - PubMed

Publication types

MeSH terms