. 2018 Apr 1;7(4):1-12.
doi: 10.1093/gigascience/gix134.

Construction of the third-generation Zea mays haplotype map

Affiliations

Construction of the third-generation Zea mays haplotype map

Robert Bukowski et al. Gigascience. .

Abstract

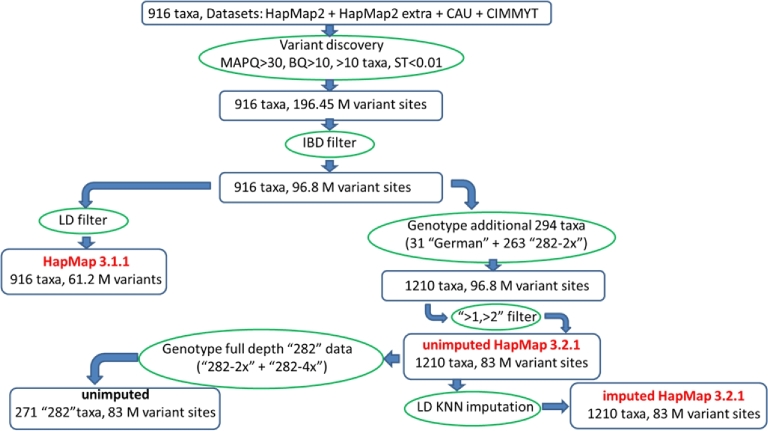
Background: Characterization of genetic variations in maize has been challenging, mainly due to deterioration of collinearity between individual genomes in the species. An international consortium of maize research groups combined resources to develop the maize haplotype version 3 (HapMap 3), built from whole-genome sequencing data from 1218 maize lines, covering predomestication and domesticated Zea mays varieties across the world.

Results: A new computational pipeline was set up to process more than 12 trillion bp of sequencing data, and a set of population genetics filters was applied to identify more than 83 million variant sites.

Conclusions: We identified polymorphisms in regions where collinearity is largely preserved in the maize species. However, the fact that the B73 genome used as the reference only represents a fraction of all haplotypes is still an important limiting factor.


Figures

Figure 1:
Figure 1:
Overview of the HapMap 3 pipeline. Initial set of tentative variant sites was obtained from 916 taxa using reads with a mapping quality (MAPQ) of at least 30 and bases with a base quality of at least 10. At least 10 taxa had to have non-0 read coverage, and the P-value from the segregation test on allelic depths had to be at most 0.01. This initial set of sites was subject to filtering based on identity by descent. Application of a linkage disequilibrium filter eliminated sites with only nonlocal LD hits, leading to the HapMap 3.1.1 variant set. An alternative route, leading to HapMap 3.2.1 genotypes, involved K nearest neighbors imputation, in which distances were computed using sites in good local LD (hence, LD KNN). See the text for detailed explanation of methods and acronyms. The exact numbers of variant sites in HapMap 3.1.1 and HapMap 3.2.1 are 61 228 639 and 83 153 144, respectively.
Figure 2:
Figure 2:
Overlap between various classes of HapMap 3.1.1 polymorphic sites. All sites listed passed the ST and IBD filters. LLD sites are those found in local LD with the GBS anchor. Sites flagged IBD1 passed the IBD filter; however, no alternative allele was present in IBD contrasts. Such sites do not violate IBD, but the existence of a variant is not confirmed. The NI5 flag is used to mark indels and sites within 5 bp of an indel. As no local re-alignment was done, the NI5 sites are not reliable.
Figure 3:
Figure 3:
Polymorphic sites detected by the HapMap 3.1.1 pipeline based on 2 read mapping quality thresholds: MAPQ ≥1 (q1) and MAPQ ≥30 (q30). Tightening of the MAPQ threshold affects mostly the sites flagged with IBD1 (least reliable), while the LLD sites (in local LD with GBS anchor) are mostly independent.
Figure 4:
Figure 4:
Distribution of inbreeding coefficient for HapMap 3.1.1 variant sets obtained with 2 read mapping quality thresholds: MAPQ ≥1 (q1) and MAPQ ≥30 (q30). A lower MAPQ threshold leads to lower values of inbreeding coefficient (i.e., higher heterozygosities) resulting from misaligned reads.
Figure 5:
Figure 5:
Overlap between HapMap 3.1.1 and HapMap 3.2.1 variant sites; 86% of HapMap 3.1.1 sites (99% of those in local LD) are recovered by the HapMap 3.2.1 pipeline.
Figure 6:
Figure 6:
Distribution of fraction of heterozygous sites per taxon for unimputed and imputed HapMap 3.2.1. Curves marked LLD have been obtained considering only sites verified in HapMap 3.1.1 to be in good local LD with GBS anchor.
Figure 7:
Figure 7:
Cumulative distribution of mapping quality from BWA mem alignment of 125.4 million 150-bp reads from taxon A272.
Figure 8:
Figure 8:
Linkage disequilibrium–based filtering flowchart. The procedure eliminates sites with weak or non-local-only LD hits. Sites with good local LD hits as well as those for which LD could not be probed (because of low MAF) are retained.

References

    1. Chia J-M, Song C, Bradbury PJ et al. . Maize HapMap2 identifies extant variation from a genome in flux. Nat Genet 2012;44:803–7. - PubMed
    1. Unterseer S, Bauer E, Haberer G et al. . A powerful tool for genome analysis in maize: development and evaluation of the high density 600 k SNP genotyping array. BMC Genomics 2014;15:823. doi:10.1186/1471-2164-15-823. - DOI - PMC - PubMed
    1. Bukowski R, Guo X, Yanli Lu et al. . Supporting data for “Construction of the third generation Zea mays haplotype map.” GigaScience Database 2017. http://dx.doi.org/10.5524/100339. - DOI - PMC - PubMed
    1. Abecasis GR, Auton A, Brooks LD et al. . An integrated map of genetic variation from 1,092 human genomes. Nature 2012;491:56–65. - PMC - PubMed
    1. DePristo MA, Banks E, Poplin R et al. . A framework for variation discovery and genotyping using next-generation DNA sequencing data. Nat Genet 2011;43:491–8. - PMC - PubMed

Publication types