

Identifying 'corridors of HIV transmission' in a severely affected rural South African population: a case for a shift toward targeted prevention strategies
- PMID: 29300904
- PMCID: PMC5913614
- DOI: 10.1093/ije/dyx257
Identifying 'corridors of HIV transmission' in a severely affected rural South African population: a case for a shift toward targeted prevention strategies
Abstract
Background: In the context of a severe generalized African HIV epidemic, the value of geographically targeted prevention interventions has only recently been given serious consideration. However, to date no study has performed a population-based analysis of the micro-geographical clustering of HIV incident infections, limiting the evidential support for such a strategy.
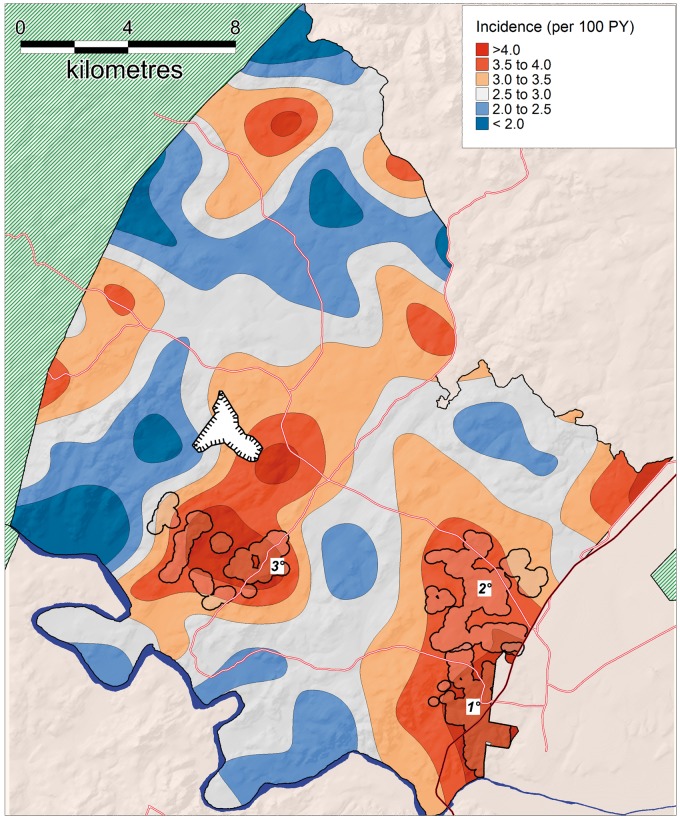
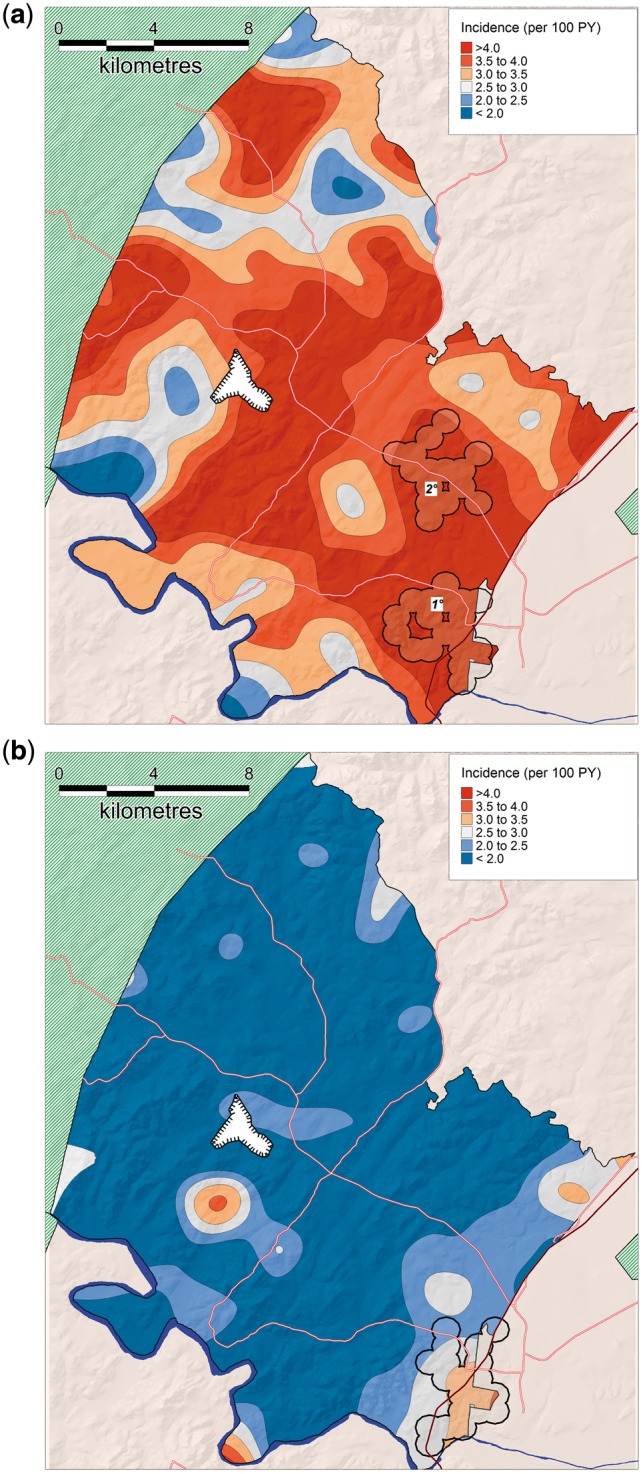
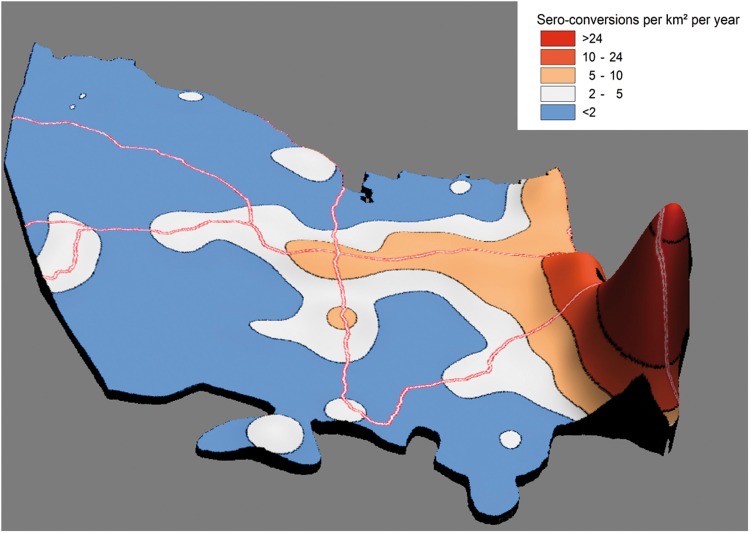
Methods: We followed 17 984 HIV-uninfected individuals aged 15-54 in a population-based cohort in rural KwaZulu-Natal, South Africa, and observed individual HIV sero-conversions between 2004 and 2014. We geo-located all individuals to an exact homestead of residence (accuracy <2 m). We then employed a two-dimensional Gaussian kernel of radius 3 km to produce robust estimates of HIV incidence which vary across continuous geographical space. We also applied Tango's flexibly shaped spatial scan statistic to identify irregularly shaped clusters of high HIV incidence.
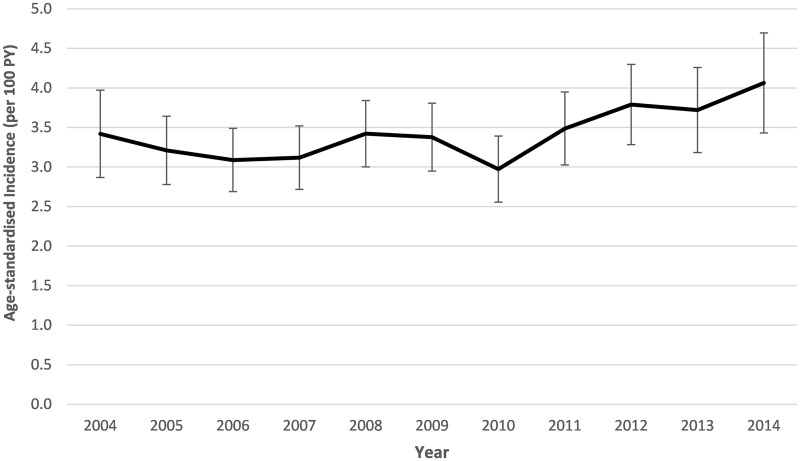
Results: Between 2004 and 2014, we observed a total of 2 311 HIV sero-conversions over 70 534 person-years of observation, at an overall incidence of 3.3 [95% confidence interval (CI), 3.1-3.4] per 100 person-years. Three large irregularly-shaped clusters of new HIV infections (relative risk = 1.6, 1.7 and 2.3) were identified in two adjacent peri-urban communities near the National Road (P = 0.001, 0.015) as well as in a rural node bordering a recent coal mine development (P = 0.020), respectively. Together the clusters had a significantly higher age-sex standardized incidence of 5.1 (95% CI, 4.7-5.6) per 100 person-years compared with a standardized incidence of 3.0 per 100 person-years (95% CI, 2.9-3.2) in the remainder of the study area. Though these clusters comprise just 6.8% of the study area, they account for one out of every four sero-conversions observed over the study period.
Conclusions: Our study has revealed clear 'corridors of transmission' in this typical rural, hyper-endemic population. Even in a severely affected rural African population, an approach that seeks to provide preventive interventions to the most vulnerable geographies could be more effective and cost-effective in reducing the overall rate of new HIV infections. There is an urgent need to develop and test such interventions as part of an overall combination prevention approach.
Figures
References
Publication types
MeSH terms
Grants and funding
LinkOut - more resources
Full Text Sources
Other Literature Sources
Medical
