. 2018 Apr 1;35(4):871-886.
doi: 10.1093/molbev/msx333.

The Gateway from Near into Remote Oceania: New Insights from Genome-Wide Data

Affiliations

The Gateway from Near into Remote Oceania: New Insights from Genome-Wide Data

Irina Pugach et al. Mol Biol Evol. .

Erratum in

Abstract

A widely accepted two-wave scenario of human settlement of Oceania involves the first out-of-Africa migration circa 50,000 years ago (ya), and the more recent Austronesian expansion, which reached the Bismarck Archipelago by 3,450 ya. Whereas earlier genetic studies provided evidence for extensive sex-biased admixture between the incoming and the indigenous populations, some archaeological, linguistic, and genetic evidence indicates a more complicated picture of settlement. To study regional variation in Oceania in more detail, we have compiled a genome-wide data set of 823 individuals from 72 populations (including 50 populations from Oceania) and over 620,000 autosomal single nucleotide polymorphisms (SNPs). We show that the initial dispersal of people from the Bismarck Archipelago into Remote Oceania occurred in a "leapfrog" fashion, completely by-passing the main chain of the Solomon Islands, and that the colonization of the Solomon Islands proceeded in a bidirectional manner. Our results also support a divergence between western and eastern Solomons, in agreement with the sharp linguistic divide known as the Tryon-Hackman line. We also report substantial post-Austronesian gene flow across the Solomons. In particular, Santa Cruz (in Remote Oceania) exhibits extraordinarily high levels of Papuan ancestry that cannot be explained by a simple bottleneck/founder event scenario. Finally, we use simulations to show that discrepancies between different methods for dating admixture likely reflect different sensitivities of the methods to multiple admixture events from the same (or similar) sources. Overall, this study points to the importance of fine-scale sampling to understand the complexities of human population history.


Figures

<sc>Fig</sc>. 1.
Fig. 1.
Results of the PC analysis showing the genetic structure captured by the first two principal components. Each colored label represents an individual, color palettes are only used to identify a general geographic location (dark green = mainland Papua New Guinea [PNG], blue = Bismarck Archipelago, purple = Bougainville, aqua = Solomon Islands, except Santa Cruz, magenta = Santa Cruz, orange = PO and Polynesia, brown = Asia).
<sc>Fig</sc>. 2.
Fig. 2.
Results of the PC analysis showing recent relatedness based on the number of IBD blocks shared between individuals. Each colored label represents an individual, colors are only used to identify a general geographic location (dark green = mainland Papua New Guinea, blue = Bismarck Archipelago, purple = Bougainville, aqua = Solomon Islands, except Santa Cruz, magenta = Santa Cruz, orange = PO and Polynesia, brown = Asia).
<sc>Fig</sc>. 3.
Fig. 3.
ADMIXTURE results for K = 5 showing the approximate location of the Oceanian populations included in this study. For reasons of space the location of aboriginal Australians and Tongans does not correspond to their true location (which can be seen in supplementary fig. S1, Supplementary Material online). The curved dotted line marks the biogeographic boundary between Near and Remote Oceania, whereas the straight broken line denotes the Tryon–Hackman linguistic divide.
<sc>Fig</sc>. 4.
Fig. 4.
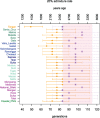
The dates of admixture inferred via the Wavelet Transform Analysis. In assigning local ancestry along individual chromosomes, we used the PNG Highlanders as a proxy for the Near Oceanian ancestry, whereas for the Austronesian ancestry we either used the Taiwan Aboriginals (the inferred admixture dates are shown in purple) or the Polynesian Outliers (the inferred dates are shown in orange). Error bars represent the 95% confidence interval. The times of admixture are expressed in either generations or years, assuming a generation time of 30 years. The chronological bounds of the Lapita period are shown as a pink band.
<sc>Fig</sc>. 5.
Fig. 5.
Performance of the ALDER and the Wavelet Transform method in recovering simulated dates of admixture. Both methods were applied to (A) ten simulated data sets with different admixture histories, but involving only a single instantaneous event of gene flow occurring 40–165 generations ago, (B) nine simulated data sets, generated using two pulses of gene flow from the same source, the more recent episode occurring 40, 60, or 90 generations ago, with the earlier episode of admixture 100, 120, or 140 generations ago. For both (A) and (B) each admixture time point was simulated ten times. The error bars denote the 95% confidence interval. While running both methods a single event of admixture was assumed. The estimates from ALDER and the WT method are slightly off-set from each other for better visibility of the results.
<sc>Fig</sc>. 6.
Fig. 6.
Dissimilarity in the pattern of sharing of IBD blocks between populations from western (A) and eastern (B) Solomons. Left panel: each data point represents the results for the comparison of the population marked with an asterisk (A: Vella Lavella; B: Makira) to each of the other populations in the data set. Data points are placed on the map according to the sampling location of each population. The size of each circle is proportional to the mean number of IBD blocks shared, and the color intensity indicates the mean length of such shared blocks. Right panel: a violin plot, which displays the cumulative distribution of all ancestry blocks, inferred by the IBD analysis for the presented population (A: Vella Lavella; B: Makira); the plot captures the total abundance of blocks of each ancestry (x axis) of different genetic lengths in cM (y axis). The insets show an excerpt from the plot summarizing results of the ADMIXTURE analysis (fig. 3) for Vella Lavella (A) and Makira (B), and the Admixture History Graph inferring the order of admixture events for Makira (B); such inference was not possible for Vella Lavella (A).
<sc>Fig</sc>. 7.
Fig. 7.
Number of IBD blocks shared within populations. The blue, orange, dark green, aqua and pink colors identify the five main components inferred in the ADMIXTURE analysis at K = 5. The colored bars indicate populations which have their own ancestry component assigned to them in at K = 5 (yellow corresponds to the sixth main component, which at K = 6 is assigned to Kove, see supplementary fig. S5B, Supplementary Material online).

References

    1. Alexander DH, Novembre J, Lange K.. 2009. Fast model-based estimation of ancestry in unrelated individuals. Genome Res 199:1655–1664.10.1101/gr.094052.109 - DOI - PMC - PubMed
    1. Bellwood P. 2004. First farmers: the origins of agricultural societies. 1st ed Malden (MA: ): Wiley-Blackwell.
    1. Bellwood P, Dizon EZ.. 2005. The Batanes archaeological project and the Out of Taiwan hypothesis for Austronesian dispersal. J Austronesian Stud 1:1–31.
    1. Bergström A, Oppenheimer SJ, Mentzer AJ, Auckland K, Robson K, Attenborough R, Alpers MP, Koki G, Pomat W, Siba P.. 2017. A Neolithic expansion, but strong genetic structure, in the independent history of New Guinea. Science 3576356:1160–1163. - PMC - PubMed
    1. Blust R. 1999. Subgrouping, circularity and extinction: some issues in Austronesian comparative linguistics. Symp Ser Inst Linguist Acad Sin 1:31–94.

Publication types

LinkOut - more resources