. 2018 Jan 3;97(1):125-138.e5.
doi: 10.1016/j.neuron.2017.12.001.

An Antimicrobial Peptide and Its Neuronal Receptor Regulate Dendrite Degeneration in Aging and Infection

Affiliations

An Antimicrobial Peptide and Its Neuronal Receptor Regulate Dendrite Degeneration in Aging and Infection

Lezi E et al. Neuron. .

Abstract

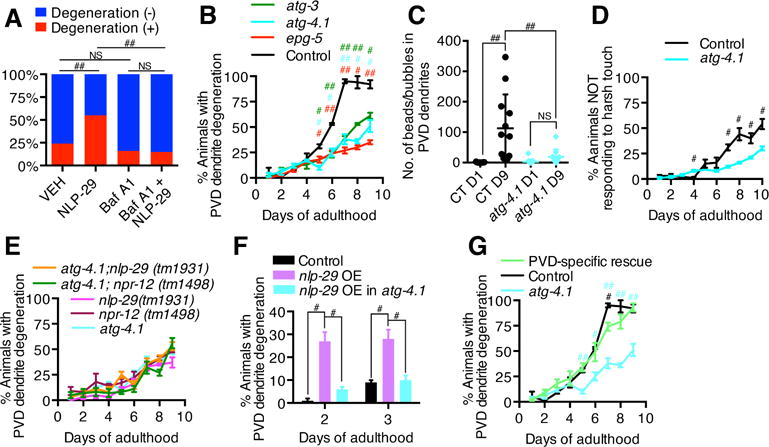
Infections have been identified as possible risk factors for aging-related neurodegenerative diseases, but it remains unclear whether infection-related immune molecules have a causative role in neurodegeneration during aging. Here, we reveal an unexpected role of an epidermally expressed antimicrobial peptide, NLP-29 (neuropeptide-like protein 29), in triggering aging-associated dendrite degeneration in C. elegans. The age-dependent increase of nlp-29 expression is regulated by the epidermal tir-1/SARM-pmk-1/p38 MAPK innate immunity pathway. We further identify an orphan G protein-coupled receptor NPR-12 (neuropeptide receptor 12) acting in neurons as a receptor for NLP-29 and demonstrate that the autophagic machinery is involved cell autonomously downstream of NPR-12 to transduce degeneration signals. Finally, we show that fungal infections cause dendrite degeneration using a similar mechanism as in aging, through NLP-29, NPR-12, and autophagy. Our findings reveal an important causative role of antimicrobial peptides, their neuronal receptors, and the autophagy pathway in aging- and infection-associated dendrite degeneration.

Keywords: AMP; G protein-coupled receptor; GPCR; aging; antimicrobial peptide; autophagy; dendrite degeneration; infection.


Conflict of interest statement

Competing financial interests

The authors declare no competing financial interests.

Figures

Figure 1
Figure 1. Characterization of aging-associated PVD dendrite degeneration
(A) Representative images of PVD dendrite degeneration in control animals (wdIs51) during aging. White arrows: PVD cell bodies. Scale bars: 50 μm. (B) Representative images of co-localization of autophagosomes (GFP∷LGG-1) and dendrite degeneration-associated bead or bubble-like structures (mCherry∷PH/membrane-bound mCherry) in the PVD neuron of control animals. A mutant form of LGG-1 (G116A) that does not have the ability to localize to autophagosomes was used as a negative control (Manil-Segalen et al., 2014). Scale bars: 10 μm. (C) Quantification of PVD dendrite degeneration and the mortality (death) rate in control animals (wdIs51). For each experiment, the percentage was calculated by the number of animals having dendrite degeneration divided by the total number of animals observed. The error bar indicates ± SEM among the three experiments performed for each time point. (D) The severity of PVD dendrite degeneration in control animals. Each dot represents an individual animal. n = 10~12. One-way ANOVA, followed by Fisher’s LSD post-hoc test. # p < 0.05, ## p < 0.001. (E) PVD function analysis in mec-4 mutants as the reference strain, and in mec-3 mutants as a positive control for NOT responding to harsh touch. Data are represented as mean ± SEM. See also Figure S1 and Figure S2.
Figure 2
Figure 2. Loss-of-function mutation of nlp-29/AMP delays the onset of aging-associated PVD dendrite degeneration
(A) Representative images of PVD neurons in control animals (wdIs51) and nlp-29 (tm1931) mutants on Day 7. Zone 2 is same as illustrated in Figure 1A. Scale bars: 50 μm. *The weak GFP signal in the intestine is gut auto-fluorescence, which is commonly observed in aged animals. (B) PVD dendrite degeneration in loss-of-function of nlp-29(tm1931) and nlp-29(yad90). Student’s t-test for each day. nlp-29(tm1931) versus control: #(pink) p < 0.05, ##(pink) p < 0.001; nlp-29(yad90) versus control: #(green) p < 0.05, ##(green) p < 0.001. (C) The severity of PVD dendrite degeneration in control and nlp-29(tm1931) animals on Day 1 and Day 9. Each dot represents an individual animal. n = 10~12. One-way ANOVA, followed by Fisher’s LSD post-hoc test. ## p < 0.001. CT, control; NS, not significant. (D) PVD function analysis in mec-4 (labeled as control) and nlp-29(tm1931);mec-4 (labeled as nlp-29). Student’s t-test, #p < 0.05 for nlp-29 versus control animals for each day. (E) PVD dendrite degeneration in nlp-29(tm1931) and rescue transgenic strains. Epidermis-specific rescue was performed using the col-19 promoter. Student’s t-test was used to determine the difference between nlp-29(tm1931) and each rescue strain, for each day. Pcol-19∷nlp-29 rescue versus nlp-29(tm1931): #(orange)p < 0.05; Pnlp-29∷nlp-29 rescue versus nlp-29(tm1931): #(blue)p < 0.05, ##(blue)p < 0.001. Data are represented as mean ± SEM. Non-significant comparisons are not indicated in the figure. See also Figure S1, Figure S2, Figure S3 and Figure S4.
Figure 3
Figure 3. NLP-29/AMP non-cell autonomously triggers aging-associated PVD dendrite degeneration
(A) Microinjection of synthetic NLP-29 peptide and NLP-31 peptide into control animals (wdIs51). Injection was performed at age of Day 1, and the PVD dendrite degeneration phenotype was examined 24 hours post injection. Fisher’s exact test, #p < 0.05, ##p < 0.001. VEH, vehicle, 50 % v/v DMSO in M9 buffer. VEH: n = 146; 10 μm NLP-29: n = 66; 100 μm NLP-29: n = 64; 100 μm NLP-31: n = 68; where n indicates the number of animals. (B) Quantification of PVD dendrite degeneration induced by epidermal nlp-29 overexpression (OE), driven by the col-19 promoter, in young control animals. Student’s t-test, #p < 0.05. (C) Age-dependent changes of nlp-29 mRNA level in control animals. act-2, ama-1 and cdc-42 were used as reference genes. Mean differences between different age groups were analyzed by one-way ANOVA for each reference gene, followed by Fisher’s LSD post-hoc test. # p < 0.05, ## p < 0.001 for versus Day 1. (D) Western blot results of Pnlp-29∷NLP-29∷GFP expression in control animals over the course of aging. See two more repeats in Figure S3D. (E) Age-dependent changes of Pnlp-29∷GFP induction in control animals [frIs7 (Pnlp-29∷GFP; Pcol-12∷dsRed)] grown on live OP50 or heat-killed OP50. Pcol-12 is an epidermis-specific promoter. A representative image of frIs7 under 10X magnification is shown. Red arrow: an animal without Pnlp-29∷GFP induction (appears red or orange); yellow and green arrow: animals with Pnlp-29∷GFP induction (appear yellow, yellow-green, or green). Student’s t test showed no differences between the live OP50 condition and heat-killed OP50 condition at any time point. (F) Age-dependent changes of Pnlp-29∷GFP induction in control animals (frIs7) grown on NGM plates supplemented with anti-fungal drugs (either 10 μg/mL nystatin or amphotericin B 1.6 μg/mL). Student’s t test showed no differences between drug (−) condition and each drug (+) condition at any time point. (G) PVD dendrite degeneration rate of control animals (wdIs51) grown on live OP50 or heat-killed OP50. Student’s t test showed no differences between the two conditions at any time point. (H) PVD dendrite degeneration rate of control animals (wdIs51) grown on NGM plates supplemented with anti-fungal drugs (either 10 μg/mL nystatin or amphotericin B 1.6 μg/mL). Student’s t test showed no differences between drug (−) condition and each drug (+) condition at any time point. Data are represented as mean ± SEM. Non-significant comparisons are not indicated in the figure. See also Figure S3 and Figure S4.
Figure 4
Figure 4. NLP-29 regulates PVD dendrite degeneration through activating NPR-12/neuronal GPCR
(A) PVD dendrite degeneration in npr-12(tm1498) and npr-12(gk754958) mutants. One-way ANOVA, followed by Fisher’s LSD post-hoc test, was used to detect the differences between each npr-12 strain, control and nlp-29(tm1931), for each day. npr-12(tm1498) versus control: †(black) p < 0.05, ††(black) p < 0.001. npr-12(tm1498) versus nlp-29: †(pink) p < 0.05. npr-12(gk754958) versus control: #(black) p < 0.05, ##(black) p < 0.001. npr-12(gk754958) versus nlp-29: #(pink) p < 0.05. (B) The severity of PVD dendrite degeneration in control and npr-12(tm1498) animals on Day 1 and Day 9. Each dot represents an individual animal. n = 10~12. One-way ANOVA, followed by Fisher’s LSD post-hoc test. ## p < 0.001. CT, control; NS, not significant. (C) PVD function analysis in mec-4 (labeled as control) and npr-12;mec-4 (labeled as npr-12). Student’s t test, # p < 0.05 for control versus npr-12 for each day. (D) PVD dendrite degeneration in npr-12(tm1498), all-tissue as well as PVD-specific rescue strains. The dpy-30 promoter and ser-2(3) promoter were used to express npr-12 cDNA in all tissues and PVD, respectively. One-way ANOVA, followed by Fisher’s LSD post-hoc, was used to determine the difference between npr-12 and both rescue strains. PVD-specific rescue versus npr-12: # p < 0.05, ## p < 0.001. All-tissue rescue versus npr-12: † p < 0.05, †† p < 0.001. No differences were detected between all-tissue and PVD-specific rescues strains at any time point. (E) PVD dendrite degeneration in nlp-29;npr-12 double mutants. One-way ANOVA showed no differences between nlp-29;npr-12, nlp-29 single mutants, and npr-12 single mutants at any time point. (F) PVD dendrite degeneration in control (wdIs51) and npr-12(tm1498) animals microinjected with 100 μM synthetic NLP-29 peptide. Injection was performed at age of Day 1, and PVD dendrite degeneration was examined 24 hours post injection. Control animals: DMSO group: n = 146; NLP-29 group: n = 64. npr-12 mutants: DMSO group: n = 46; NLP-29 group: n = 65; where n indicates the number of animals. Fisher’s exact test, # p < 0.05; NS, not significant; VEH, vehicle; 29, NLP-29 peptide. (G) PVD dendrite degeneration induced by nlp-29 overexpression (OE) in npr-12(tm1498) mutants. The col-19 promoter was used to drive nlp-29 OE in the epidermis. One-way ANOVA, followed by Fisher’s LSD post-hoc test, was used to detect the differences between groups on each day. # p < 0.05. (H) Live-cell surface staining of HEK293T cells co-transfected with GFP and N-terminal FLAG-tagged NPR-12. Cells were stained with anti-FLAG antibody. Scale bars = 50 μm. (I) Calcium imaging of HEK293T cells transfected with NPR-12 or NPR-32. Representative calcium responses during the first 120 sec after stimulating with DMSO, 10 μM NLP-29, or 10 μM NLP-31 are shown. The responses were calculated as the change in fluorescence (ΔF) over the initial fluorescence (F0). The bar beneath the trace indicates the time period when the stimulus was being applied. All traces from all dishes are shown in Figure S6. (J) The area under the curve (AUC) of ΔF/F0 intensity was used to show the calcium response of individual cells to each stimulus. ΔF/F0 intensity within the first 120 sec after stimulus application was included for quantification. Data was analyzed by one-way ANOVA, followed by Fisher’s LSD post-hoc test. ## p < 0.001, NS, not significant. NPR-12:NLP-29, n = 593; NPR-12:DMSO, n = 396; NPR-12:NLP-31, n = 97; NPR-32:NLP-29, n = 152; NPR-32:DMSO, n = 152; where n indicates the number of cells. Data are represented as mean ± SEM. Non-significant comparisons are not indicated in the figure. See also Figure S1, Figure S2, Figure S5 and Figure S6.
Figure 5
Figure 5. Autophagy machinery acts downstream of NPR-12/neuronal GPCR
(A) PVD dendrite degeneration in control animals (wdIs51) microinjected with 100 μM NLP-29 peptide and 50 μM bafilomycin A1 (Baf A1), an autophagy inhibitor. Injection was performed at age of Day 1, and PVD dendrite degeneration phenotype was examined 24 hours post injection. Fisher’s exact test, ##p < 0.001. VEH, vehicle, 50 % v/v DMSO in M9 buffer; NS, not significant. VEH: n = 146; NLP-29: n = 64; Baf A1: n = 123; Baf A1 + NLP-29: n = 117; where n indicates the number of animals. (B) PVD dendrite degeneration in mutants of autophagy-related genes, atg-3, atg-4.1 and epg-5. Student’s t-test was used to detect the differences between each mutant and control animals. atg-3 versus control: #(green) p < 0.05, ##(green) p < 0.001. atg-4.1 versus control: #(blue) p < 0.05, ##(blue) p < 0.001. epg-5 versus control: #(red) p < 0.05, ##(red) p < 0.001. (C) The severity of PVD dendrite degeneration in control and atg-4.1(lf) animals on Day 1 and Day 9. Each dot represents an individual animal. n = 10~12. One-way ANOVA, followed by Fisher’s LSD post-hoc test. ## p < 0.001. CT, control; NS, not significant. (D) PVD function analysis in mec-4 (labeled as control) and atg-4.1;mec-4 (labeled as atg-4.1). Student’s t test, # p < 0.05 for control versus atg-4.1 for each day. (E) PVD dendrite degeneration in atg-4.1;nlp-29(tm1931) and atg-4.1;npr-12(tm1498). One-way ANOVA showed no differences between atg-4.1;npr-12, atg-4.1;nlp-29, nlp-29 single mutants, and npr-12 single mutants, at any time point. (F) PVD dendrite degeneration induced by nlp-29 overexpression (OE) in control and atg-4.1 mutants. The col-19 promoter was used to drive nlp-29 OE in the epidermis. One-way ANOVA, followed by Fisher’s LSD post-hoc test, for each day. # p < 0.05. (G) PVD dendrite degeneration in atg-4.1 mutants and PVD-specific rescue strain. The ser-2(3) promoter was used to express atg-4.1 cDNA in PVD neurons. One-way ANOVA, followed by Fisher’s LSD post-hoc, for each day. PVD-specific rescue versus control: #(black) p < 0.05. PVD-specific rescue versus atg-4.1: #(blue) p < 0.05, ##(blue) p < 0.001. Data are represented as mean ± SEM. Non-significant comparisons are not indicated in the figure. See also Figure S1, Figure S2 and Figure S3.
Figure 6
Figure 6. NLP-29 and NPR-12 regulate dendrite degeneration in other C. elegans and mammalian neurons
(A) Representative images of FLP dendrite degeneration in control animals [yadEx650 (Pmec-3∷GFP)], nlp-29(lf) (tm1931;yadEx650), and npr-12(lf) (tm1498;yadEx650) during aging. White arrows: typical bead or bubble-like structures. Scale bars: 50 μm. CT, control. (B) FLP dendrite degeneration in control, nlp-29(tm1931), npr-12(tm1498) and transgenic rescue strains. The col-19 promoter was used for epidermis-specific rescue of nlp-29, and the mec-7 promoter was used for cell-autonomous rescue of npr-12. Data were analyzed by one-way ANOVA, followed by Fisher’s LSD post-hoc test, for each day. # p < 0.05. No difference was detected between nlp-29 and npr-12 mutants at any time point. (C) Representative images of degeneration of PLM sensory processes/dendrites in control animals [zdIs5 (Pmec-4∷GFP), CT] during aging. White arrows: typical bead or bubble-like structures. Scale bars: 20 μm. (D) Degeneration of PLM sensory processes/dendrites in control animals, animals with ectopic expression of npr-12 in PLM neurons driven by the mec-7 promoter (Pmec-7∷npr-12), and nlp-29(tm1931);Pmec-7∷npr-12. Data were analyzed by one-way ANOVA, followed by Fisher’s LSD post-hoc test, for each day. # p < 0.05, ## p < 0.001. (E) Rat cortical neurons expressing NPR-12∷2A∷GFP were either treated with 10 μM NLP-31 (control) or 10 μM NLP-29 peptides. Representative images are shown in the left panels. Scale bar = 10 μm. Sholl analysis of neurite complexity and continuity demonstrates that cortical neurons expressing NPR-12 treated with NLP-29 had significant degenerative dendritic morphology compared with NLP-31 treated neurons (n = 15 cells/condition). ANCOVA: p < 0.001. (F) Rat cortical neurons expressing GFP only were either treated with 10 μM NLP-31 (control) or 10 μM NLP-29 peptides. Representative images are shown in the left panels. Scale bar = 10 μm. Sholl analysis demonstrates that no significant difference was found in dendritic morphology between NLP-29 and NLP-31 treatment in the absence of NPR-12. (n = 15 cells/condition). ANCOVA: p > 0.05. (G–H) Rat cortical neurons expressing NPR-12∷2A∷GFP (G) or GFP only (H) were either treated with 10 μM NLP-29 peptides only or 10 μM NLP-29 peptides + 10 nM bafilomycin A1 (Baf A1). Sholl analysis of neurite complexity and continuity demonstrates that the autophagy inhibitor Baf A1 significantly suppressed the changes of dendritic morphology that were induced by NLP-29 treatment in NPR-12-expressing neurons. n = 26~29 cells/condition). ANCOVA was used to detect differences between NLP-29 and NLP-29 + Baf A1. Data are represented as mean ± SEM. Non-significant comparisons are not indicated in the figure. See also Figure S5 and Figure S6.
Figure 7
Figure 7. Fungal infection induces dendrite degeneration via NLP-29 and NPR-12
Animals were either treated with Drechmeria coniospora or vehicle solution (NaCl 50 mM), and were quantified for dendrite degeneration after 36-hour incubation in the pathogen or vehicle. The mean differences between each strain under different treatment conditions were analyzed by one-way ANOVA, followed by Fisher’s LSD post-hoc test. (A) Effects of infection on PVD dendrite degeneration; animals were treated on Day 1. (B) Effects of infection on PVD dendrite degeneration; animals were treated on Day 3. (C) Effects of infection on FLP dendrite degeneration; animals were treated on Day 1. (D) Effects of infection on degeneration of PLM dendrite/sensory processes; animals were treated on Day 1; ectopic expression of npr-12 in PLM neurons was driven by the mec-7 promoter (Pmec-7∷npr-12). # p < 0.05, ## p < 0.001. Data are represented as mean ± SEM. Non-significant comparisons are not indicated in the figure. See also Figure S7.

Similar articles

Cited by

References

    1. Adalbert R, Coleman MP. Review: Axon pathology in age-related neurodegenerative disorders. Neuropathol Appl Neurobiol. 2013;39:90–108. - PubMed
    1. Albeg A, Smith CJ, Chatzigeorgiou M, Feitelson DG, Hall DH, Schafer WR, Miller DM, 3rd, Treinin M. C. elegans multi-dendritic sensory neurons: morphology and function. Mol Cell Neurosci. 2011;46:308–317. - PMC - PubMed
    1. Apfeld J, Kenyon C. Cell nonautonomy of C. elegans daf-2 function in the regulation of diapause and life span. Cell. 1998;95:199–210. - PubMed
    1. Boulanger LM. Immune proteins in brain development and synaptic plasticity. Neuron. 2009;64:93–109. - PubMed
    1. Brenner S. The genetics of Caenorhabditis elegans. Genetics. 1974;77:71–94. - PMC - PubMed

Publication types

Substances