. 2018 Jan 3;7(1):3.
doi: 10.3390/cells7010003.

Reagent Tracker Dyes Permit Quality Control for Verifying Plating Accuracy in ELISPOT Tests

Affiliations

Reagent Tracker Dyes Permit Quality Control for Verifying Plating Accuracy in ELISPOT Tests

Alexander Lehmann et al. Cells. .

Abstract

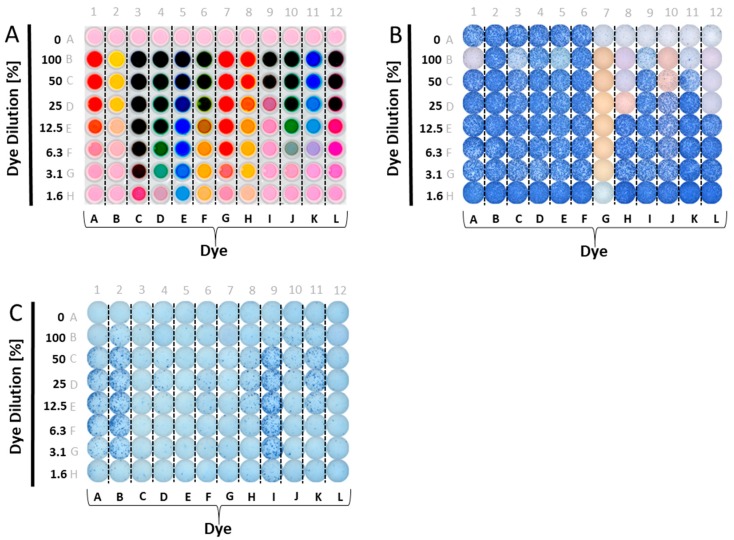
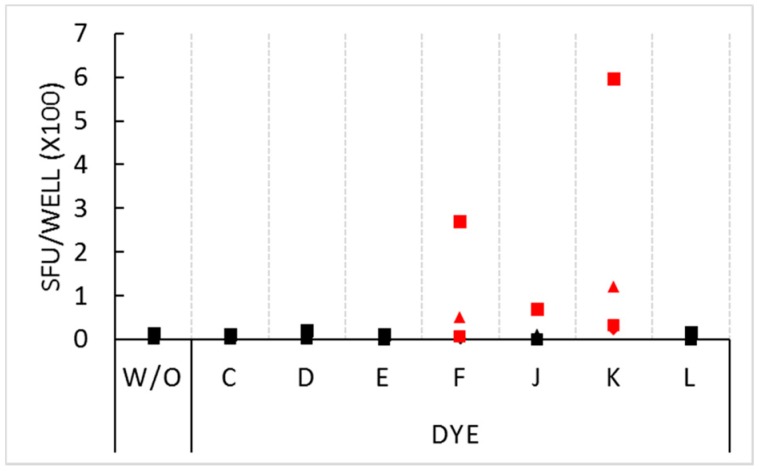
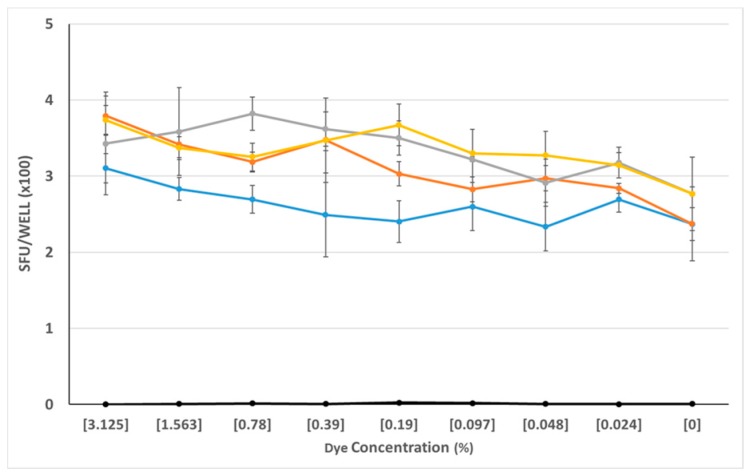
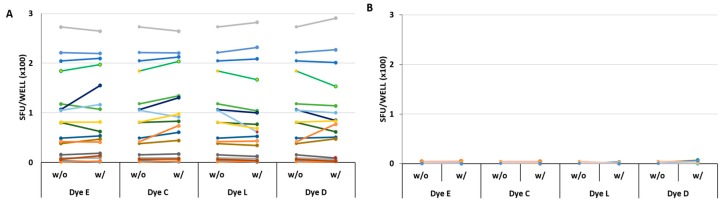
ELISPOT assays enable the detection of the frequency of antigen-specific T cells in the blood by measuring the secretion of cytokines, or combinations of cytokines, in response to antigenic challenges of a defined population of PBMC. As such, these assays are suited to establish the magnitude and quality of T cell immunity in infectious, allergic, autoimmune and transplant settings, as well as for measurements of anti-tumor immunity. The simplicity, robustness, cost-effectiveness and scalability of ELISPOT renders it suitable for regulated immune monitoring. In response to the regulatory requirements of clinical and pre-clinical immune monitoring trials, tamper-proof audit trails have been introduced to all steps of ELISPOT analysis: from capturing the raw images of assay wells and counting of spots, to all subsequent quality control steps involved in count verification. A major shortcoming of ELISPOT and other related cellular assays is presently the lack of audit trails for the wet laboratory part of the assay, in particular, the assurance that no pipetting errors have occurred during the plating of antigens and cells. Here, we introduce a dye-based reagent tracking platform that fills this gap, thereby increasing the transparency and documentation of ELISPOT test results.

Keywords: CD4 cells; CD8 cells; ImmunoSpot®; RT dyes; T cells; antigen screening; audit trails for ELISPOT; determinant mapping; regulated ELISPOT.


Conflict of interest statement

P.V.L. is Founder, President and CEO of CTL, a company that specializes in immune monitoring by ELISPOT. All other authors are employees of CTL.

Figures

Figure 1
Figure 1
Testing candidate reagent tracker dyes for their interference with ELISPOT test results. (A) Candidate reagent tracker dyes were admixed to phenol red-containing test medium in the concentrations specified on the Y axis—a different dye for each column, as specified on the X-axis. Row A contains CEF-7 (wells A1-A6) or test medium alone (wells A7-A12). Each well contained 200 μL. A top-lit photograph of the experimental plate is shown. (B) The scanned well image of an ELISPOT plate is shown in which CEF 7 peptide-induced IFN-γ production by a single PBMC donor was measured. In row A, the PBMC were tested without the dyes present; wells A1–A6 are replicates containing the CEF-7 peptide at 1 μg/mL, and wells A7–12 are replicates for the medium control, with PBMC in medium alone. In all other wells CEF-7 peptide was present at 1 μg/mL, along with the dyes at the concentrations specified in the layout shown in (A); (C) The scanned image of an ELISPOT plate is shown in which IFN-γ production by a single donor was measured in the absence of antigen added; the PBMC were exposed only to the specified dyes or medium. In row A, in 12 replicate wells, PBMC were tested in medium alone, without the dyes present. In all other wells, the specified dyes were admixed to medium in the concentrations specified in the dye layout shown in (A). Note the occasional differential membrane staining in B vs. C: the staining seen at high dye concentrations with ethanol pre-wetting (B) was not seen without pre-wetting (C).
Figure 2
Figure 2
Stimulatory effect of select dyes at 1.5% concentration. PBMC of four donors, distinguished by four symbols, were plated at 3 × 10⁵ cells per well in medium alone (without inclusion of dyes or antigen, W/O), or with the dyes specified on the X axis (also without antigen added). Each condition was tested in three replicate wells with the mean spot count shown on the Y axis. SFU counts that exceeded the threshold for statistical significance (p < 0.01) by the Student’s t-test are represented with red symbols.
Figure 3
Figure 3
Neutral effect of the four finalist dyes over a wide concentration range. PBMC of a CEF-7 reactive donor were tested in an IFN-γ ELISPOT assay for CEF-7—induced production of the cytokine vs. spot formation in the medium control. The test was done in the absence of added dye (0% dye concentration), or in the presence of the specified concentrations of dyes C, D, E, and L, distinguished by colors. (The grey line is dye C, dye E is in yellow, dye D is orange, and dye L is represented by the blue line.) SFU counts in all medium control wells—in the presence or absence of dye—were less than 10/well and are seen as the black symbols overlaying the X axis. The data shown have been obtained from a single donor, and is representative of three additional donors tested.
Figure 4
Figure 4
Verifying the four finalist dyes’ lack of inhibitory or stimulatory effect. (A) The CMVgr2 antigen response in PBMC from 17 donors. The PBMC of 17 donors are distinguished by colors. The PBMC were tested in the absence (w/o) or in the presence (w/) of the specified dyes present at 0.39%, 0.39%, 0.09% and 1.56% for dyes C, D, E, and L, respectively. The corresponding SFU counts, representing means of triplicate wells, are connected by a line. None of these data pairs reached statistically significant difference: the p-values for comparing the donor groups tested with or without dyes were 0.89, 0.82, 0.87 and 0.96 for dyes E, C, L and D respectively; (B) The medium control results for all 17 donors in the presence or absence of the four dyes. No statistically significant differences were seen: the p-values for comparing the donor groups tested with or without dyes were 0.43, 0.22, 0.05 and 0.07 for dyes E, C, L and D respectively.
Figure 5
Figure 5
Visual quality control for plating of antigen. (A) The plate layout for an experiment is shown in which 47 antigens are to be tested on a plate, each in duplicate wells. The four selected reagent tracker dyes have been assigned to the antigens in a revolving order, as shown by the four background colors assigned to the data fields. Wells A1 and A2 are the negative controls, with cells in phenol red containing medium only, without antigen/RT dye added; (B) A back-lit photograph of the ELISPOT plate is shown after the RT-dye-labelled antigens have been plated. The finalist dye concentrations were used, 0.39%, 0.39%, 0.09% and 1.56% for dyes C, D, E, and L, respectively in phenol red free medium.

References

    1. Lehmann P.V., Zhang W. Unique strengths of ELISPOT for T cell diagnostics. Methods Mol. Biol. 2012;792:3–23. - PubMed
    1. Hesse M.D., Karulin A.Y., Boehm B.O., Lehmann P.V., Tary-Lehmann M. A T cell clone’s avidity is a function of its activation state. J. Immunol. 2001;167:1353–1361. doi: 10.4049/jimmunol.167.3.1353. - DOI - PubMed
    1. Hanson J., Sundararaman S., Caspell R., Karacsony E., Karulin A.Y., Lehmann P.V. ELISPOT assays in 384-well format: Up to 30 data points with one million cells. Cells. 2015;4:71–83. doi: 10.3390/cells4010071. - DOI - PMC - PubMed
    1. Duechting A., Przybyla A., Kuerten S., Lehmann P.V. Delayed activation kinetics of th2- and th17 cells compared to th1 cells. Cells. 2017;6:29. doi: 10.3390/cells6030029. - DOI - PMC - PubMed
    1. Wherry E.J., Teichgraber V., Becker T.C., Masopust D., Kaech S.M., Antia R., von Andrian U.H., Ahmed R. Lineage relationship and protective immunity of memory CD8 T cell subsets. Nat. Immunol. 2003;4:225–234. doi: 10.1038/ni889. - DOI - PubMed

LinkOut - more resources