. 2018 Apr 1;24(7):1574-1585.
doi: 10.1158/1078-0432.CCR-17-2057. Epub 2018 Jan 4.

Thy1-Targeted Microbubbles for Ultrasound Molecular Imaging of Pancreatic Ductal Adenocarcinoma

Affiliations

Thy1-Targeted Microbubbles for Ultrasound Molecular Imaging of Pancreatic Ductal Adenocarcinoma

Lotfi Abou-Elkacem et al. Clin Cancer Res. .

Abstract

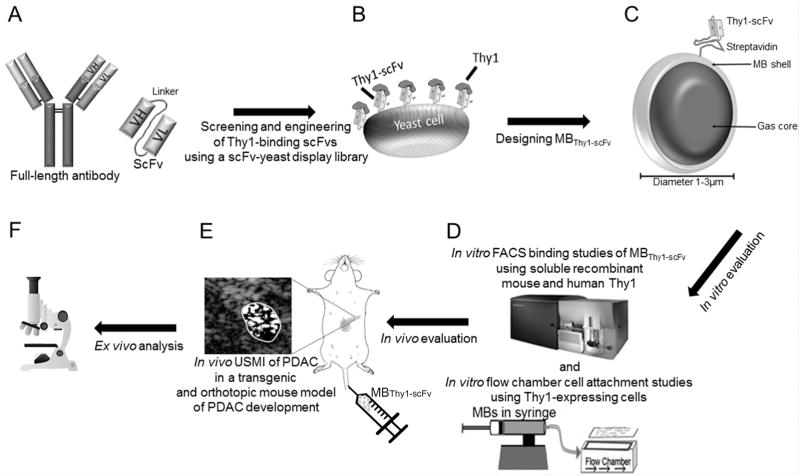
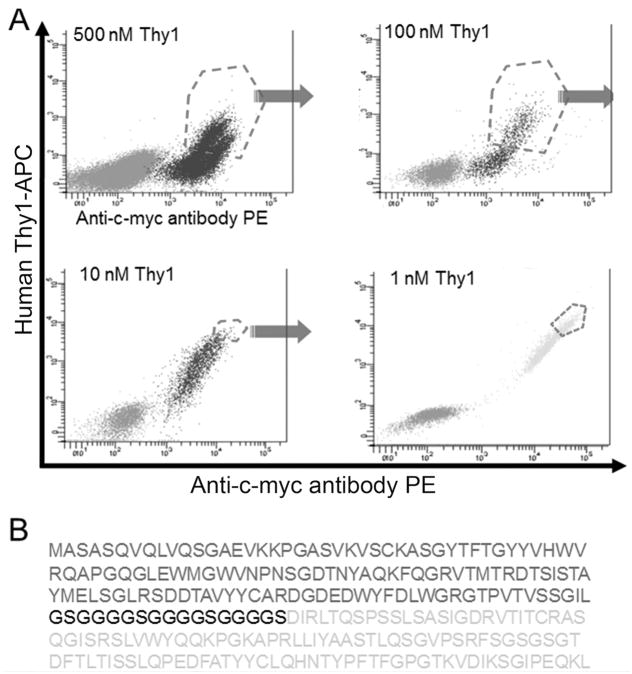
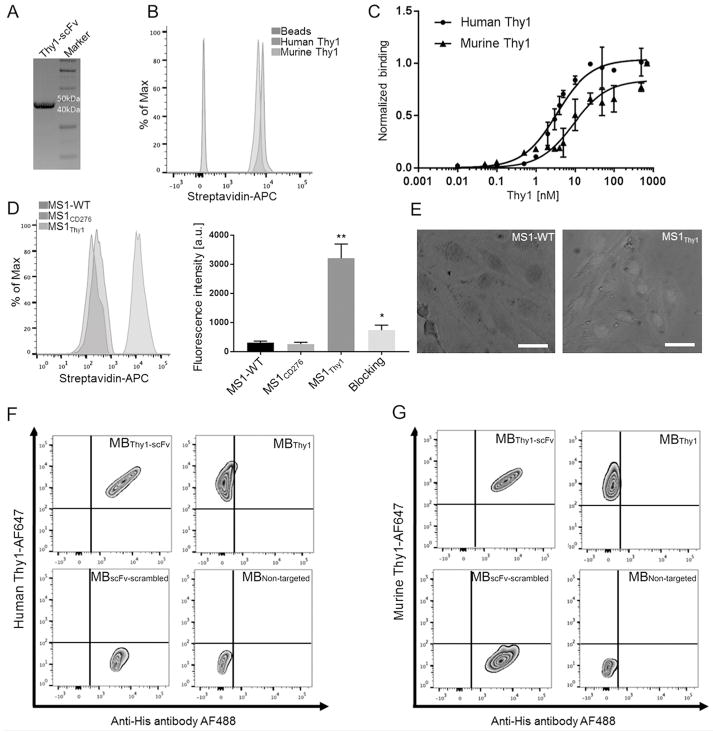
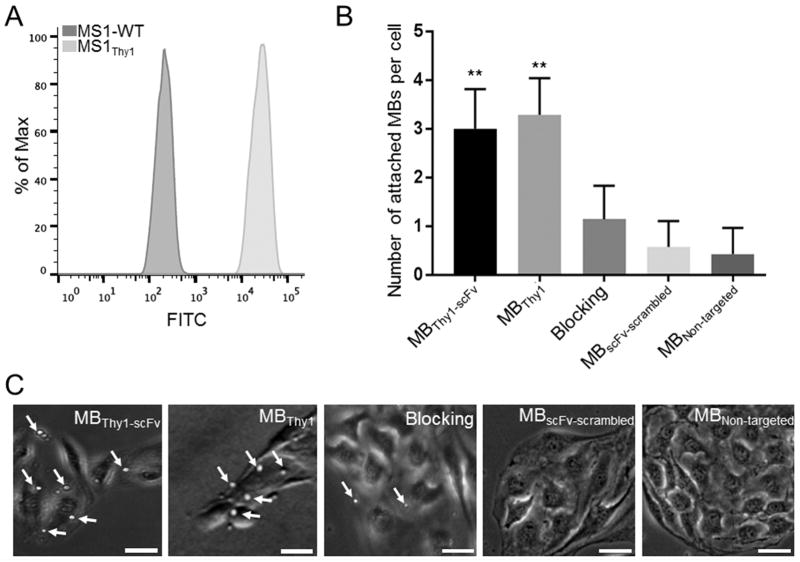
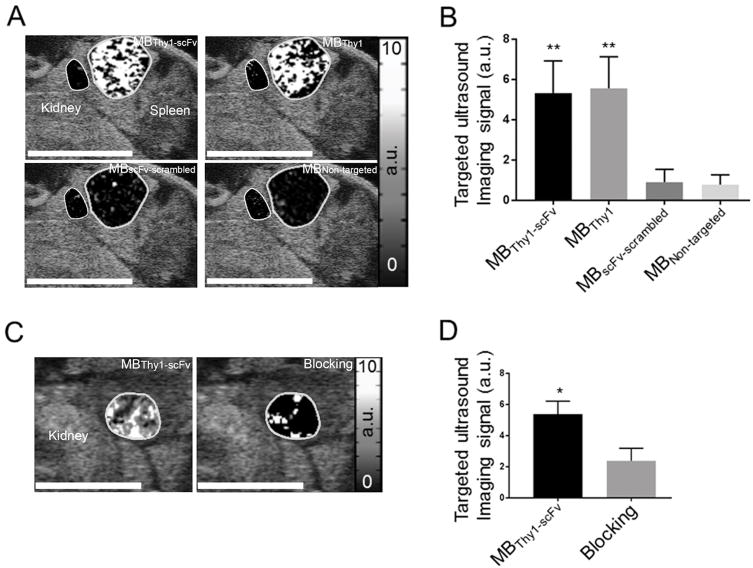
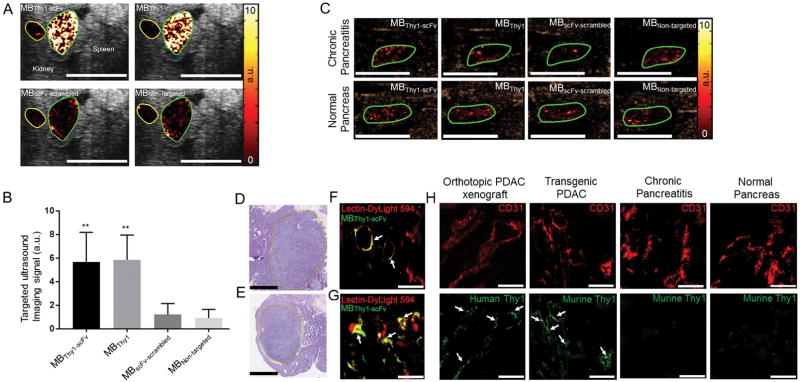
Purpose: To engineer a dual human and murine Thy1-binding single-chain-antibody ligand (Thy1-scFv) for contrast microbubble-enhanced ultrasound molecular imaging of pancreatic ductal adenocarcinoma (PDAC).Experimental Design: Thy1-scFv were engineered using yeast-surface-display techniques. Binding to soluble human and murine Thy1 and to Thy1-expressing cells was assessed by flow cytometry. Thy1-scFv was then attached to gas-filled microbubbles to create MBThy1-scFv Thy1 binding of MBThy1-scFv to Thy1-expressing cells was evaluated under flow shear stress conditions in flow-chamber experiments. MBscFv-scrambled and MBNon-targeted were used as negative controls. All microbubble types were tested in both orthotopic human PDAC xenografts and transgenic PDAC mice in vivoResults: Thy1-scFv had a KD of 3.4 ± 0.36 nmol/L for human and 9.2 ± 1.7 nmol/L for murine Thy1 and showed binding to both soluble and cellularly expressed Thy1. MBThy1-scFv was attached to Thy1 with high affinity compared with negative control microbubbles (P < 0.01) as assessed by flow cytometry. Similarly, flow-chamber studies showed significantly (P < 0.01) higher binding of MBThy1-scFv (3.0 ± 0.81 MB/cell) to Thy1-expressing cells than MBscFv-scrambled (0.57 ± 0.53) and MBNon-targeted (0.43 ± 0.53). In vivo ultrasound molecular imaging using MBThy1-scFv demonstrated significantly higher signal (P < 0.01) in both orthotopic (5.32 ± 1.59 a.u.) and transgenic PDAC (5.68 ± 2.5 a.u.) mice compared with chronic pancreatitis (0.84 ± 0.6 a.u.) and normal pancreas (0.67 ± 0.71 a.u.). Ex vivo immunofluorescence confirmed significantly (P < 0.01) increased Thy1 expression in PDAC compared with chronic pancreatitis and normal pancreas tissue.Conclusions: A dual human and murine Thy1-binding scFv was designed to generate contrast microbubbles to allow PDAC detection with ultrasound. Clin Cancer Res; 24(7); 1574-85. ©2018 AACR.


Conflict of interest statement

Conflict of interest statement: The authors declare no conflicts of interest.

Figures

Figure 1
Figure 1
Schematic drawing of overall study design. A, shows a single-chain Fv fragment (scFv) compared to a full-length antibody. B, Thy1-scFv ligand to both human and murine Thy1 was engineered using a naïve nonimmune human scFv-yeast surface display library. C, Thy1-targeted contrast microbubbles (MBThy1-scFv) were generated by attaching biotinylated Thy1-scFv on the surface of streptavidin-containing microbubbles. D, MBThy1-scFv were tested for Thy1 binding both in vitro and on live cells in flow chamber experiments, as well as E, in vivo in two mouse models. F, Thy1 expression on the neovasculature of both mouse models was confirmed by ex vivo quantitative immunofluorescence.
Figure 2
Figure 2
Screening of Thy1-binding scFv in a naïve nonimmune human scFv yeast surface display library. A, FACS profiles of the original naïve human scFv yeast surface display library (left) using 500nM Thy1 protein. After seven rounds of iterations, selections and affinity maturations, the final isolated yeast clones showed higher affinity for Thy1 than those obtained from the original yeast library (500nM) and sub-clones after initial error-prone polymerase chain reaction (100nM, 10nM). A dominant clone (1nM, right panel) with high binding affinity to human Thy1 was identified and sorted by FACS. B, Amino acid sequence of the isolated Thy1-scFv. The engineered Thy1-scFv consists of variable regions of heavy (N-terminal) and light (C-terminal) chains, which are joined together by a flexible peptide linker (black).
Figure 3
Figure 3
Purification and characterization of Thy1-scFv. A, His-Trap FPLC-purified Thy1-scFv (MW 44kDa) was analyzed by SDS-PAGE under reducing conditions followed by Coomassie blue staining. B, Binding of Thy1-scFv to human and murine Thy1-coated beads. As a negative control, naked streptavidin-beads and beads coated with biotinylated human IgG (beads, left) were used. Note, only Thy1-scFv bound to human and murine Thy1-coated beads (human and murine Thy1, right). C, Affinity measurement of Thy1-scFv to human Thy1 protein using FACS showing a KD of 3.4 ± 0.36 nM (human Thy1) and 9.2 ± 1.7 nM (murine Thy1). Data were normalized with respect to saturated fluorescence intensity (plateau) observed at the highest target concentrations. D, Measurement of Thy1-scFv binding to cells using FACS. Thy1-scFv showed binding to MS1Thy1, whereas no binding to Thy1-negative cells (MS1-WT and MS1CD276) cells could be detected. Thy1-expression on MS1 cells was confirmed with significantly increased fluorescence intensity (**, P < 0.01) compared to Thy1-negative cells and significant decreased fluorescence after blocking the receptors (*, P < 0.01). E, Representative fluorescence microscopy images of cells stained with Thy1-scFv (MS1Thy1, right), further confirming specific binding of Thy1-scFv ligand to MS1Thy1 cells. Cell nuclei were stained with 4′,6-diamidino-2-phenylindole (DAPI). Scale bar = 20 μm. All results are representatives of at least three independent experiments. F, G, In vitro binding specificity study of MBThy1-scFv. Binding specificity of MBThy1-scFv and MBThy1 with fluorescent soluble human (F) and murine (G) Thy1 was analyzed using FACS. MBThy1-scFv and MBscFv-scrambled showed an enhanced geometric mean fluorescence intensity which indicates the presence of an anti-His-AF488-antibody binding to scFv-coated microbubbles. A clear correlation between MBThy1-scFv to the soluble AF647-labeled Thy1 demonstrated a specific binding of Thy1-scFv. As a positive control, MBThy1 showed enhanced geometric mean fluorescence intensity towards AF647-labeled Thy1 (A and B). As a negative control, MBscFv-scrambled and MBNon-targeted showed no binding to human (A) and murine (B) Thy1. The cut-off (quad gate bar) was defined based on the background geometric mean fluorescence intensity of MBNon-targeted and MBscFv-scrambled.
Figure 4
Figure 4
Flow chamber cell attachment studies on live cells using four types of microbubbles (MBs). A, Thy1 overexpression on MS1Thy1 compared to MS1-WT cells was confirmed by FACS. B, Bar graph summarizes quantitative flow chamber cell culture data using the four types of contrast microbubbles as well as results after blocking Thy1. Error bar = standard deviation; **, P < 0.01 compared to control conditions. C, Representative photomicrographs from flow chamber cell culture experiments with Thy1-expressing MS1 cells exposed to MBThy1-scFv, MBThy1, MBscFv-scrambled, and MBNon-targeted along with blocking experiments confirm binding of MBThy1-scFv and positive control MBThy1 to Thy1 under flow shear stress conditions. Microbubbles (arrows) are visualized as white spherical dots. Scale bar = 10 μm.
Figure 5
Figure 5
In vivo ultrasound molecular imaging in orthotopic human PDAC xenograft tumor model in mice. A, Representative transverse contrast mode ultrasound images overlaid on B-mode images show strong signal in PDAC (region of interest, right) after injection of both MBThy1-scFv and positive control MBThy1, but only background signal following injection of the two negative control microbubbles (MBscFv-scrambled and MBNon-targeted). Only background signal was noted in adjacent normal pancreas after injection of all microbubble types (left region of interest was drawn to quantify imaging signal in adjacent non-PDAC pancreatic tissue). Note, spleen and kidney are marked on B-mode images for anatomical guidance. B, Bar graph summarizes quantitative in vivo imaging data using the various types of contrast microbubbles. Error bar = standard deviation; **, P < 0.01. C, D, Representative in vivo ultrasound imaging examples of an orthotopic human PDAC xenograft scanned before and after intravenous administration of free blocking Thy1-scFv. Scale bar = 5 mm; color coded scale is shown for ultrasound molecular imaging signal in arbitrary units (a.u.). D, Bar graph summarizes quantitative results from in vivo blocking experiments. Error bar = standard deviation; *, P < 0.05.
Figure 6
Figure 6
In vivo ultrasound molecular imaging of PDAC in transgenic mice, a chronic pancreatitis model, and in normal pancreas tissues. A, Representative transverse contrast mode ultrasound images overlaid on B-mode images show strong signal in PDAC (green region of interest) after injection of MBThy1-scFv and MBThy1, but only background signal following injection of the two types of control microbubbles (MBscFv-scrambled and MBNon-targeted). Only background signal was noted in adjacent normal pancreas after injection of all microbubble types (a yellow region of interest was drawn to quantify imaging signal in adjacent non-PDAC pancreatic tissue). B, Bar graph summarizes quantitative in vivo imaging data sets using the various types of contrast microbubbles. Error bar = standard deviation; **, P < 0.01. C, Representative transverse contrast mode ultrasound images show only background imaging signal in chronic pancreatitis and normal pancreas tissue after injection of all four types of microbubbles; scale bar = 5 mm; color coded scale is shown for ultrasound molecular imaging in arbitrary units (a.u.). D and E, Corresponding hematoxylin-eosin-stained sample (original magnification, ×10) confirms presence of PDAC in orthotopic human xenograft (D) and transgenic mouse model (E) imaged in Figure 5A and Fig 6A, respectively. Scale bar = 1 mm. F and G, Micrographs show accumulation and co-localization (white arrows) of fluorescently labeled MBThy1-scFv (green) within the neovasculature (red) of PDAC in orthotopic human xenograft (F) and transgenic mouse (G). Scale bar = 100 μm. H, Representative immunofluorescence staining micrographs for CD31 and Thy1 in human PDAC xenografts, transgenic PDAC, chronic pancreatitis, and normal pancreas tissue. PDAC showed strong expression of Thy1 on the vasculature (co-localization of Thy1 (green) on CD31-stained (red) tumor vessels) compared to chronic pancreatitis and normal pancreas tissue. Scale bar = 50 μm.

Similar articles

Cited by

References

    1. Siegel RL, Miller KD, Jemal A. Cancer Statistics, 2017. CA Cancer J Clin. 2017;67:7–30. - PubMed
    1. Rahib L, Smith BD, Aizenberg R, Rosenzweig AB, Fleshman JM, Matrisian LM. Projecting cancer incidence and deaths to 2030: the unexpected burden of thyroid, liver, and pancreas cancers in the United States. Cancer Res. 2014;74:2913–21. - PubMed
    1. Shaib YH, Davila JA, El-Serag HB. The epidemiology of pancreatic cancer in the United States: changes below the surface. Aliment Pharmacol Ther. 2006;24:87–94. - PubMed
    1. Cid-Arregui A, Juarez V. Perspectives in the treatment of pancreatic adenocarcinoma. World J Gastroenterol. 2015;21:9297–316. - PMC - PubMed
    1. Liang JJ, Kimchi ET, Staveley-O’Carroll KF, Tan D. Diagnostic and prognostic biomarkers in pancreatic carcinoma. Int J Clin Exp Pathol. 2009;2:1–10. - PMC - PubMed

Publication types