. 2018 Feb 5;215(2):681-697.
doi: 10.1084/jem.20171288. Epub 2018 Jan 4.

Functional and clinical relevance of VLA-4 (CD49d/CD29) in ibrutinib-treated chronic lymphocytic leukemia

Affiliations

Functional and clinical relevance of VLA-4 (CD49d/CD29) in ibrutinib-treated chronic lymphocytic leukemia

Erika Tissino et al. J Exp Med. .

Abstract

The Bruton's tyrosine kinase (BTK) inhibitor ibrutinib, which antagonizes B cell receptor (BCR) signals, demonstrates remarkable clinical activity in chronic lymphocytic leukemia (CLL). The lymphocytosis experienced by most patients under ibrutinib has previously been attributed to inhibition of BTK-dependent integrin and chemokine cues operating to retain the tumor cells in nodal compartments. Here, we show that the VLA-4 integrin, as expressed by CD49d-positive CLL, can be inside-out activated upon BCR triggering, thus reinforcing the adhesive capacities of CLL cells. In vitro and in vivo ibrutinib treatment, although reducing the constitutive VLA-4 activation and cell adhesion, can be overcome by exogenous BCR triggering in a BTK-independent manner involving PI3K. Clinically, in three independent ibrutinib-treated CLL cohorts, CD49d expression identifies cases with reduced lymphocytosis and inferior nodal response and behaves as independent predictor of shorter progression-free survival, suggesting the retention of CD49d-expressing CLL cells in tissue sites via activated VLA-4. Evaluation of CD49d expression should be incorporated in the characterization of CLL undergoing therapy with BCR inhibitors.


Figures

Figure 1.
Figure 1.
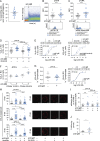
Triggering of the BCR by anti-IgM induces VLA-4 activation and increases cell adhesion and VLA-4 clustering in CLL cells also upon ibrutinib treatment in vitro. (A) Calcium response to anti-IgM stimulation in PBMCs from 30 CLL cases. The pseudocolored dot plot on the right shows an example of BCR response time (in seconds) over Fluo-4 intensity in one representative CLL case. Addition of the stimulus is indicated by the arrow. (B and C) MFIs of phospho (p)-BTK (B) and p-ERK (C) in unstimulated and anti-IgM stimulated cells from 24 CLL cases. The histogram plot overlays below the graphs show p-BTK (B) and p-ERK (C) expression in the unstimulated and anti-IgM–stimulated cells from one representative CLL case; the light gray histograms correspond to unstained cells. (D) VLA-4 RO in primary CLL cells from 26 cases (all cases expressing >60% CD49d), pretreated or not with 1 µM ibrutinib and stimulated or not with 5 µg/ml anti-IgM. The reported VLA-4 RO values were calculated as described in Materials and methods and correspond to the presence of 10 nM LDV. (E) VLA-4 RO plotted versus LDV concentration using the sigmoidal dose–response equation with variable slope performed by GraphPad Prism software in cells untreated (left) or treated with ibrutinib (right) in one representative CLL case. The arrows indicate the shift from the control to the anti-IgM–stimulated condition at 10 nM LDV. EC50 values for all conditions are indicated. R2 corresponds to the coefficient of determination. (F) VLA-4 RO in primary CLL cells expressing CD49d between 10% and 29% (n = 5) and between 30% and 60% (n = 4), pretreated or not with 1 µM ibrutinib and stimulated or not with 5 µg/ml anti-IgM. (G) VLA-4 RO in T lymphocytes from 15 CLL cases in unstimulated and anti-IgM–stimulated conditions. The line graph on the right shows the VLA-4 RO plotted versus LDV concentration obtained in T-lymphocytes from one representative CLL case. (H) VLA-4 clusters in primary CLL cells from 3 cases treated as in (D) obtained on VCAM-1-coated slides. Quantitative clustering analysis was done in at least 50 individual cells for each condition by means of confocal microscopy (original magnification ×60). The three dot plots correspond to three different cases and show the cluster number for all analyzed cells in each condition. On the right, representative confocal microscopy images of VLA-4 clusters revealed by anti-CD49d mAbs, are shown. Bars, 2 µm. (I) Adhesion on VCAM-1 of primary CLL cells from 15 cases treated as in D. Cell adhesion was calculated as relative fold change obtained on VCAM-1 over BSA. Each experiment was run in triplicate. (J) Purified CLL cells from eight cases were stimulated or not with anti-IgM and perfused for 1 min at 0.5 dyn/cm2 over immobilized VCAM-1. The data are expressed as the mean of frequencies of cells in direct contact with the substrate (tethering). Each experiment was run in triplicate. Data are presented as mean ± SEM. Individual symbols represent individual cases in all panels except H, which represents individual cells. *, P < 0.05; **, P < 0.01; ***, P < 0.001; ****, P < 0.0001; n.s., not significant (Wilcoxon test in all panels except F, where a paired t test was applied).
Figure 2.
Figure 2.
BCR-mediated VLA-4 integrin activity is not affected by ibrutinib treatment in vivo. Serial samples from 9 CLL patients were obtained before treatment (day 0) and at days 7, 30, and 90 on ibrutinib therapy. (A) VLA-4 RO in unstimulated and anti-IgM–stimulated CLL cells at days 0 and 30 on ibrutinib (n = 15). (B) VLA-4 RO in unstimulated and anti-IgM–stimulated CLL cells at days 0, 7, 30, and 90 on ibrutinib (n = 7). (C) Adhesion values on VCAM-1 in unstimulated and anti-IgM–stimulated cells at days 0 and 30 on ibrutinib. Each adhesion experiment was run in triplicate. (D) Phospho (p)-BTK MFI in unstimulated and in anti-IgM–stimulated conditions obtained in CLL cells collected at day 30 of ibrutinib therapy after incubation or not in vitro with 1 µM ibrutinib for 1 h (n = 8). (E) VLA-4 RO in the control condition and in anti-IgM–stimulated cells in CLL cells treated as in D. Data are presented as mean ± SEM. Individual symbols represent individual cases. *, P < 0.05; **, P < 0.01; ***, P < 0.001; n.s., not significant (Wilcoxon test).
Figure 3.
Figure 3.
Concomitant inhibition of BTK and PI3K impairs VLA-4 activation. (A) Phospho (p)-BTK MFI in unstimulated and anti-IgM–stimulated CLL cells from seven cases pretreated or not with 1 µM ibrutinib. (B) p-AKT MFI in unstimulated and anti-IgM–stimulated CLL cells pretreated or not with 1 µM idelalisib. (C) VLA-4 RO in unstimulated and anti-IgM–stimulated CLL cells untreated or treated with 1 µM ibrutinib, 1 µM idelalisib, or a combination of both. (D) VLA-4 RO in unstimulated and anti-IgM–stimulated CLL cells (n = 7) collected at day 30 of ibrutinib therapy and treated or not with 1 µM idelalisib in vitro. Data are presented as mean ± SEM. Individual symbols represent individual cases. *, P < 0.05; n.s., not significant (Wilcoxon test).
Figure 4.
Figure 4.
CD49d+ and CD49d CLL show different patterns of redistribution lymphocytosis during ibrutinib treatment. ALCs were collected pretreatment (day 0) and at different treatment time points (days 30, 60, 90, 120) in CLL cases from three different cohorts. (A) Kinetics of ALC (median values) in the IT cohort (left), NIH cohort (middle), and Mayo cohort (right); the gray and red symbols in each graph correspond to the pretreatment median ALC in CD49d and CD49d+ CLL, respectively. (B) Percent ALC change from baseline in CLL cases split according to CD49d expression (CD49d+, red; CD49d, gray) from the three individual cohorts and the merging of all cohorts, shown as individual plots (above graphs) and as median values (below graphs). The number of patients included in each group are reported in parentheses; the black vertical lines indicate SEM. *, P < 0.05; ***, P < 0.001; ****, P < 0.0001; n.s., not significant (Mann–Whitney test).
Figure 5.
Figure 5.
VLA-4 expression decreases after ibrutinib therapy. (A) Flow-cytometric determination of CD49d, CD29, and IgM MFI in CLL cells collected at days 0 and 30 on ibrutinib. (B) Representative flow cytometry dot plot showing CXCR4 versus CD5 expression in gated CLL cells. The red gate identifies CXCR4dim/CD5bright population. (C) CD49d MFI in the CXCR4dim/CD5bright population of CLL cells collected at days 0 and 30 on ibrutinib. Data are presented as mean ± SEM. Individual symbols represent individual cases. *, P < 0.05; **, P < 0.01; n.s., not significant (Wilcoxon test).
Figure 6.
Figure 6.
CD49d+ and CD49d CLL are characterized by different ibrutinib-induced nodal responses. LN dimension evaluation was performed pretreatment and at 12 mo of ibrutinib therapy, and the sum of the products of LN diameters (SPD) of up to five LN regions was calculated. (A) Waterfall plot showing the percent SPD change from baseline in CD49d+ (red bars) or CD49d (gray bars) CLL cases. (B–D) The box and whisker plot shows the median percent SPD change in CLL cases split according to CD49d expression (CD49d, n = 23; gray box; CD49d+, n = 30; red box; B), TP53 disruption (no TP53 disruption, n = 24; blue box; TP53 disruption, n = 28; orange box; C), and IGHV mutations (UM, IGHV, n = 35; blue box; mutated [M] IGHV, n = 18; orange box; D). *, P < 0.05; n.s., not significant (Mann–Whitney test).
Figure 7.
Figure 7.
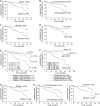
PFS of ibrutinib-treated CLL patients. (A-I) Kaplan–Meier estimates of PFS of CLL patients treated with ibrutinib and stratified by CD49d expression (A), TP53 disruption (B), IGHV mutational status (C), prior treatment (D), the association of CD49d expression and TP53 disruption (E), the association of CD49d expression and IGHV mutational status (F), CD49d expression in the context of RR CLL (G), TP53 disruption in the context of RR CLL (H), and IGHV mutational status in the context of RR CLL (I). The number of patients included in each group are reported in parentheses. *, P < 0.05; **, P < 0.01; n.s., not significant (log-rank test).

References

    1. Ahn I.E., Underbayev C., Albitar A., Herman S.E., Tian X., Maric I., Arthur D.C., Wake L., Pittaluga S., Yuan C.M., et al. . 2017. Clonal evolution leading to ibrutinib resistance in chronic lymphocytic leukemia. Blood. 129:1469–1479. 10.1182/blood-2016-06-719294 - DOI - PMC - PubMed
    1. Apollonio B., Scielzo C., Bertilaccio M.T., Ten Hacken E., Scarfò L., Ranghetti P., Stevenson F., Packham G., Ghia P., Muzio M., and Caligaris-Cappio F.. 2013. Targeting B-cell anergy in chronic lymphocytic leukemia. Blood. 121:3879–3888. 10.1182/blood-2012-12-474718 - DOI - PubMed
    1. Arana E., Harwood N.E., and Batista F.D.. 2008a Regulation of integrin activation through the B-cell receptor. J. Cell Sci. 121:2279–2286. 10.1242/jcs.017905 - DOI - PubMed
    1. Arana E., Vehlow A., Harwood N.E., Vigorito E., Henderson R., Turner M., Tybulewicz V.L., and Batista F.D.. 2008b Activation of the small GTPase Rac2 via the B cell receptor regulates B cell adhesion and immunological-synapse formation. Immunity. 28:88–99. 10.1016/j.immuni.2007.12.003 - DOI - PubMed
    1. Brown J.R., Hillmen P., O’Brien S., Barrientos J.C., Reddy N.M., Coutre S.E., Tam C.S., Mulligan S.P., Jaeger U., Barr P.M., et al. . 2017. Extended follow-up and impact of high-risk prognostic factors from the phase 3 RESONATE study in patients with previously treated CLL/SLL. Leukemia. 10.1038/leu.2017.175 - DOI - PMC - PubMed

Publication types

MeSH terms