. 2018 Feb 23;293(8):2829-2840.
doi: 10.1074/jbc.RA117.000846. Epub 2018 Jan 4.

Oxidation of the FAD cofactor to the 8-formyl-derivative in human electron-transferring flavoprotein

Affiliations

Oxidation of the FAD cofactor to the 8-formyl-derivative in human electron-transferring flavoprotein

Peter Augustin et al. J Biol Chem. .

Abstract

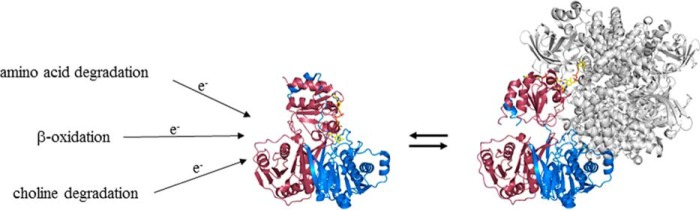
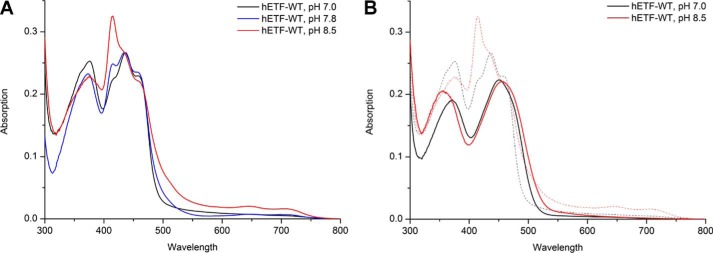
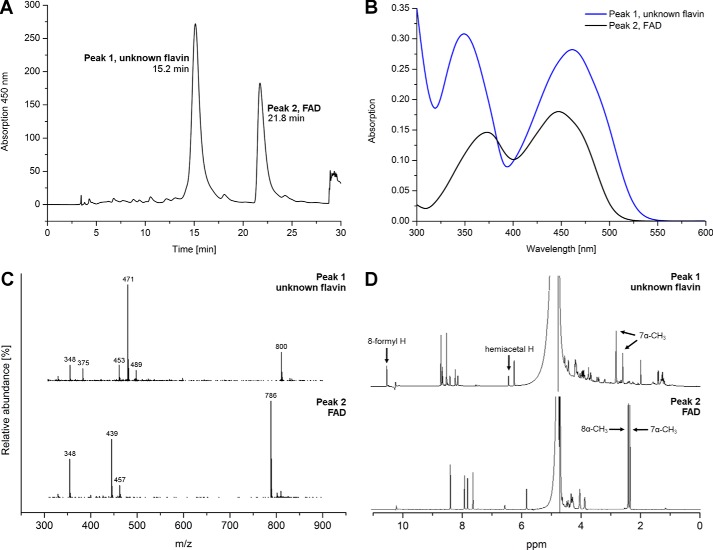
The heterodimeric human (h) electron-transferring flavoprotein (ETF) transfers electrons from at least 13 different flavin dehydrogenases to the mitochondrial respiratory chain through a non-covalently bound FAD cofactor. Here, we describe the discovery of an irreversible and pH-dependent oxidation of the 8α-methyl group to 8-formyl-FAD (8f-FAD), which represents a unique chemical modification of a flavin cofactor in the human flavoproteome. Furthermore, a set of hETF variants revealed that several conserved amino acid residues in the FAD-binding pocket of electron-transferring flavoproteins are required for the conversion to the formyl group. Two of the variants generated in our study, namely αR249C and αT266M, cause glutaric aciduria type II, a severe inherited disease. Both of the variants showed impaired formation of 8f-FAD shedding new light on the potential molecular cause of disease development. Interestingly, the conversion of FAD to 8f-FAD yields a very stable flavin semiquinone that exhibited slightly lower rates of electron transfer in an artificial assay system than hETF containing FAD. In contrast, the formation of 8f-FAD enhanced the affinity to human dimethylglycine dehydrogenase 5-fold, indicating that formation of 8f-FAD modulates the interaction of hETF with client enzymes in the mitochondrial matrix. Thus, we hypothesize that the FAD cofactor bound to hETF is subject to oxidation in the alkaline (pH 8) environment of the mitochondrial matrix, which may modulate electron transport between client dehydrogenases and the respiratory chain. This discovery challenges the current concepts of electron transfer processes in mitochondria.

Keywords: 8-formyl-FAD; dehydrogenase; electron transfer; flavin adenine dinucleotide (FAD); flavin semiquinone; mitochondria; respiratory chain.


Conflict of interest statement

The authors declare that they have no conflicts of interest with the contents of this article

Figures

Scheme 1.
Scheme 1.
Interaction of human flavin dehydrogenases with hETF. So far, 13 flavin dehydrogenases, involved in β-oxidation (short chain acyl-CoA dehydrogenase; medium chain acyl-CoA dehydrogenase; long chain acyl-CoA dehydrogenase; very long chain acyl-CoA dehydrogenase; and acyl-CoA dehydrogenase family member 9–11), amino acid (short branched chain acyl-CoA, iso-valeryl-CoA, iso-butyryl-CoA, and glutaryl-CoA dehydrogenase), and choline degradation (dimethylglycine and sarcosine dehydrogenase) were identified to interact with hETF. hETF exhibits a flexible interaction mechanism and adopts a closed non-productive form (PDB code 1EFV) and an open productive conformation, here shown bound to human medium chain acyl-CoA dehydrogenase (PDB code 2A1T). The α- and β-subunits of hETF are shown in raspberry and in marine cartoon view, respectively. hETF bound hMCAD is displayed in gray. hETF bound FAD is presented in yellow sticks, hMCAD bound FAD in pink stick representation.
Figure 1.
Figure 1.
Purification of hETF-WT. The SDS-PAGE of hETF Ni-NTA affinity chromatography is shown as follows: lane 1, PageRuler® prestained protein ladder (Thermo Fisher Scientific); lane 2, cell lysate; lane 3, column flow-through; lane 4, washing fraction; and lane 5, elution fraction.
Figure 2.
Figure 2.
UV-visible absorption spectra of native (A) and denatured hETF-WT (B) purified at pH 7 (7. 8) and 8.5. A, pH conditions used in the purification of hETF-WT, pH 7 (black line), 7.8 (blue line), and 8.5 (red line), strongly affected the absorption spectra of the isolated protein. B, denaturation of hETF purified at pH 7 (black) and 8.5 (red) with 20% SDS also resulted in different absorption spectra (dotted and solid lines represent spectra recorded before and after denaturation, respectively).
Figure 3.
Figure 3.
Analysis and comparison of the two main flavin-containing fractions isolated from hETF. A, HPLC reversed phase purification of the extracted cofactor(s) gave two major fractions, which were further analyzed by MS and NMR. B, spectra of the two peaks of HPLC purification featured the same shifts as seen in Fig. 2B. C, mass spectra of the two main fractions as separated by HPLC. The spectrum shown at the bottom exhibits the typical fragmentation and mass peaks of FAD. The mass spectrum at the top shows a mass shift of 14 a.u. D, in agreement with the mass analysis, the 1H NMR spectrum at the bottom can be assigned to FAD, whereas the additional resonance at 10.4 ppm and the shifts observed for the methyl groups in position 7α and 8α indicate chemical changes in the dimethylbenzene ring moiety of the isoalloxazine ring. Both methods indicate that a small amount of a closed, hemiacetal form of 8f-FAD is present, as observed previously (12).
Figure 4.
Figure 4.
Formation of 8f-FAD radical in wildtype hETF and the αN259A variant. A, ∼400 μm wildtype hETF purified in 50 mm HEPES, pH 7.0, was diluted 1:20 with HEPES buffer, pH 8.5, and was incubated at 25 °C for 24 h. B, ∼400 μm hETF-αN259A purified in 50 mm HEPES, pH 7.0, was diluted 1:20 with HEPES buffer, pH 8.5, and was incubated at 25 °C for 24 h. The dotted line in both panels represents the spectrum measured after 24 h. The spectra were normalized to an absorption of 1 at the isosbestic point at 469 nm to simplify comparison. The insets show the time-dependent absorption changes recorded at the indicated times at 415 nm.
Figure 5.
Figure 5.
Amino acid residues near the isoalloxazine ring system that have been targeted by site-directed mutagenesis. αThr-266 was replaced by a methionine, αArg-249 by a cysteine, and αHis-286 by an alanine and βTyr-16 by a phenylalanine by an alanine to study their influence on 8f-FAD formation. Possible interactions of these residues with the isoalloxazine ring are indicated by the dashed lines.
Figure 6.
Figure 6.
Photoreduction of wildtype hETF and variant αN259A. A, photoreduction of wildtype hETF purified at pH 7.0 proceeded to the anionic (red) FAD semiquinone. The semiquinone resisted further photoreduction and was completely reduced to the hydroquinone upon addition of sodium dithionite (inset). B, in contrast to wildtype hETF, photoreduction of the hETF-αN259A variant purified at pH 8.5 occurred from the radical to the hydroquinone form.
Figure 7.
Figure 7.
Steady-state kinetics of wildtype hETF and the variants αN259A and βE165A purified at pH 7 (black squares) and pH 8.5 (red dots). The measurements were performed at pH 7 with varying hETF concentrations, using hDMGDH as client dehydrogenase and DCPIP as the final electron acceptor.
Figure 8.
Figure 8.
Composition of FAD-binding site of additional ETF structures. The crystal structures of bacterial ETFs from P. denitrificans (A, gold; PDB code 1EFP), M. methylotrophus (B, orange; PDB code 1O96), and A. fermentans (C, blue; PDB code 4KPU) were aligned with the structure of hETF (green, D; PDB code 1EFV). The alignment shows that all four structures have a very conserved active site composition.
Figure 9.
Figure 9.
Electron densities of the FAD region of selected ETF proteins. A, human ETF (PDB code 1EFV); B, human ETF βE165A variant (PDB code 2A1U); C, A. fermentans ETF (PDB code 4KPU); D, M. methylotrophus ETF (PDB code 1O96); E, M. methylotrophus ETF αR236A variant (PDB code 3CLR); and F, M. methylotrophus ETF αR236K variant (PDB code 3CLU). In all panels, the 2FoFc electron density map contoured at 1σ is shown as light blue mesh around the cofactor, and residues of an important loop region are on the re side of the flavin. The green density map corresponds to the FoFc map contoured at 3σ.

References

    1. Crane F. L., Mii S., Hauge J. G., Green D. E., and Beinert H. (1956) On the mechanism of dehydrogenation of fatty acyl derivatives of coenzyme A. I. The general fatty acyl coenzyme A dehydrogenase. J. Biol. Chem. 218, 701–706 - PubMed
    1. Toogood H. S., Leys D., and Scrutton N. S. (2007) Dynamics driving function–new insights from electron-transferring flavoproteins and partner complexes. FEBS J. 274, 5481–5504 10.1111/j.1742-4658.2007.06107.x - DOI - PubMed
    1. Ghisla S., and Thorpe C. (2004) Acyl-CoA dehydrogenases: a mechanistic overview. Eur. J. Biochem. 271, 494–508 10.1046/j.1432-1033.2003.03946.x - DOI - PubMed
    1. Toogood H. S., van Thiel A., Basran J., Sutcliffe M. J., Scrutton N. S., and Leys D. (2004) Extensive domain motion and electron transfer in the human electron-transferring flavoprotein·medium chain acyl-CoA dehydrogenase complex. J. Biol. Chem. 279, 32904–32912 10.1074/jbc.M404884200 - DOI - PubMed
    1. Herrick K. R., Salazar D., Goodman S. I., Finocchiaro G., Bedzyk L. A., and Frerman F. E. (1994) Expression and characterization of human and chimeric human-Paracoccus denitrificans electron transfer flavoproteins. J. Biol. Chem. 269, 32239–32245 - PubMed

Publication types

MeSH terms

Supplementary concepts

LinkOut - more resources