. 2018 Feb 16;359(6377):770-775.
doi: 10.1126/science.aao1710. Epub 2018 Jan 4.

A major chromatin regulator determines resistance of tumor cells to T cell-mediated killing

Affiliations

A major chromatin regulator determines resistance of tumor cells to T cell-mediated killing

Deng Pan et al. Science. .

Abstract

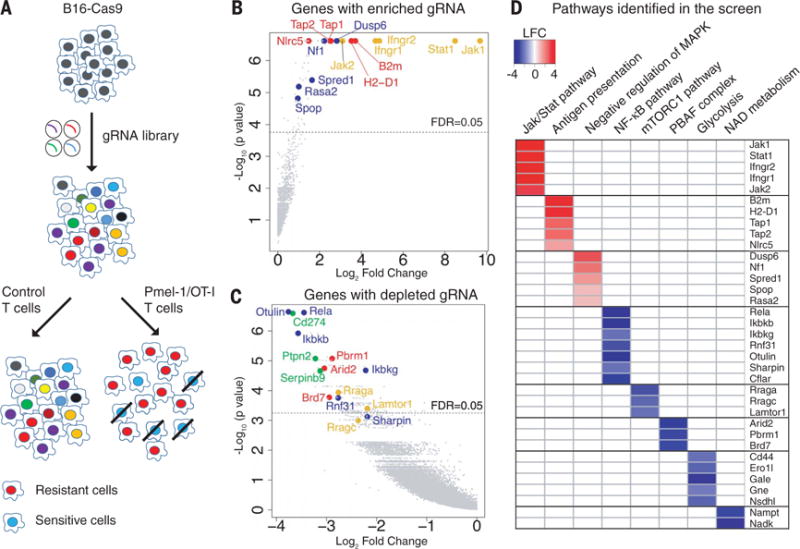
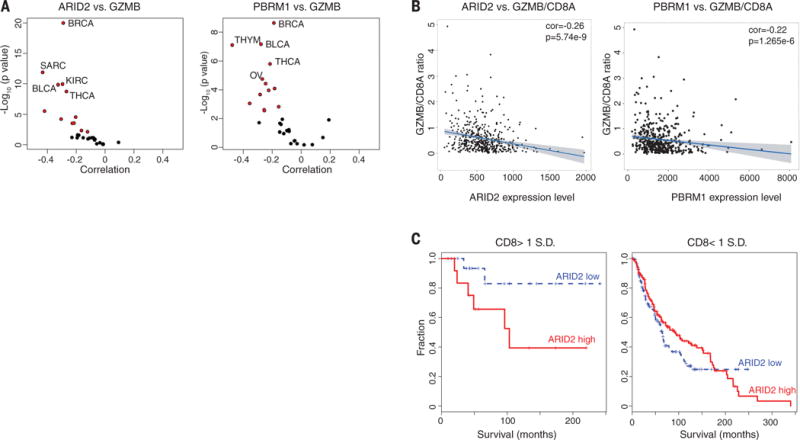
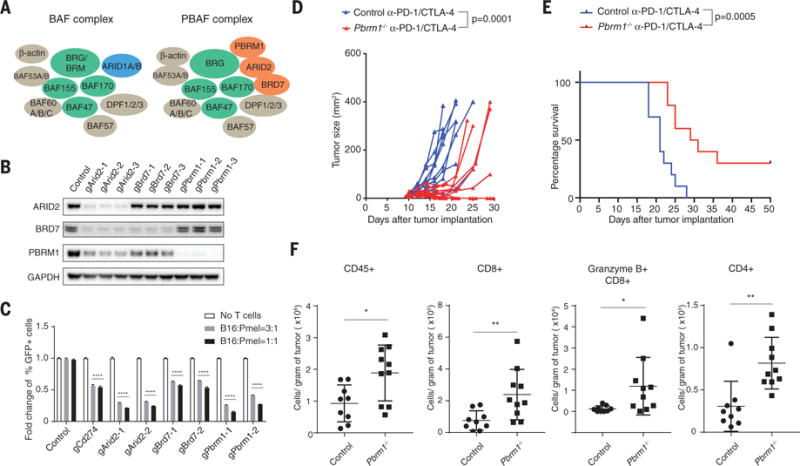
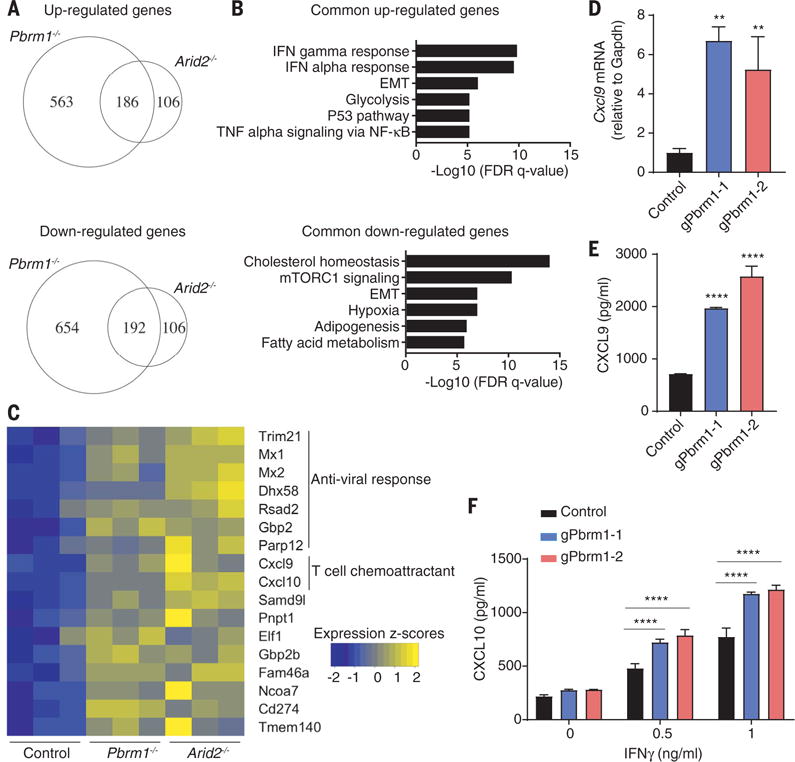
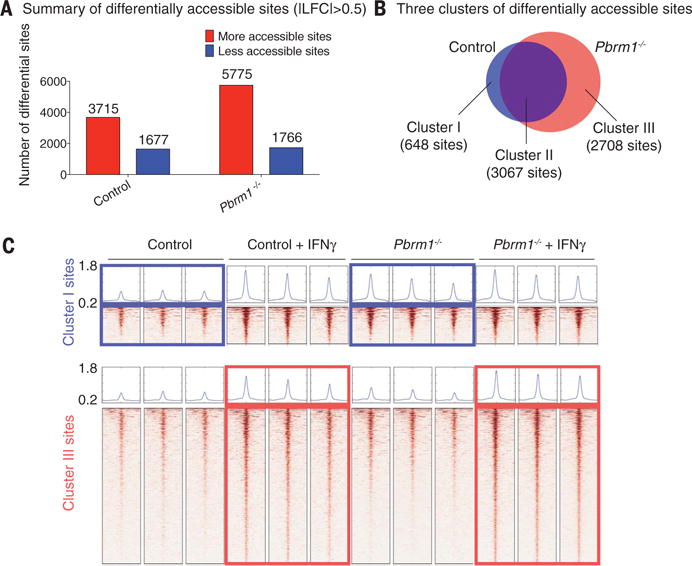
Many human cancers are resistant to immunotherapy, for reasons that are poorly understood. We used a genome-scale CRISPR-Cas9 screen to identify mechanisms of tumor cell resistance to killing by cytotoxic T cells, the central effectors of antitumor immunity. Inactivation of >100 genes-including Pbrm1, Arid2, and Brd7, which encode components of the PBAF form of the SWI/SNF chromatin remodeling complex-sensitized mouse B16F10 melanoma cells to killing by T cells. Loss of PBAF function increased tumor cell sensitivity to interferon-γ, resulting in enhanced secretion of chemokines that recruit effector T cells. Treatment-resistant tumors became responsive to immunotherapy when Pbrm1 was inactivated. In many human cancers, expression of PBRM1 and ARID2 inversely correlated with expression of T cell cytotoxicity genes, and Pbrm1-deficient murine melanomas were more strongly infiltrated by cytotoxic T cells.


Figures

Fig. 1
Fig. 1. Systematic discovery of genes and pathways regulating sensitivity and resistance of tumor cells to Tcell–mediated killing
(A) Screening strategy. Cas9-expressing B16F10 cells were transduced with a genome-scale gRNA library (four gRNAs/gene). Edited B16F10 cells were cocultured with activated cytotoxic T cells followed by Illumina sequencing of gRNA representation. Specific selection was performed with Pmel-1 T cells (specific for gp100 melanoma antigen) or OT-I T cells (specific for Ova peptide). Control selection was performed with T cells of irrelevant specificity. (B) Top genes for enriched gRNAs from Pmel-1 screen. Candidate genes were plotted based on mean log2 fold change of gRNA counts compared to control selection and P values computed by MaGeCK (Model-based Analysis of Genome-wide CRISPR-Cas9 Knockout). Dashed line indicates a FDR (false discovery rate) of 0.05. Annotated genes represent MHC class I (red), interferon (yellow), and Ras/MAPK (blue) pathways. (C) Top genes for depleted gRNAs from Pmel-1 screen. Genes related to the PBAF form of SWI/SNF complex (red), NF-κB pathway (blue), mTORC1 pathway (yellow), and known negative immune regulators (green) were annotated. (D) Selected pathways and corresponding genes identified in the Pmel-1 screen. Color scale represents log2 fold change of average gRNA representation.
Fig. 2
Fig. 2. Expression of ARID2 and PBRM1 is negatively correlated with T cell cytotoxicity markers in TCGA data sets
(A) Correlation of ARID2 and PBRM1 mRNA levels with GZMB mRNA levels in indicated cancers. Volcano plot showing the Spearman’s correlation and estimated significance of ARID2 (left) or PBRM1 (right) with GZMB mRNA levels from RNA-seq data across TCGA cancer types calculated by TIMER (Tumor Immune Estimation Resource) and adjusted for tumor purity (32). Each dot represents a cancer type in TCGA; red dots indicate significant correlations (P < 0.01). (B) Analysis of ARID2 and PBRM1 mRNA levels in relation to GZMB and CD8A as cytotoxicity and CD8 T cell infiltration markers, respectively. Spearman’s correlation of ARID2 (left) and PBRM1 (right) mRNA levels to GZMB/CD8A mRNA ratio in the TCGA melanoma data set. (C) Correlation of ARID2 expression level with survival of melanoma patients depending on calculated level of CD8 T cell infiltration. All patients in the TCGA melanoma study were divided according to the expression level of ARID2 (higher or lower than mean expression value of all patients). The impact of ARID2 expression level on survival is shown for patients whose tumors had higher (>1 SD) or lower (<1 SD) expression of CD8 [(CD8A + CD8B)/2].
Fig. 3
Fig. 3. Inactivation of PBAF complex sensitizes tumor cells to T cell–mediated killing and synergizes with checkpoint blockade therapy
(A) Cartoon illustrating the composition of BAF and PBAF versions of SWI/SNF complex. (B) Western blot showing protein abundance of ARID2, BRD7, PBRM1, and GAPDH in control and indicated knockout cell lines. (C) Green fluorescent protein (GFP)–positive Arid2-, Pbrm1-, or Brd7-deficient B16F10 cells were mixed with GFP-negative control B16F10 cells at approximately 1:1 ratio. Tumor cells were cocultured with Pmel-1 Tcells at indicated effector-to-target ratios for 3 days in triplicates; the fold change of the percentage of GFP-positive tumor cells was determined by fluorescence-activated cell sorting. Two-way analysis of variance (ANOVA) was used to determine statistical significance (****P < 0.0001). Values represent mean ± SD. (D) Mice bearing control (n = 10) or Pbrm1-deficient B16F10 tumors (n = 10) were treated with anti–PD-1 (α-PD-1, 200 μg/mouse) plus anti–CTLA-4 (α-CTLA-4, 100 μg/mouse), and tumor size was measured. Two-way ANOVA was used to determine statistical significance for time points when all mice were viable for tumor measurement. (E) Survival of mice inoculated with control (n = 10) or Pbrm1-deficient B16F10 cells (n = 10) and treated with α-PD-1 plus α-CTLA-4. Log-rank (Mantel-Cox) test was used to determine statistical significance. (F) Flow cytometric analysis of immune cell infiltration in Pbrm1-deficient and control B16F10 tumors. The number of CD45+, CD4+, CD8+, and Granzyme B+ CD8+ T cells was determined per gram of tumor. Mann-Whitney test was used to determine significance (*P < 0.05, **P < 0.01). Values represent mean ± SD. Data in (C) to (F) are representative of two independent experiments.
Fig. 4
Fig. 4. Enhanced responsiveness to IFN-γ stimulation by Arid2- and Pbrm1-deficient tumor cells
(A to C) RNA-seq analysis of Arid2- or Pbrm1-deficient cells and control B16F10 cells treated with IFN-γ (10 ng/ml) for 24 hours. (A) Venn diagram showing differentially regulated mRNAs in the presence of IFN-γ. (B) Hallmark gene sets enriched for commonly up- or downregulated mRNAs in both Arid2- and Pbrm1-deficient cells compared to control B16F10 cells in the presence of IFN-γ treatment [as shown in (A)]. (C) Heat map showing expression value (z-score based on cufflink count) of interferon-responsive genes in control, Arid2-, and Pbrm1-deficient B16F10 cells following IFN-γ treatment. (D and E) Cxcl9 mRNA level (D) and Cxcl9 protein secretion (E) comparing Pbrm1-deficient and control B16F10 tumor cells stimulated with IFN-γ (10 ng/ml) for 24 hours. Values represent mean ± SD. (F) Cxcl10 secretion by Pbrm1-deficient and control B16F10 tumor cells stimulated with IFN-γ (0, 0.5, and 1 ng/ml) for 24 hours. Values represent mean ± SD. One-way ANOVA (D and E) and two-way ANOVA (F) were used to determine significance. **P < 0.01, ****P < 0.0001. Data in (D) and (F) are representative of two independent experiments.
Fig. 5
Fig. 5. Enhanced chromatin accessibility for IFN-γ–responsive genes in Pbrm1-deficient tumor cells
ATAC-seq was performed on Pbrm1-deficient and control B16F10 cells with or without IFN-γ stimulation (10 ng/ml) for 24 hours. (A) Genome-wide analysis of differentially accessible chromatin sites (|log2 fold change| > 0.5) following IFN-γ stimulation in control versus Pbrm1-deficient B16F10 tumor cells. (B) Venn diagram illustrating accessible sites gained following IFN-γ treatment in control (blue) and Pbrm1-deficient (red) cells. (C) Chromatin accessibility heat maps for all sites in clusters I (top panel) and III (bottom panel). Aggregated reads within 2 kb of center of differentially accessible regions are shown above heat maps.

Comment in

  • Chromatin regulation and immune escape.
    Ghorani E, Quezada SA. Ghorani E, et al. Science. 2018 Feb 16;359(6377):745-746. doi: 10.1126/science.aat0383. Science. 2018. PMID: 29449480 No abstract available.

References

    1. Sharma P, Hu-Lieskovan S, Wargo JA, Ribas A. Cell. 2017;168:707–723. - PMC - PubMed
    1. Zhang N, Bevan MJ. Immunity. 2011;35:161–168. - PMC - PubMed
    1. Iwai Y, et al. Proc Natl Acad Sci USA. 2002;99:12293–12297. - PMC - PubMed
    1. van Elsas A, Hurwitz AA, Allison JP. J Exp Med. 1999;190:355–366. - PMC - PubMed
    1. Chen S, et al. Cancer Immunol Res. 2015;3:149–160. - PubMed

Publication types

MeSH terms