. 2018 Jan 4;9(1):68.
doi: 10.1038/s41467-017-02458-4.

Profiling the lymphoid-resident T cell pool reveals modulation by age and microbiota

Affiliations

Profiling the lymphoid-resident T cell pool reveals modulation by age and microbiota

Aurélie Durand et al. Nat Commun. .

Abstract

Despite being implicated in non-lymphoid tissues, non-recirculating T cells may also exist in secondary lymphoid organs (SLO). However, a detailed characterization of this lymphoid-resident T cell pool has not yet been done. Here we show that a substantial proportion of CD4 regulatory (Treg) and memory (Tmem) cells establish long-term residence in the SLOs of specific pathogen-free mice. Of these SLOs, only T cell residence within Peyer's patches is affected by microbiota. Resident CD4 Treg and CD4 Tmem cells from lymph nodes and non-lymphoid tissues share many phenotypic and functional characteristics. The percentage of resident T cells in SLOs increases considerably with age, with S1PR1 downregulation possibly contributing to this altered homeostasis. Our results thus show that T cell residence is not only a hallmark of non-lymphoid tissues, but can be extended to secondary lymphoid organs.


Conflict of interest statement

The authors declare no competing financial interests.

Figures

Fig. 1
Fig. 1
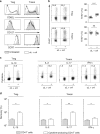
Analysis of mouse parabionts reveals the long-term residence of T cell populations in SLOs. Four weeks after parabiosis surgery, blood, cervical LNs (cLNs), mesenteric LNs (mLNs), spleen, and Peyer’s patches (Pp) were recovered and analyzed. a Diagram illustrating the experimental model. b Gating strategy to define naïve (Tnaive), memory (Tmem) and regulatory (Treg) CD4 and CD8 T cells. c CD45.1/CD45.2 dot-plots are shown for mLN CD4 Treg, Tmem and Tnaive cells from a representative CD45.1 parabiont. d CD45.1/CD45.2 dot-plots are shown for mLN CD8 Tmem and Tnaive cells from a representative CD45.1 parabiont. e Proportions of host cells (CD45.1+ for the CD45.1 parabiont and CD45.2+ for the CD45.2 parabiont) among the indicated CD4 T cell and CD8 T cell subsets recovered from blood, cLNs, mLNs, Spleen, and Pp are shown for at least ten parabiotic pairs from three independent experiments (mean ± SEM; paired t-test). f Proportions of host cells among Ly-6C and Ly-6C+ CD4 Treg cells. Each pair of dots represents an individual mouse (paired t-test). *p < 0.05, ***p < 0.001. ns not significant
Fig. 2
Fig. 2
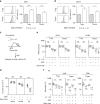
Analysis of residual T cells after blocking T cell entry into LNs and Peyer’s Patches. ac 6–12-week-old C57BL/6 Foxp3-GFP mice were injected or not i.p. with 200 μg of anti-LFA-1 (αL) and anti-VLA-4 (α4) Abs. Twenty-four hours later, cLNs, mLNs, Pp, and spleen were harvested and analyzed. a Diagram illustrating the experimental model. b Distribution of Treg, Tmem, and Tnaive cells among CD4 T cells in the indicated SLOs of treated or untreated mice. c Distribution of Treg, Tmem, and Tnaive cells among CD8 T cells in the indicated SLOs of treated or untreated mice. d, e 6–12-week-old C57BL/6 Foxp3-GFP mice were injected or not i.p. with 200 μg of anti-LFA-1 (αL) and anti-VLA-4 (α4) Abs every 2 days from day 0 to day 6 and SLOs were recovered for analysis at various time-points. d Experimental model. e Percentages of Treg, Tmem, and Tnaive cells among CD4 T cells are shown as means ± SEM for the indicated SLOs. f Relative absolute numbers of CD4 Treg, Tmem, and Tnaive cells in cLNs, mLNs, and spleen are shown. The percentage of recovery was calculated by dividing the absolute numbers in treated mice by the mean absolute number obtained in untreated animals. Data are means ± SEM for at least three independent experiments. Mouse clip arts were generated in ref.
Fig. 3
Fig. 3
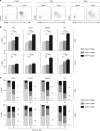
T cell residence in SLOs increases with age in SPF mice. a Distribution of Treg, Tmem, and Tnaive cells among CD4 T cells in blood, pLNs (pooled superficial cervical, axillary, brachial, and inguinal LNs), mLNs, and spleen of 1–12-month-old C57BL/6 Foxp3-GFP mice. b C57BL/6 Foxp3-GFP mice of various ages were injected or not i.p. with 200 μg of anti-LFA-1 (αL) and anti-VLA-4 (α4) Abs. Forty-eight hours later, blood, pLNs, mLNs, and spleen were harvested and analyzed. Relative absolute numbers (recovery) of CD4 Treg, Tmem, and Tnaive cells in the indicated SLOs are shown as means ± SEM as a function of mouse age. c, d Percentages of Treg, Tmem, and Tnaive cells among total or “circulating” CD4 T cells are shown as means ± SEM for the indicated SLOs (see the experimental procedures for calculations)
Fig. 4
Fig. 4
pLN-resident CD4 T cells exhibit an effector phenotype. 6–12-week-old C57BL/6 Foxp3-GFP mice were injected or not i.p. with 200 μg of anti-LFA-1 (αL) and anti-VLA-4 (α4) Abs. Forty-eight hours later, pLNs were harvested and analyzed. a CD62L, CD127, and CCR7 fluorescence histograms of CD4 Treg and CD4 Tmem cells from a representative treated and a representative control C57BL/6 Foxp3-GFP mouse. b Representative Ki-67 expression by CD4 Treg and CD4 Tmem cells from treated and control mice. Quantification is shown on the right side of the panel (unpaired t-test). Each dot represents an individual mouse. c Representative IL-10 expression by CD4 Treg cells and representative IL-2, IL-17, and IFN-γ expression by CD4 Tmem cells from treated and control mice. d Quantification of cytokine production by CD4 Treg and Tmem cells is shown as means ± SEM with paired t-test. The percentage of recovery for a given cytokine was calculated by dividing the absolute numbers of cells expressing this cytokine in treated mice by the mean absolute number of cells expressing this same cytokine in untreated animals (white bars). The gray bars correspond to the recovery of total CD4 Treg or CD4 Tmem cells in the same samples. *p < 0.05, **p < 0.01, ***p < 0.001. ns not significant
Fig. 5
Fig. 5
Assessing the relative role of self antigens and microbiota in T cell residence in SLOs. ac 6–12-week-old C57BL/6 Foxp3-GFP mice were injected or not i.p. with 200 μg of anti-LFA-1 (αL) and anti-VLA-4 (α4) Abs. Forty-eight hours later, peripheral lymph nodes (pLN) were harvested and analyzed. CD5 (a) and Nur77 (b) fluorescence histograms of CD4 Treg and CD4 Tmem cells from the pLNs of a representative treated and a representative control C57BL/6 Foxp3-GFP mouse. Quantification is shown as means ± SEM with unpaired t-test on the right part of these panels. cf 6–8-week-old SPF or germ-free C57BL/6 mice were injected or not i.p. with 200 μg of anti-LFA-1 (αL) and anti-VLA-4 (α4) Abs. Forty-eight hours later, SLOs were harvested and analyzed. c Diagram illustrating the experimental model. d Total cell numbers recovered from pLNs, mLNs, and Peyer’s patches (Pp) of SPF or germ-free mice. e Recovery of CD4 Treg and CD4 Tmem cells in pLNs and mLNs. f Recovery of CD4 Treg, CD4 Tmem and CD8 Tmem cells in Peyer’s patches (Pp). Each dot represents an individual mouse (unpaired t-test). *p < 0.05, **p < 0.01, ***p < 0.001. ns not significant. Mouse clip arts were generated in (21)
Fig. 6
Fig. 6
Gene expression profiling of LN-resident CD4 Treg and Tmem cells. a “Volcano plot” representation (Log2 (ratio) versus Log10 (t test p value)) between day 2 and control LN CD4 Treg cells from C57BL/6 Foxp3-GFP mice. Among the 500 genes the most differentially expressed between muscle and control CD4 Treg cells with a P value of <0.05, upregulated and downregulated genes are highlighted in red and blue respectively. Data sets were filtered to common probes between the two arrays. b Same as in a for CD4 Tmem cells. c Comparison of the sets of genes differentially expressed between day 2 LN, Muscle and VAT CD4 Tregs cells and their respective control cells. Data sets were filtered to common probes between the three arrays. d Same as in c for CD4 Tmem cells. e Expression pattern of chosen genes differentially expressed (±1.5 fold change, with a p value of <0.05) between day 2 LN, Muscle and VAT CD4 Tregs cells and their respective control cells. f Same as in e for CD4 Tmem cells
Fig. 7
Fig. 7
S1PR1 downregulation account for T cell residence in SLOs. a, b Four weeks after parabiosis surgery, blood, cervical LNs (cLNs), mesenteric LNs (mLNs), spleen, and Peyer’s patches (Pp) were recovered and analyzed. a S1PR1/CD69 representative dot-plots are shown for blood and cLN CD4 Treg, Tmem, and Tnaive cells from a representative parabiont. b Proportions of host cells (CD45.1+ for the CD45.1 parabiont and CD45.2+ for the CD45.2 parabiont) among the indicated CD4 Treg (upper panel) and Tmem (lower panel) cell-subsets recovered from cLNs, mLNs, spleen, and Peyer’s patches (Pp) are shown as means ± SEM with paired t-test for six parabiotic pairs from three independent experiments. c pLNs, mLNs, spleen, and Peyer’s patches (Pp) of 1- and 12-month-old mice were recovered and analyzed. Proportion of the indicated CD4 Treg (upper panel) and CD4 Tmem (lower panel) cell-subpopulations are shown as means with unpaired t-test. *p < 0.05, **p < 0.01, ***p < 0.001. ns not significant

Similar articles

Cited by

References

    1. Mueller SN, Mackay LK. Tissue-resident memory T cells: local specialists in immune defence. Nat. Rev. Immunol. 2016;16:79–89. doi: 10.1038/nri.2015.3. - DOI - PubMed
    1. Steinert EM, et al. Quantifying memory CD8 T cells reveals regionalization of immunosurveillance. Cell. 2015;161:737–749. doi: 10.1016/j.cell.2015.03.031. - DOI - PMC - PubMed
    1. Turner DL, Farber DL. Mucosal resident memory CD4 T cells in protection and immunopathology. Front. Immunol. 2014;5:331. doi: 10.3389/fimmu.2014.00331. - DOI - PMC - PubMed
    1. Burzyn D, Benoist C, Mathis D. Regulatory T cells in nonlymphoid tissues. Nat. Immunol. 2013;14:1007–1013. doi: 10.1038/ni.2683. - DOI - PMC - PubMed
    1. Gratz IK, Campbell DJ. Organ-specific and memory treg cells: specificity, development, function, and maintenance. Front. Immunol. 2014;5:333. doi: 10.3389/fimmu.2014.00333. - DOI - PMC - PubMed

Publication types

Substances