

Broad spectrum pesticide application alters natural enemy communities and may facilitate secondary pest outbreaks
- PMID: 29302395
- PMCID: PMC5740959
- DOI: 10.7717/peerj.4179
Broad spectrum pesticide application alters natural enemy communities and may facilitate secondary pest outbreaks
Abstract
Background: Pesticide application is the dominant control method for arthropod pests in broad-acre arable systems. In Australia, organophosphate pesticides are often applied either prophylactically, or reactively, including at higher concentrations, to control crop establishment pests such as false wireworms and earth mite species. Organophosphates are reported to be disruptive to beneficial species, such as natural enemies, but this has not been widely assessed in Australian systems. Neither has the risk that secondary outbreaks may occur if the natural enemy community composition or function is altered.
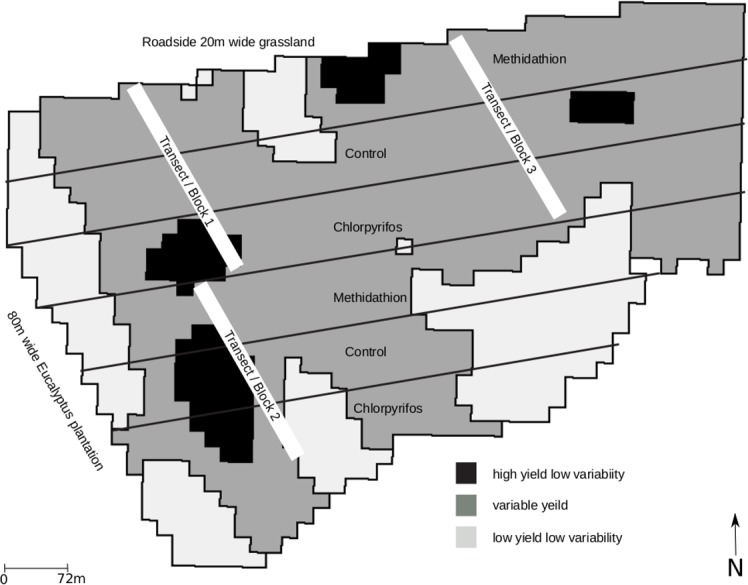
Methods: We examine the abundance of ground-dwelling invertebrate communities in an arable field over successive seasons under rotation; barley, two years of wheat, then canola. Two organophosphates (chlorpyrifos and methidathion) were initially applied at recommended rates. After no discernible impact on target pest species, the rate for chlorpyrifos was doubled to elicit a definitive response to a level used at establishment when seedling damage is observed. Invertebrates were sampled using pitfalls and refuge traps throughout the experiments. We applied measures of community diversity, principal response curves and multiple generalised linear modelling techniques to understand the changes in pest and natural enemy communities.
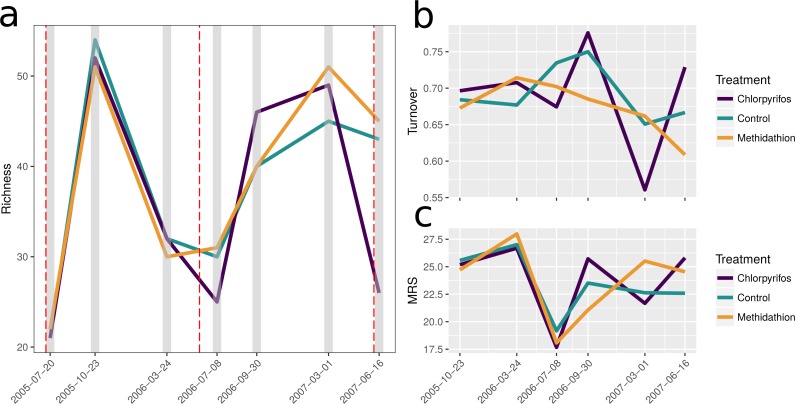
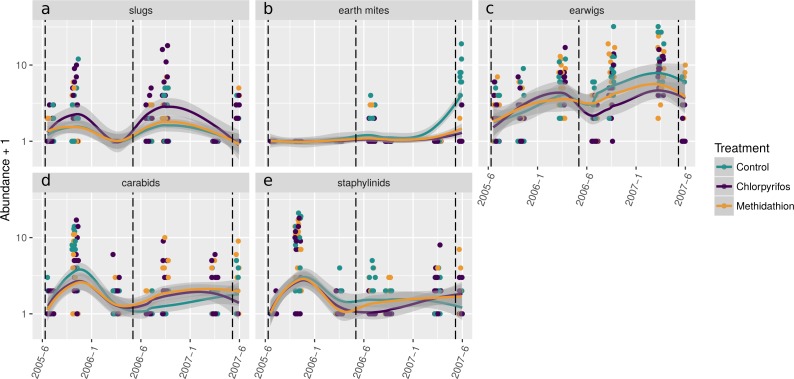
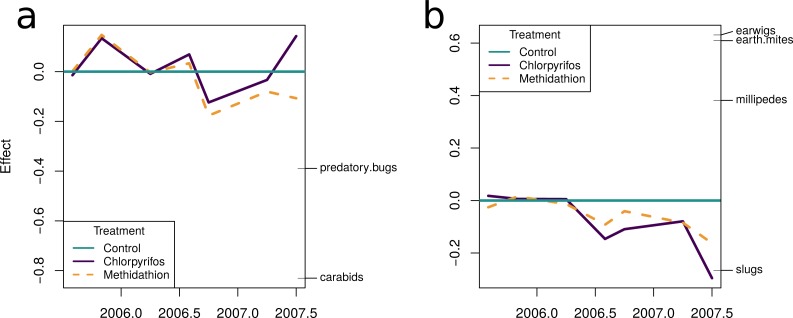
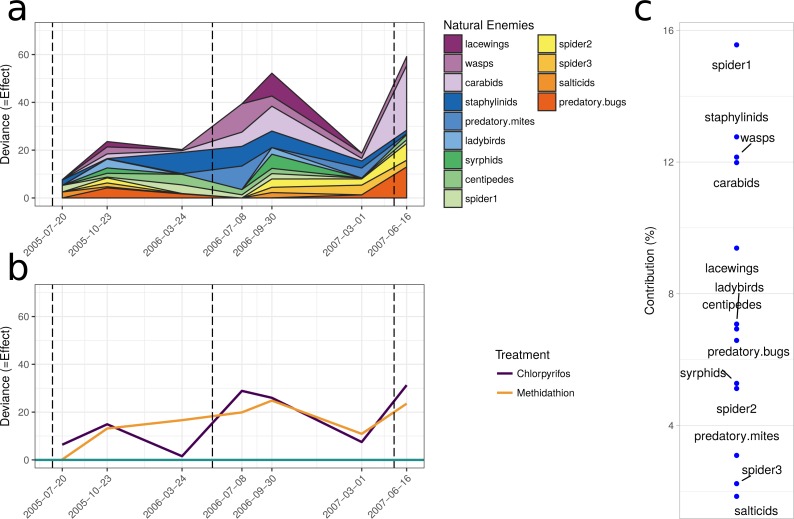
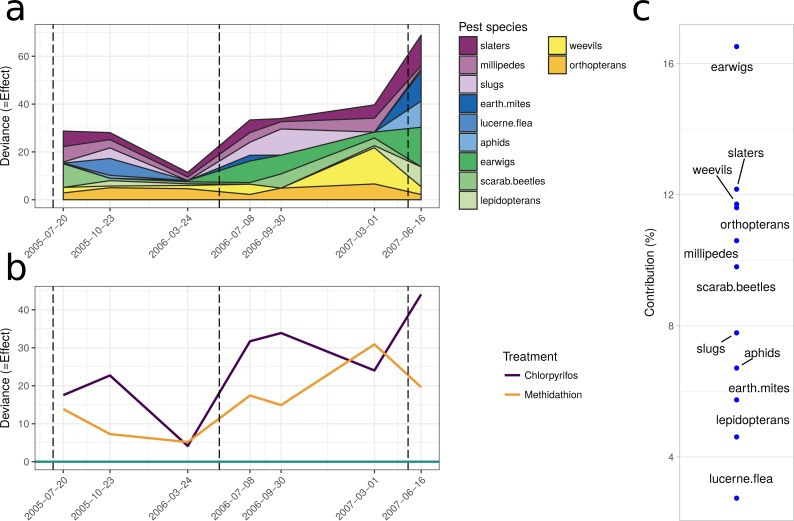
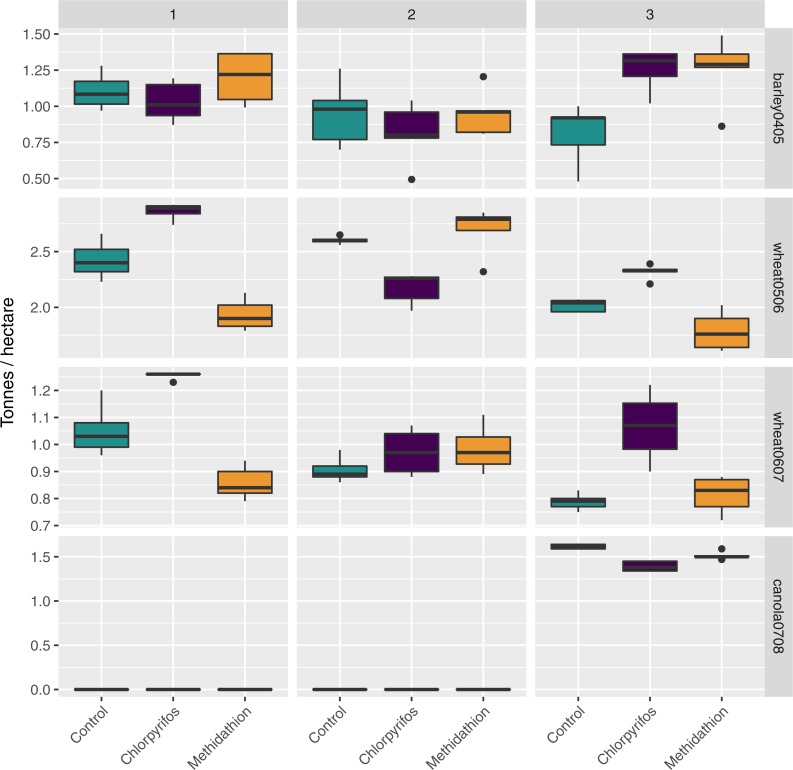
Results: There was large variability due to seasonality and crop type. Nevertheless, both pest (e.g., mites and aphids) and natural enemy (e.g., predatory beetles) invertebrate communities were significantly affected by application of organophosphates. When the rate of chlorpyrifos was increased there was a reduction in the number of beetles that predate on slug populations. Slugs displayed opposite trends to many of the other target pests, and actually increased in numbers under the higher rates of chlorpyrifos in comparison to the other treatments. Slug numbers in the final rotation of canola resulted in significant yield loss regardless of pesticide application.
Discussion: Organophosphates are a cost-effective tool to control emergent pests in broad-acre arable systems in Australia. We found risks associated with prophylactic application in fields under rotation between different crop types and significant changes to the community of pests and natural enemy. Disrupting key predators reduced effective suppression of other pests, such as slugs, and may lead to secondary outbreaks when rotating with susceptible crops such as canola. Such non-target impacts are rarely documented when studies focus on single-species, rather than community assessments. This study represents a single demonstration of how pesticide application can lead to secondary outbreaks and reinforces the need for studies that include a longer temporal component to understand this process further.
Keywords: Community ecology; Organophosphate; Pesticide; Pestsuppression; Secondary outbreak.
Conflict of interest statement
The authors declare there are no competing interests.
Figures
References
-
- Altieri MA, Nicholls CI. Biodiversity and pest management in agrosystems. 2nd edition CRC Press; Boca Raton: 2004.
-
- Bale JS, Ekebuisi M, Wright C. Effect of seed bed preparation, soil structure and release time on the toxicity of a range of grassland pesticides to the carabid beetle Pterostichus melanarius (Ill.) (Col., Carabidae) using a microplot technique. Journal of Applied Entomology. 1992;113(1–5):175–182. doi: 10.1111/j.1439-0418.1992.tb00651.x. - DOI
-
- Brust GE, Stinner BR, McCartney DA. Tillage and soil insecticide effects on predator-black cutworm (Lepidoptera: Noctuidae) interactions in corn agroecosystems. Journal of Economic Entomology. 1985;78:389–1392.
-
- Cockfield SD, Potter DA. Short-term effects of insecticidal applications on predaceous arthropods and oribatid mites in Kentucky bluegrass turf. Environmental Entomology. 1983;12(4):1260–1264. doi: 10.1093/ee/12.4.1260. - DOI
Associated data
LinkOut - more resources
Full Text Sources
Other Literature Sources
Research Materials
