. 2018 Apr;19(2):163-180.
doi: 10.1007/s10162-017-0649-1. Epub 2018 Jan 4.

Robust Neuronal Discrimination in Primary Auditory Cortex Despite Degradations of Spectro-temporal Acoustic Details: Comparison Between Guinea Pigs with Normal Hearing and Mild Age-Related Hearing Loss

Affiliations

Robust Neuronal Discrimination in Primary Auditory Cortex Despite Degradations of Spectro-temporal Acoustic Details: Comparison Between Guinea Pigs with Normal Hearing and Mild Age-Related Hearing Loss

Yonane Aushana et al. J Assoc Res Otolaryngol. 2018 Apr.

Abstract

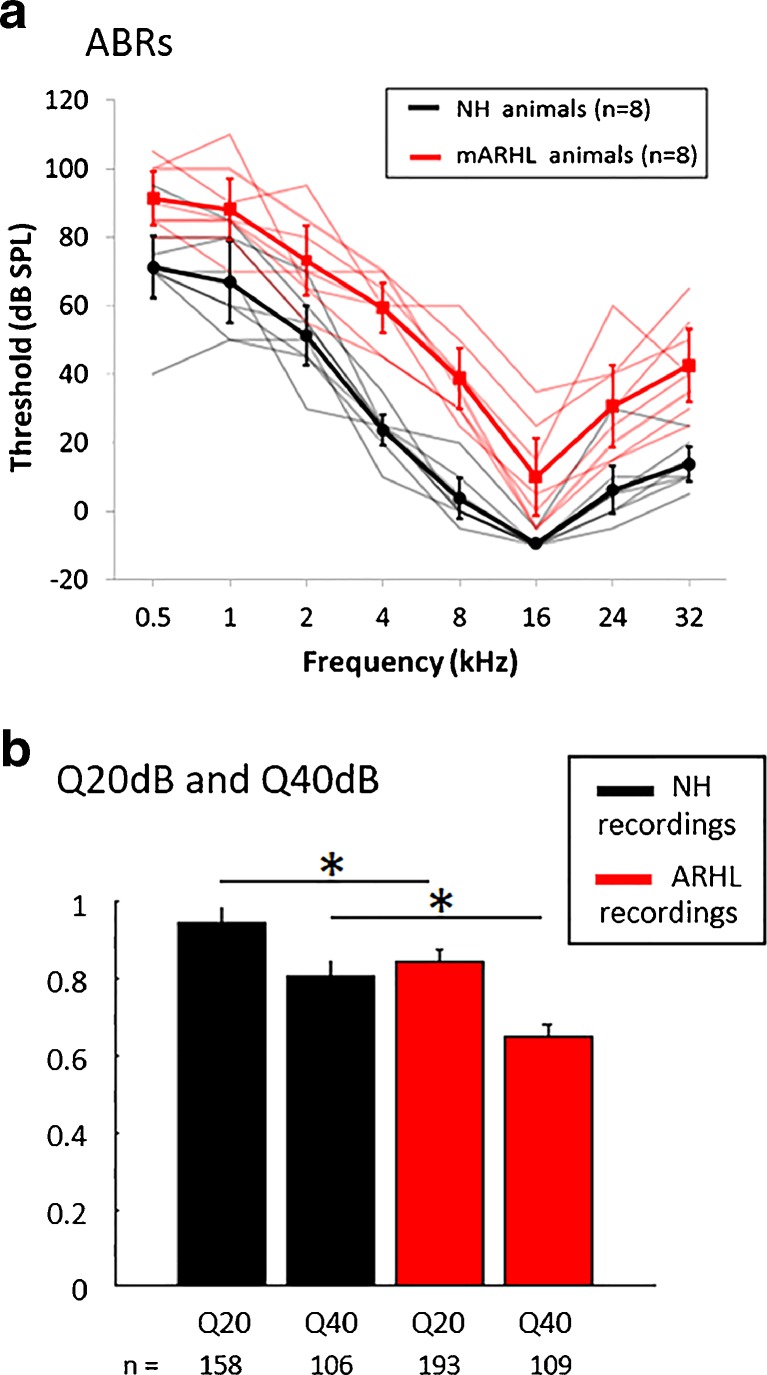
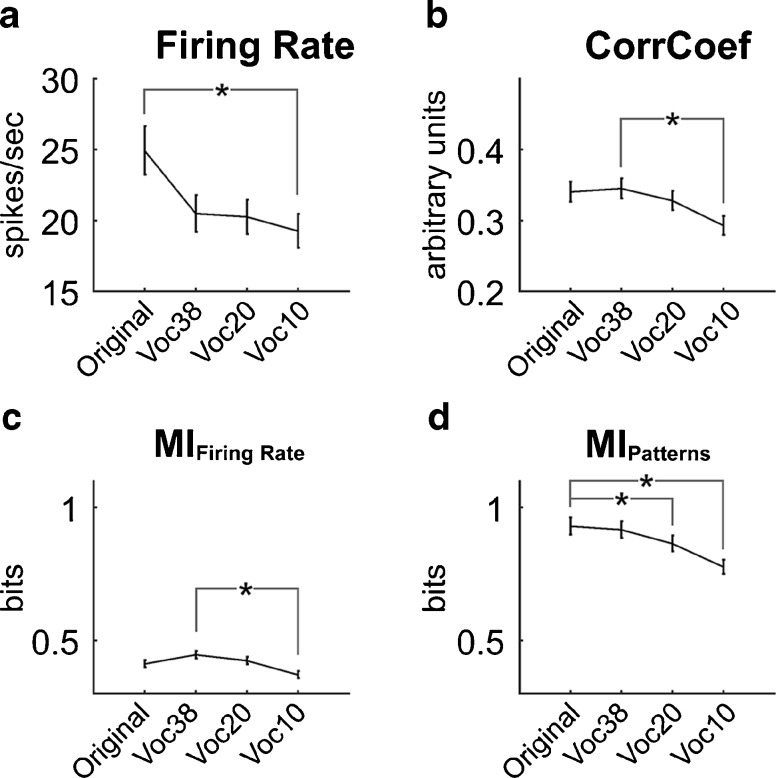
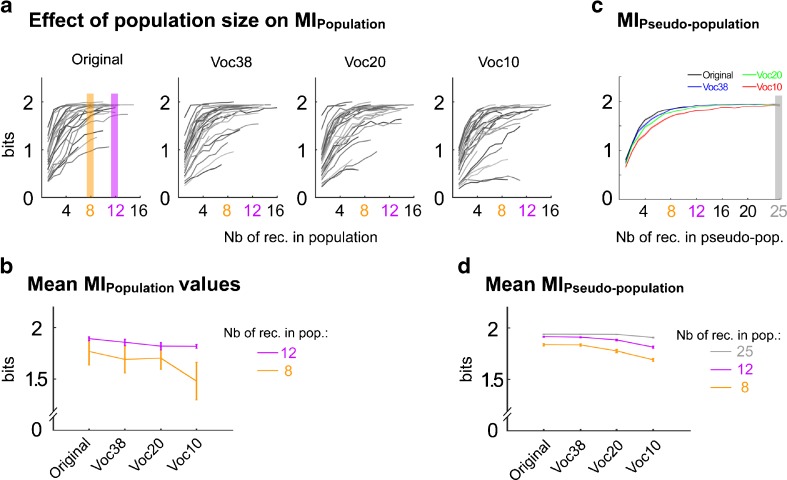
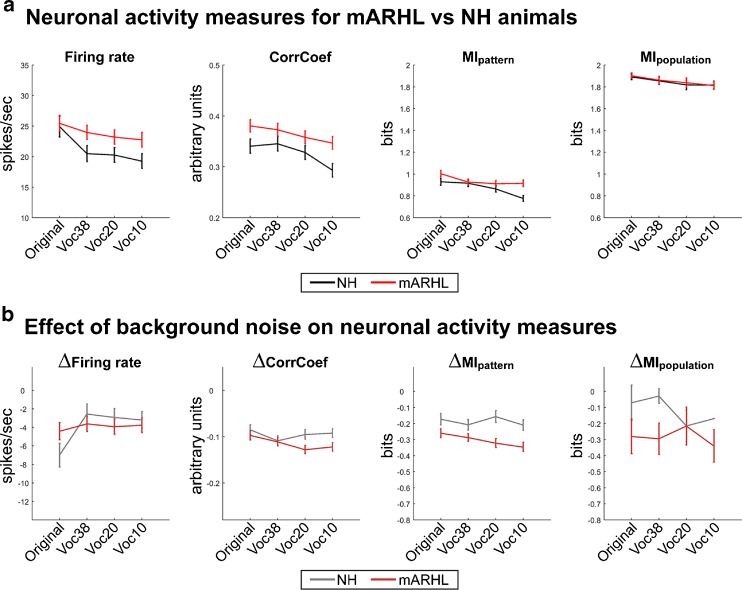
This study investigated to which extent the primary auditory cortex of young normal-hearing and mild hearing-impaired aged animals is able to maintain invariant representation of critical temporal-modulation features when sounds are submitted to degradations of fine spectro-temporal acoustic details. This was achieved by recording ensemble of cortical responses to conspecific vocalizations in guinea pigs with either normal hearing or mild age-related sensorineural hearing loss. The vocalizations were degraded using a tone vocoder. The neuronal responses and their discrimination capacities (estimated by mutual information) were analyzed at single recording and population levels. For normal-hearing animals, the neuronal responses decreased as a function of the number of the vocoder frequency bands, so did their discriminative capacities at the single recording level. However, small neuronal populations were found to be robust to the degradations induced by the vocoder. Similar robustness was obtained when broadband noise was added to exacerbate further the spectro-temporal distortions produced by the vocoder. A comparable pattern of robustness to degradations in fine spectro-temporal details was found for hearing-impaired animals. However, the latter showed an overall decrease in neuronal discrimination capacities between vocalizations in noisy conditions. Consistent with previous studies, these results demonstrate that the primary auditory cortex maintains robust neural representation of temporal envelope features for communication sounds under a large range of spectro-temporal degradations.

Keywords: auditory cortex; electrophysiology; envelope; fine structure; neural discrimination performance; spike timing; vocoder.


Figures

FIG. 1
FIG. 1
Original and vocoded whistles. a First row shows the time-waveform of the four whistle stimuli. Their spectrogram is plotted on the second row. b The three rows represent the spectrogram of the vocoded version of the four whistle stimuli for each vocoder processing. The first row uses 38 bands, the second 20 bands, the third 10 bands
FIG. 2
FIG. 2
Brainstem and cortical thresholds for normal and mild age-related hearing loss animals. a Thresholds (in dB SPL) for the Auditory Brainstem Responses (ABRs) of the Normal Hearing (NH, in dark) and mild Age-Related Hearing Loss (mARHL, in red) animals. For each group, the group data are represented by the thick line with the SEM and the data from each animal are represented by the thin lighter lines. b Mean values (± sem) of the Q20dB and Q40dB of cortical neurons estimated in NH and mARHL animals. The number of recordings in each group is indicated on the bars
FIG. 3
FIG. 3
Rasterplots for six-neuron recordings in response to reference and vocoded versions of each whistle. First row shows the six-neuron recordings in response to the original whistles (different whistles on each column). For each subplot, individual neuron’s APs are either in red or blue to distinguish between different neurons (1 to 6). Shaded area corresponds to spontaneous activity before stimulus presentation. Second to fourth rows show the responses to the vocoded whistles (38 to 10 bands). Last row shows the waveforms of the whistles. Mean values of Firing rate (Fr) and CorrCoef (averaged over the six neurons and the four stimuli) are presented at the end of each row
FIG. 4
FIG. 4
Group data for normal-hearing animals. Each subplot represents the mean (and standard error of the mean) value of a measure of neuronal activity for original whistles and vocoded versions (Vocoded 38, 20, 10 bands). a Firing rate, b CorrCoef, c MIFiring Rate, d MIPatterns. Stars represent a significant difference between original and vocoded (38, 20, or 10), as computed with post-hoc pairwise tests corrected for multiple comparisons with the Bonferroni method
FIG. 5
FIG. 5
MutuaI Information (MI) computed for a population of recordings. a MI as a function of the size of the population. X-axis represents the number of recordings in the population. Each curve is a given recording (maximum 16 simultaneous recordings). A MI value of 2 corresponds to perfect discrimination of whistles. Shaded colored bars (orange and pink) refer to populations of 8 or 12 simultaneous recordings (see b). b Mean values of MIPopulation computed with 12 (pink line) or 8 (orange line) recordings for each set of stimuli (original and vocoded whistles with 38, 20, and 10 bands). c MIpseudo-population as a function of the size of the population. Same axes as in A. Red, green, blue, and black curves represent the different stimuli (Original, Voc38, Voc20, Voc10). MIPseudo-population values for 8 (orange), 12 (pink), and 25 (gray) recordings were extracted to be plotted in d. d Mean values of MIPseudo-population computed with 8 (orange line), 12 (pink line), or 25 (gray line) recordings for each set of stimuli (original whistles, vocoded 38, 20, 10 bands)
FIG. 6
FIG. 6
Effects of mild age-related hearing loss and background noise on vocoding. a Average neural activity measure (from left to right: firing rate, CorrCoef, MIPattern, MIPopulation) computed from the responses to original whistles and vocoded versions (Vocoded 38, 20, 10 bands) for normal hearing animals (NH, black lines), and mild age-related hearing loss animals (mARHL, red lines). b Mean differences between responses to noisy and quiet whistles. For each recording, the neural activity measure (from left to right: Δfiring rate, ΔCorrCoef, ΔMIPattern, ΔMIPopulation) evoked in the quiet condition is subtracted from its value evoked by the noisy condition. Means of the differences are plotted in gray for NH animals, and in light red for mARHL animals. Bars represent the standard error of the mean

References

    1. Alain C, Roye A, Salloum C. Effects of age-related hearing loss and background noise on neuromagnetic activity from auditory cortex. Front Syst Neurosci. 2014;8:8. doi: 10.3389/fnsys.2014.00008. - DOI - PMC - PubMed
    1. Apoux F, Healy EW. Relative contribution of target and masker temporal fine structure to the unmasking of consonants in noise. J Acoust Soc Am. 2011;130(6):4044–4052. doi: 10.1121/1.3652888. - DOI - PMC - PubMed
    1. Apoux F, Yoho SE, Youngdahl CL, Healy EW. Role and relative contribution of temporal envelope and fine structure cues in sentence recognition by normal-hearing listeners. J Acoust Soc Am. 2013;134(3):2205–2212. doi: 10.1121/1.4816413. - DOI - PMC - PubMed
    1. Baskent D. Speech recognition in normal hearing and sensorineural hearing loss as a function of the number of spectral channels. J Acoust Soc Am. 2006;120(5):2908–2925. doi: 10.1121/1.2354017. - DOI - PubMed
    1. Belin P, Zatorre RJ, Lafaille P, Ahad P, Pike B. Voice-selective areas in human auditory cortex. Nature. 2000;403(6767):309–312. doi: 10.1038/35002078. - DOI - PubMed

Publication types

LinkOut - more resources