

Considerations for Secondary Prevention of Nutritional Deficiencies in High-Risk Groups in High-Income Countries
- PMID: 29304025
- PMCID: PMC5793275
- DOI: 10.3390/nu10010047
Considerations for Secondary Prevention of Nutritional Deficiencies in High-Risk Groups in High-Income Countries
Abstract
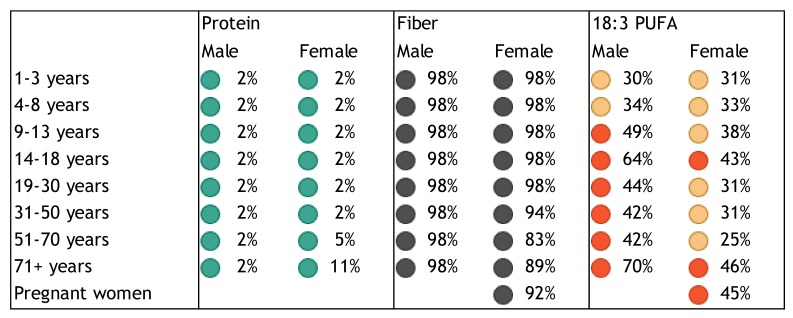
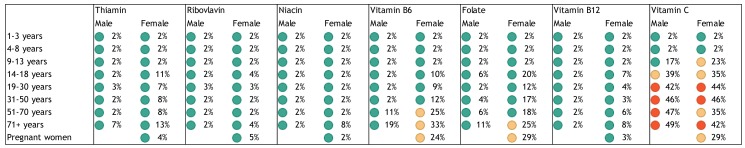
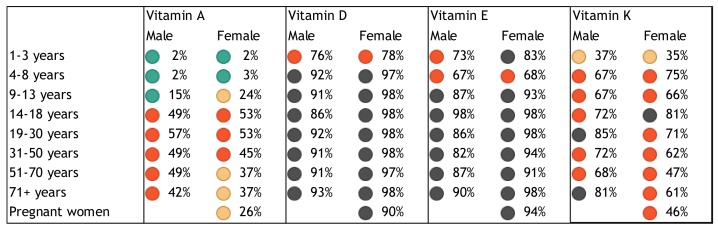
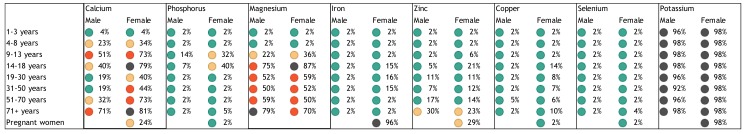
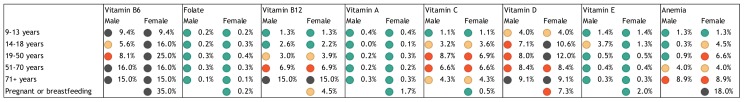
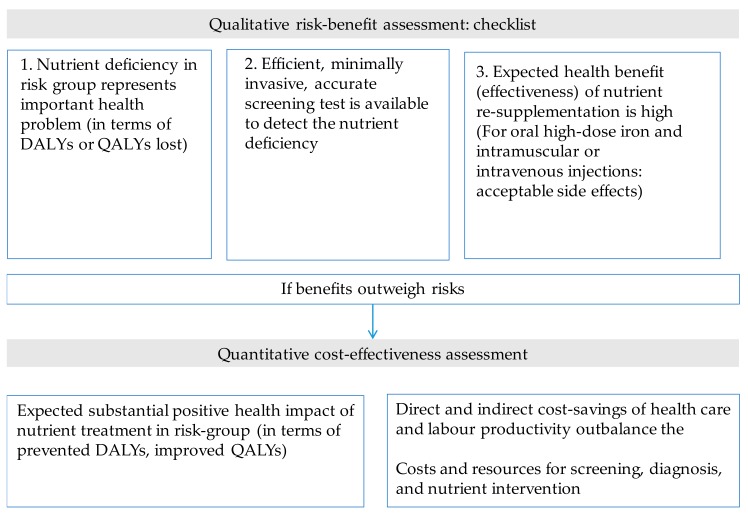
Surveys in high-income countries show that inadequacies and deficiencies can be common for some nutrients, particularly in vulnerable subgroups of the population. Inadequate intakes, high requirements for rapid growth and development, or age- or disease-related impairments in nutrient intake, digestion, absorption, or increased nutrient losses can lead to micronutrient deficiencies. The consequent subclinical conditions are difficult to recognize if not screened for and often go unnoticed. Nutrient deficiencies can be persistent despite primary nutrition interventions that are aimed at improving dietary intakes. Secondary prevention that targets groups at high risk of inadequacy or deficiency, such as in the primary care setting, can be a useful complementary approach to address persistent nutritional gaps. However, this strategy is often underestimated and overlooked as potentially cost-effective means to prevent future health care costs and to improve the health and quality of life of individuals. In this paper, the authors discuss key appraisal criteria to consider when evaluating the benefits and disadvantages of a secondary prevention of nutrient deficiencies through screening.
Keywords: biomarkers; cost-effectiveness; nutrient inadequacies and deficiencies; nutrition screening; nutritional supplements; public health.
Conflict of interest statement
The authors are employed by DSM Nutritional Products, a manufacturer of vitamins and supplier to the food, dietary supplement, and pharmaceutical industries. There were no other conflicts of interest.
Figures
Similar articles
-
Contribution of Dietary Supplements to Nutritional Adequacy by Socioeconomic Subgroups in Adults of the United States.Nutrients. 2017 Dec 22;10(1):4. doi: 10.3390/nu10010004. Nutrients. 2017. PMID: 29271883 Free PMC article.
-
Home fortification of foods with multiple micronutrient powders for health and nutrition in children under two years of age (Review).Evid Based Child Health. 2013 Jan;8(1):112-201. doi: 10.1002/ebch.1895. Evid Based Child Health. 2013. PMID: 23878126 Review.
-
Nutrition inequities in Canada.Appl Physiol Nutr Metab. 2010 Apr;35(2):172-9. doi: 10.1139/H10-002. Appl Physiol Nutr Metab. 2010. PMID: 20383227
-
Nutritional status as assessed by nutrient intakes and biomarkers among women of childbearing age--is the burden of nutrient inadequacies growing in America?Public Health Nutr. 2015 Jun;18(9):1658-69. doi: 10.1017/S1368980014002067. Epub 2014 Oct 13. Public Health Nutr. 2015. PMID: 25307479 Free PMC article.
-
Approaches to improving micronutrient status assessment at the population level.Proc Nutr Soc. 2019 May;78(2):170-176. doi: 10.1017/S0029665118002781. Epub 2019 Jan 15. Proc Nutr Soc. 2019. PMID: 30642406 Review.
Cited by
-
Nutritional intake of sport undergraduates in Sabaragamuwa University of Sri Lanka.BMC Nutr. 2023 Jan 2;9(1):2. doi: 10.1186/s40795-022-00662-0. BMC Nutr. 2023. PMID: 36593516 Free PMC article.
-
Micronutrient intakes in the Dutch diet: foods, fortified foods and supplements in a cross sectional study.Eur J Nutr. 2023 Dec;62(8):3161-3179. doi: 10.1007/s00394-023-03219-4. Epub 2023 Aug 5. Eur J Nutr. 2023. PMID: 37542641 Free PMC article.
-
Nutritional Deficiencies Before and After Bariatric Surgery in Low- and High-Income Countries: Prevention and Treatment.Cureus. 2024 Feb 27;16(2):e55062. doi: 10.7759/cureus.55062. eCollection 2024 Feb. Cureus. 2024. PMID: 38550458 Free PMC article. Review.
-
Enhancing immunity in viral infections, with special emphasis on COVID-19: A review.Diabetes Metab Syndr. 2020 Jul-Aug;14(4):367-382. doi: 10.1016/j.dsx.2020.04.015. Epub 2020 Apr 16. Diabetes Metab Syndr. 2020. PMID: 32334392 Free PMC article.
-
Optimal Nutritional Status for a Well-Functioning Immune System Is an Important Factor to Protect against Viral Infections.Nutrients. 2020 Apr 23;12(4):1181. doi: 10.3390/nu12041181. Nutrients. 2020. PMID: 32340216 Free PMC article. Review.
References
-
- Boyle M.A., Holben D.H. Community Nutrition in Action: An Entrepreneurial Approach. 5th ed. Wadsworth; Belmont, CA, USA: 2010.
-
- Pfeiffer C.M., Sternberg M.R., Schleicher R.L., Haynes B.M., Rybak M.E., Pirkle J.L. The CDC’s second national report on biochemical indicators of diet and nutrition in the U.S. Population is a valuable tool for researchers and policy makers. J. Nutr. 2013;143:938S–947S. doi: 10.3945/jn.112.172858. - DOI - PMC - PubMed
Publication types
MeSH terms
LinkOut - more resources
Full Text Sources
Other Literature Sources
Medical
