

EDI OCT evaluation of choroidal thickness in Stargardt disease
- PMID: 29304098
- PMCID: PMC5755895
- DOI: 10.1371/journal.pone.0190780
EDI OCT evaluation of choroidal thickness in Stargardt disease
Abstract
Purpose: Choroidal thickness (CT) evaluation with EDI-OCT in Stargardt Disease (STGD), considering its possible association with some clinical features of the disease.
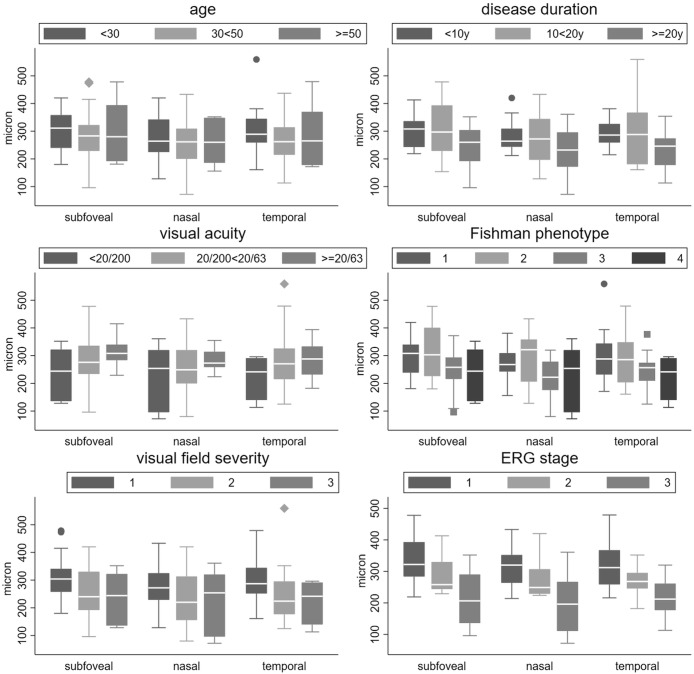
Methods: CT was evaluated in 41 STGD patients and in 70 controls. Measurements were performed in the subfoveal position and at 1000 μm nasally and temporally. CT average values in STGD and in the control group were first compared by means of Student's T test. Then, the possible association between CT and some clinical features was evaluated by means of linear regression analysis. Considered clinical parameters were: age, age on onset, duration of the disease, visual acuity, foveal thickness, Fishman clinical phenotype, visual field loss and ERG response.
Results: Average CT was not significantly different between controls and STGD patients. In the STGD group the correlation between CT and age (r = 0.22, p = 0.033) and age of onset (r = 0.05, p = 0.424) was modest, while that of CT with disease duration (r = 0.30, p<0.001) was moderate. CT and foveal thickness were also significantly but modestly correlated (r = 0.15, p = 0.033).
Conclusion: In our series average CT is not significantly changed in STGD in comparison with the controls. Nevertheless a choroidal thinning may be identified in the more advanced stages of the disease.
Conflict of interest statement
Figures
References
-
- Blacharski PA. Fundus flavimaculatus In: Newsome DA ed. Retinal Dystrophies and Degenerations. Clinic New York: Raven Press; 1988:135–159.
-
- Yatsenko AN, Shroyer NF, Lewis RA, Lupski JR. Late-onset Stargardt disease is associated with missense mutations that map outside known functional regions of ABCR (ABCA4). Hum Genet. 2001. April;108(4):346–55. - PubMed
-
- Westeneng-van Haaften SC, Boon CJ, Cremers FP, Hoefsloot LH, den Hollander AI, Hoyng CB. Clinical and genetic characteristics of late-onset Stargardt’s disease. Ophthalmology. 2012. June;119(6):1199–210. doi: 10.1016/j.ophtha.2012.01.005 - DOI - PubMed
-
- Testa F, Rossi S, Sodi A, Passerini I, Di Iorio V, Della Corte M, et al. Correlation between photoreceptor layer integrity and visual function in patients with Stargardt disease: implications for gene therapy. Invest Ophthalmol Vis Sci. 2012. July 3; 53(8):4409–15. doi: 10.1167/iovs.11-8201 - DOI - PMC - PubMed
MeSH terms
Substances
LinkOut - more resources
Full Text Sources
Other Literature Sources
Medical
