. 2018 Jan;118(1):63-71.
doi: 10.1160/TH17-02-0138. Epub 2018 Jan 5.

Thromboelastometry and Platelet Function during Acclimatization to High Altitude

Affiliations

Thromboelastometry and Platelet Function during Acclimatization to High Altitude

Alistair S Rocke et al. Thromb Haemost. 2018 Jan.

Erratum in

Abstract

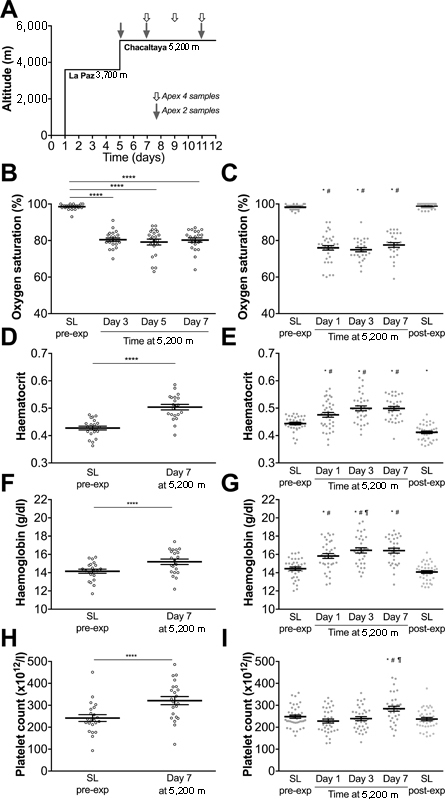
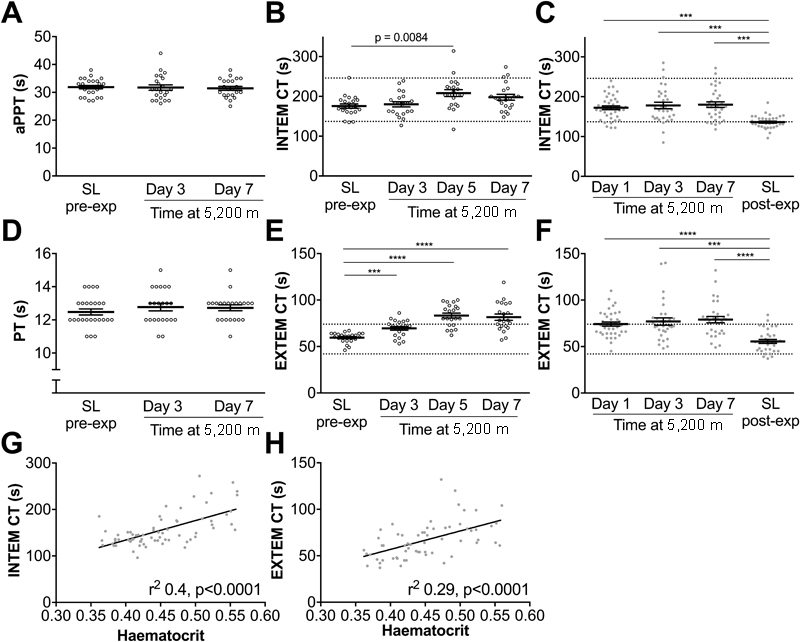
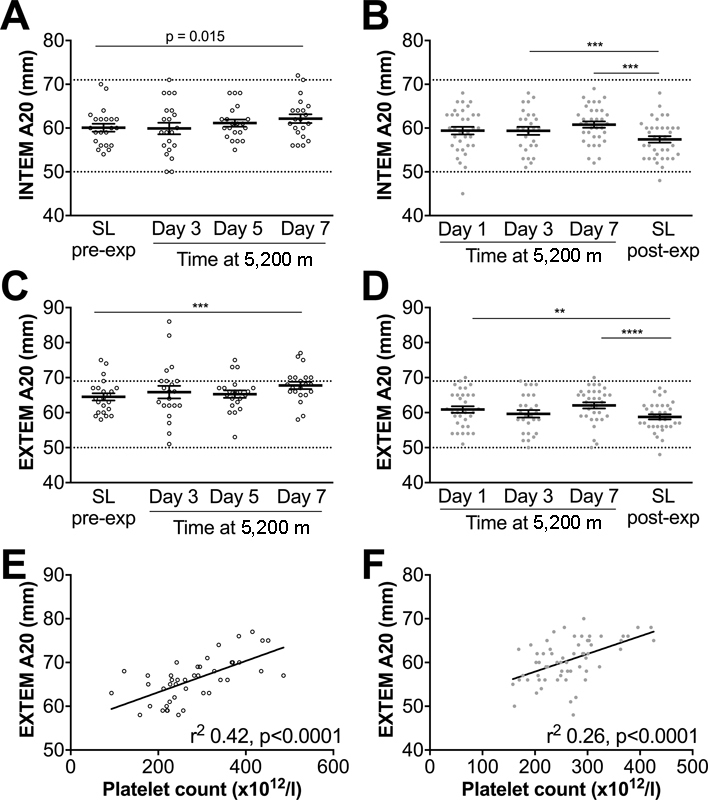
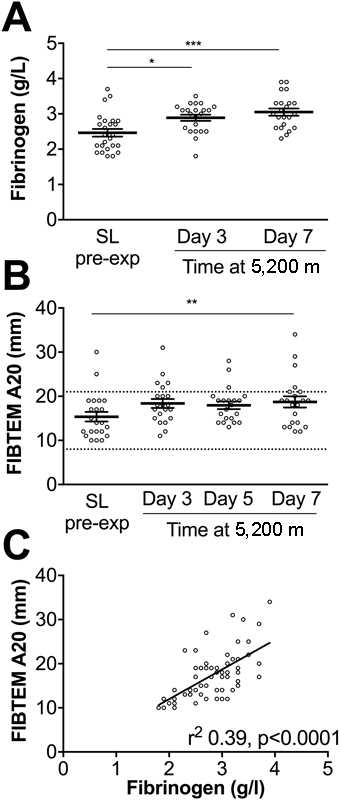
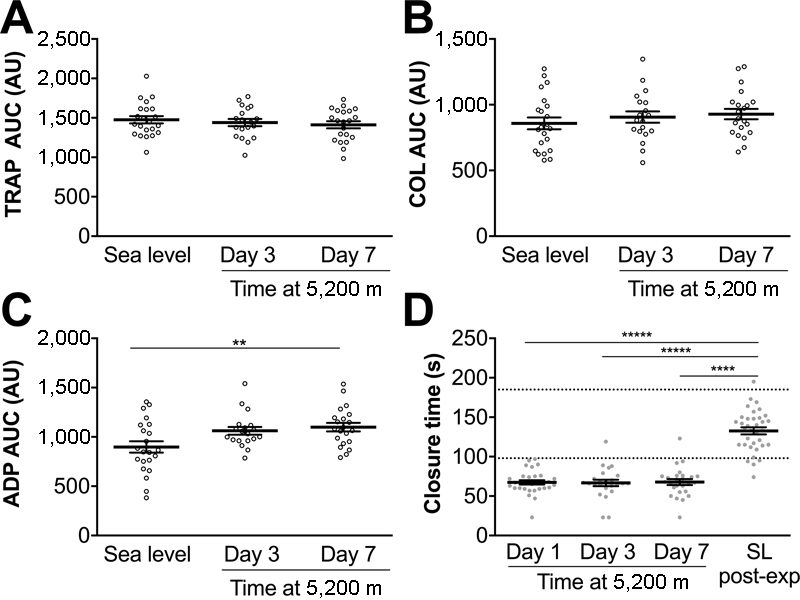
Interaction between hypoxia and coagulation is important given the increased risk of thrombotic diseases in chronically hypoxic patients who reside at sea level and in residents at high altitude. Hypoxia alters the proteome of platelets favouring a prothrombotic phenotype, but studies of activation and consumption of specific coagulation factors in hypoxic humans have yielded conflicting results. We tested blood from 63 healthy lowland volunteers acclimatizing to high altitude (5,200 m) using thromboelastometry and assays of platelet function to examine the effects of hypoxia on haemostasis. Using data from two separate cohorts of patients following identical ascent profiles, we detected a significant delay in clot formation, but increased clot strength by day 7 at 5,200 m. The latter finding may be accounted for by the significant rise in platelet count and fibrinogen concentration that occurred during acclimatization. Platelet function assays revealed evidence of platelet hyper-reactivity, with shortened PFA-100 closure times and increased platelet aggregation in response to adenosine diphosphate. Post-expedition results were consistent with the normalization of coagulation following descent to sea level. These robust findings indicate that hypoxia increases platelet reactivity and, with the exception of the paradoxical delay in thromboelastometry clotting time, suggest a prothrombotic phenotype at altitude. Further work to elucidate the mechanism of platelet activation in hypoxia will be important and could impact upon the management of patients with acute or chronic hypoxic respiratory diseases who are at risk of thrombotic events.


Conflict of interest statement

Conflicts of interest: A. Nimmo has received expenses for attending meetings and speaker's honoraria from TEM International. None of the other authors declares any conflicts of interest.

Figures

Fig. 1
Fig. 1
Oxygen saturation, haematocrit, haemoglobin concentration and platelet count on two expeditions (Apex 2 and Apex 4) to 5,200 m. ( A ) Patients on both expeditions were exposed to an identical ascent profile. Timing of blood samples at altitude are indicated by shaded arrows (Apex 2) and open arrows (Apex 4). ( B, C ) Peripheral oxygen saturations measured at rest on Apex 2 ( C ) and Apex 4 ( B ). ( D–I ) Blood was collected at the time points indicated on Apex 4 ( D, F, H ) and Apex 2 ( E, G, I ), and haematocrit ( D, E ), haemoglobin concentration ( F, G ) and platelet count ( H, I ) were analysed using automated clinical analysers. Data are mean (horizontal bars) ± SEM. SL, sea level. Apex 2 data points are represented by closed circles; Apex 4 data points are represented by open circles. ( B, D, F, H ) **** p  < 0.0001 using paired t -tests. ( C, E, G, I ) * p  < 0.005 versus SL pre-expedition, # p  < 0.005 versus SL post-expedition, p  < 0.005 versus day 1 at 5,200 m using paired t -tests corrected for multiple comparisons using Bonferroni method, p  < 0.005 accepted as significant. ( B ) Significance level of p  < 0.0083 or ( D, F, H ) p  < 0.05 accepted as significant.
Fig. 2
Fig. 2
Hypobaric hypoxia prolongs clotting time (CT) assessed by thromboelastometry. ( A, D ) aPTT and PT were measured using citrated plasma collected on Apex 4. Whole blood was analysed using thromboelastometry on Apex 4 ( B, E ) and Apex 2 ( C, F ) using the coagulation activators, ellagic acid (INTEM)( B, C ) or tissue factor (EXTEM)( E, F ). CT is the time from the start of the assay until the thromboelastometry trace reaches an amplitude of 2 mm, considered to be the start of clot formation. Data are mean (horizontal bars) ± SEM. ( A–F ) *** p  < 0.001, **** p  < 0.0001 using paired t -tests corrected for multiple comparisons using the Bonferroni method, p  < 0.0083 accepted as significant. ( G, H ) Correlations between haematocrit (pooling values from sea level and day 7 at 5,200 m) and INTEM CT ( G ) and EXTEM CT ( H ) on Apex 2. Apex 2 data points are represented by closed circles, Apex 4 data points are represented by open circles. Reference ranges for thromboelastometry parameters are provided as dashed lines on each graph.
Fig. 3
Fig. 3
Thromboelastometry measurements demonstrate an increase in clot strength at 5,200 m. Whole blood was analysed using thromboelastometry on Apex 4 ( A, C ) and Apex 2 ( B, D ) using INTEM ( A, B ) or EXTEM ( C, D ). A20 is the trace amplitude after 20 minutes and is a measure of clot strength. Data are mean (horizontal bars) ± SEM. ( A-D ) *** p  < 0.001, **** p  < 0.0001 using paired t -tests corrected for multiple comparisons using the Bonferroni method, p  < 0.0083 accepted as significant. ( E, F ) Correlations between platelet count (pooling values from sea level and day 7 at 5,200 m) and EXTEM A20 on Apex 2 ( E ) and Apex 4 ( F ). Apex 2 data points are represented by closed circles; Apex 4 data points are represented by open circles. Reference ranges for thromboelastometry parameters are provided as dashed lines on each graph.
Fig. 4
Fig. 4
Increased fibrinogen and fibrin-dependent clot strength at altitude. ( A ) Fibrinogen levels were measured on Apex 4 at the time points indicated. ( B ) Whole blood thromboelastometry analysis of A20 using FIBTEM on Apex 4. Data are mean (horizontal bars) ± SEM. * p  < 0.05, ** p  < 0.01, *** p  < 0.001 using paired t -tests corrected for multiple comparisons using the Bonferroni method, (A) p  < 0.016 or ( B ) p  < 0.0083 accepted as significant. ( C ) Correlation between plasma fibrinogen concentration and FIBTEM A20 (pooling values from sea level and day 7 at 5,200 m). Reference ranges for thromboelastometry parameters are provided as dashed lines on each graph.
Fig. 5
Fig. 5
Evidence of increased platelet reactivity at 5,200 m. Platelet function was assessed on Apex 4 using Multiplate electrode aggregometry assays on whole blood activated by ( A ) thrombin receptor activating peptide (TRAP), ( B ) Collagen (COL) or (C) adenosine diphosphate (ADP). Area under the curve (AUC) represents the degree of platelet aggregation over time. ( D ) Platelet function was assessed on Apex 2 using a PFA-100 device and collagen-epinephrine cartridges. Increased platelet reactivity reduces closure time. Data are mean (horizontal bars) ± SEM. ** p  < 0.01, ***** p  < 0.00001 using paired t -tests corrected for multiple comparisons using the Bonferroni method, ( C ) p  < 0.016 or ( D ) p  < 0.0083 accepted as significant. Apex 2 data points are represented by closed circles; Apex 4 data points are represented by open circles.

References

    1. Cucinell S A, Pitts C M. Thrombosis at mountain altitudes. Aviat Space Environ Med. 1987;58(11):1109–1111. - PubMed
    1. Gupta A, Singh S, Ahluwalia T S, Khanna A. Retinal vein occlusion in high altitude. High Alt Med Biol. 2011;12(04):393–397. - PubMed
    1. Fagenholz P J, Gutman J A, Murray A F et al.Arterial thrombosis at high altitude resulting in loss of limb. High Alt Med Biol. 2007;8(04):340–347. - PubMed
    1. Schreijer A J, Cannegieter S C, Rosendaal F R, Helmerhorst F M. A case of thrombosis at high altitude. Thromb Haemost. 2005;94(05):1104–1105. - PubMed
    1. Anand A C, Jha S K, Saha A, Sharma V, Adya C M. Thrombosis as a complication of extended stay at high altitude. Natl Med J India. 2001;14(04):197–201. - PubMed