

Development of the excitation-contraction coupling machinery and its relation to myofibrillogenesis in human iPSC-derived skeletal myocytes
- PMID: 29304851
- PMCID: PMC5756430
- DOI: 10.1186/s13395-017-0147-5
Development of the excitation-contraction coupling machinery and its relation to myofibrillogenesis in human iPSC-derived skeletal myocytes
Abstract
Background: Human induced pluripotent stem cells-derived myogenic progenitors develop functional and ultrastructural features typical of skeletal muscle when differentiated in culture. Besides disease-modeling, such a system can be used to clarify basic aspects of human skeletal muscle development. In the present study, we focus on the development of the excitation-contraction (E-C) coupling, a process that is essential both in muscle physiology and as a tool to differentiate between the skeletal and cardiac muscle. The occurrence and maturation of E-C coupling structures (Sarcoplasmic Reticulum-Transverse Tubule (SR-TT) junctions), key molecular components, and Ca2+ signaling were examined, along with myofibrillogenesis.
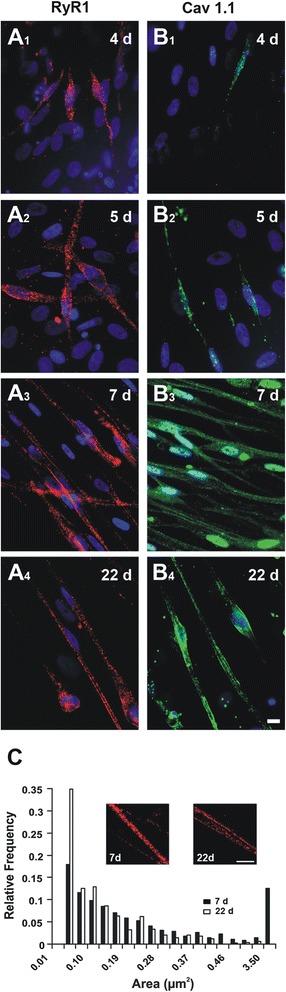
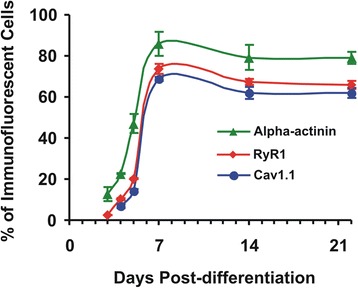
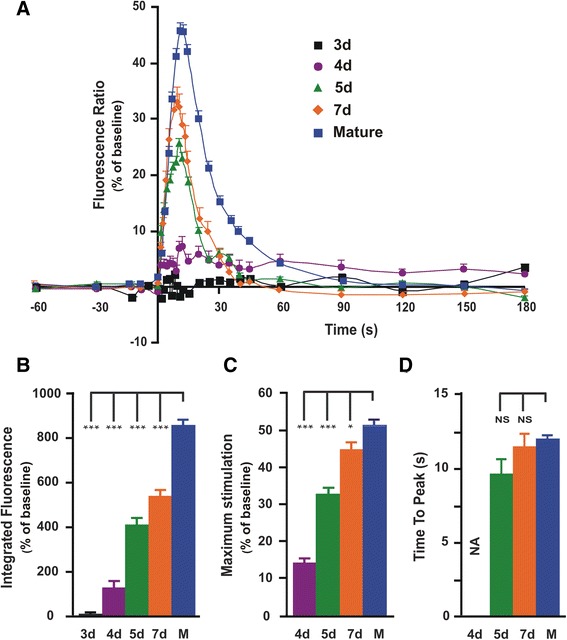
Methods: Pax7+-myogenic progenitors were differentiated in culture, and developmental changes were examined from a few days up to several weeks. Ion channels directly involved in the skeletal muscle E-C coupling (RyR1 and Cav1.1 voltage-gated Ca2+ channels) were labeled using indirect immunofluorescence. Ultrastructural changes of differentiating cells were visualized by transmission electron microscopy. On the functional side, depolarization-induced intracellular Ca2+ transients mediating E-C coupling were recorded using Fura-2 ratiometric Ca2+ imaging, and myocyte contraction was captured by digital photomicrography.
Results: We show that the E-C coupling machinery occurs and operates within a few days post-differentiation, as soon as the myofilaments align. However, Ca2+ transients become effective in triggering myocyte contraction after 1 week of differentiation, when nascent myofibrils show alternate A-I bands. At later stages, myofibrils become fully organized into adult-like sarcomeres but SR-TT junctions do not reach their triadic structure and typical A-I location. This is mirrored by the absence of cross-striated distribution pattern of both RyR1 and Cav1.1 channels.
Conclusions: The E-C coupling machinery occurs and operates within the first week of muscle cells differentiation. However, while early development of SR-TT junctions is coordinated with that of nascent myofibrils, their respective maturation is not. Formation of typical triads requires other factors/conditions, and this should be taken into account when using in-vitro models to explore skeletal muscle diseases, especially those affecting E-C coupling.
Keywords: Ca2+ signaling; Cav1.1; Excitation-contraction coupling; Human-induced pluripotent stem cells; Myofibrillogenesis; RyR1; SR-TT junctions; iPS-derived skeletal muscle cells.
Conflict of interest statement
Ethics approval and consent to participate
Not applicable.
Consent for publication
Not applicable.
Competing interests
The authors declare that they have no competing interests.
Publisher’s Note
Springer Nature remains neutral with regard to jurisdictional claims in published maps and institutional affiliations.
Figures


Similar articles
-
Physiological and ultrastructural features of human induced pluripotent and embryonic stem cell-derived skeletal myocytes in vitro.Proc Natl Acad Sci U S A. 2014 Jun 3;111(22):8275-80. doi: 10.1073/pnas.1322258111. Epub 2014 May 19. Proc Natl Acad Sci U S A. 2014. PMID: 24843168 Free PMC article.
-
Rem uncouples excitation-contraction coupling in adult skeletal muscle fibers.J Gen Physiol. 2015 Jul;146(1):97-108. doi: 10.1085/jgp.201411314. Epub 2015 Jun 15. J Gen Physiol. 2015. PMID: 26078055 Free PMC article.
-
Voltage sensing mechanism in skeletal muscle excitation-contraction coupling: coming of age or midlife crisis?Skelet Muscle. 2018 Jul 19;8(1):22. doi: 10.1186/s13395-018-0167-9. Skelet Muscle. 2018. PMID: 30025545 Free PMC article. Review.
-
De novo reconstitution reveals the proteins required for skeletal muscle voltage-induced Ca2+ release.Proc Natl Acad Sci U S A. 2017 Dec 26;114(52):13822-13827. doi: 10.1073/pnas.1716461115. Epub 2017 Dec 11. Proc Natl Acad Sci U S A. 2017. PMID: 29229815 Free PMC article.
-
Organization of junctional sarcoplasmic reticulum proteins in skeletal muscle fibers.J Muscle Res Cell Motil. 2015 Dec;36(6):501-15. doi: 10.1007/s10974-015-9421-5. Epub 2015 Sep 15. J Muscle Res Cell Motil. 2015. PMID: 26374336 Review.
Cited by
-
MBNL-dependent impaired development within the neuromuscular system in myotonic dystrophy type 1.Neuropathol Appl Neurobiol. 2023 Feb;49(1):e12876. doi: 10.1111/nan.12876. Neuropathol Appl Neurobiol. 2023. PMID: 36575942 Free PMC article.
-
Excitation-contraction coupling in mammalian skeletal muscle: Blending old and last-decade research.Front Physiol. 2022 Sep 2;13:989796. doi: 10.3389/fphys.2022.989796. eCollection 2022. Front Physiol. 2022. PMID: 36117698 Free PMC article. Review.
-
The role of dystrophin isoforms and interactors in the brain.Brain. 2025 Apr 3;148(4):1081-1098. doi: 10.1093/brain/awae384. Brain. 2025. PMID: 39673425 Free PMC article. Review.
-
Neuromuscular disease modeling on a chip.Dis Model Mech. 2020 Jul 7;13(7):dmm044867. doi: 10.1242/dmm.044867. Dis Model Mech. 2020. PMID: 32817118 Free PMC article. Review.
-
Modeling Patient-Specific Muscular Dystrophy Phenotypes and Therapeutic Responses in Reprogrammed Myotubes Engineered on Micromolded Gelatin Hydrogels.Front Cell Dev Biol. 2022 Apr 6;10:830415. doi: 10.3389/fcell.2022.830415. eCollection 2022. Front Cell Dev Biol. 2022. PMID: 35465312 Free PMC article.
References
Publication types
MeSH terms
Substances
Grants and funding
LinkOut - more resources
Full Text Sources
Other Literature Sources
Research Materials
Miscellaneous
