

Involvement of hepcidin in iron metabolism dysregulation in Gaucher disease
- PMID: 29305416
- PMCID: PMC5865418
- DOI: 10.3324/haematol.2017.177816
Involvement of hepcidin in iron metabolism dysregulation in Gaucher disease
Abstract
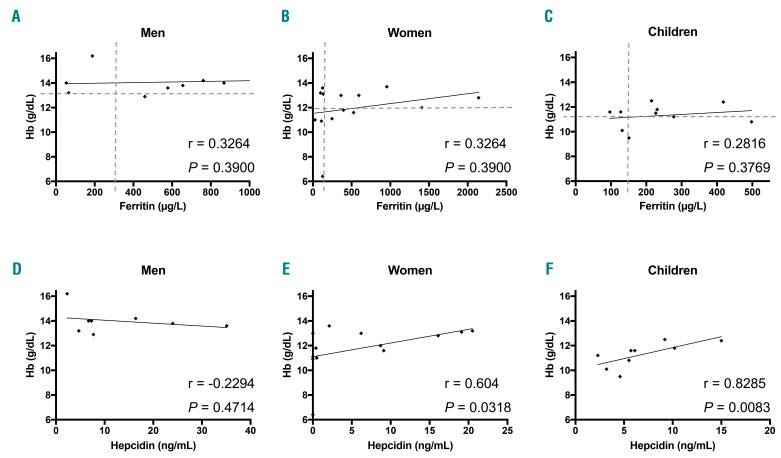
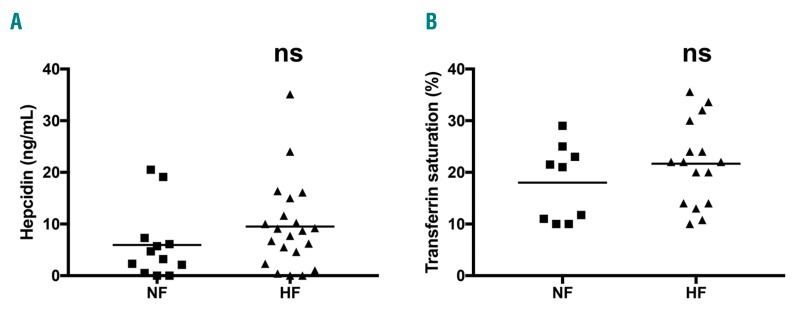
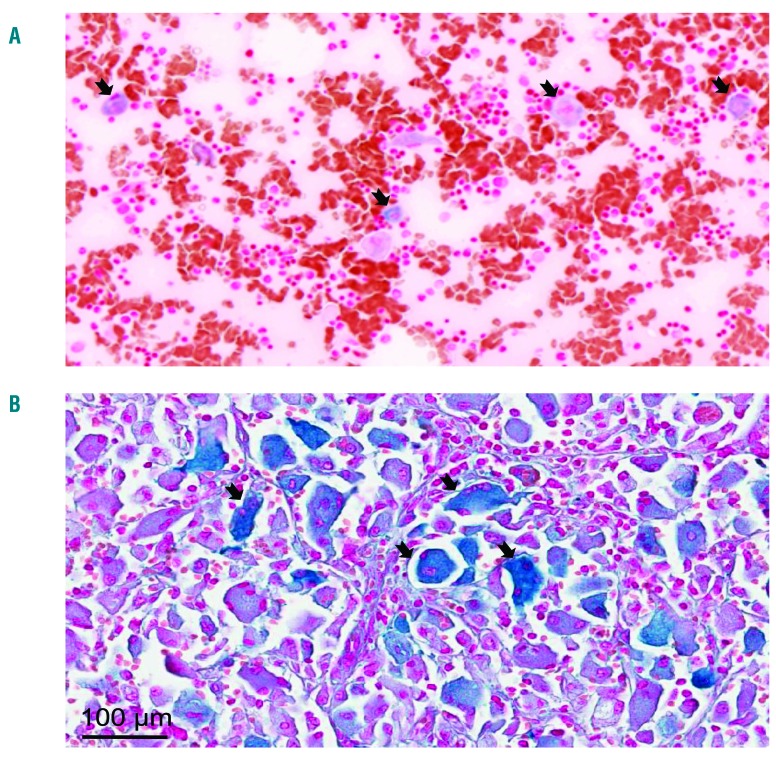
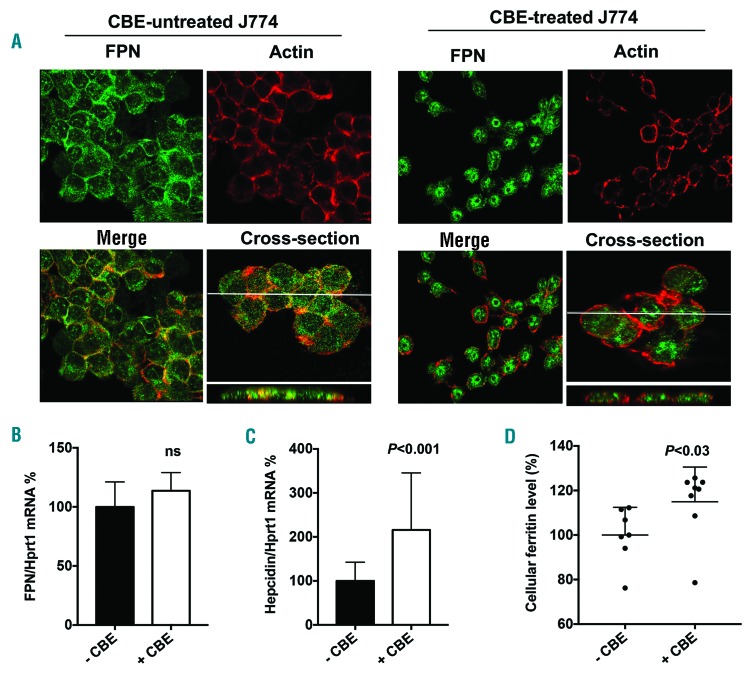
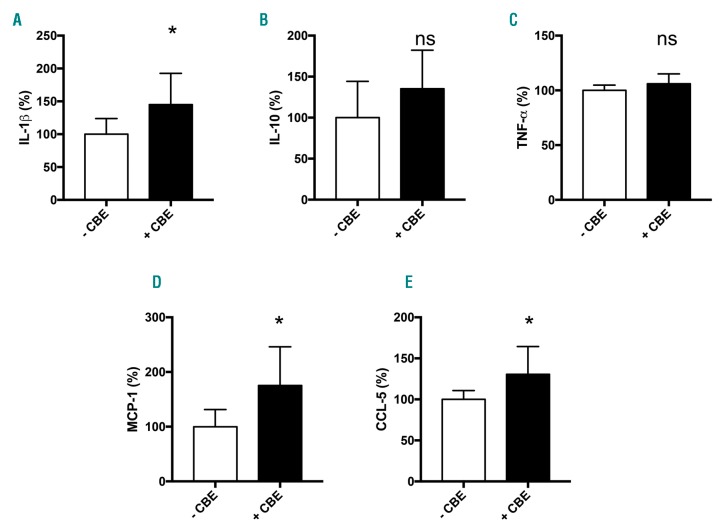
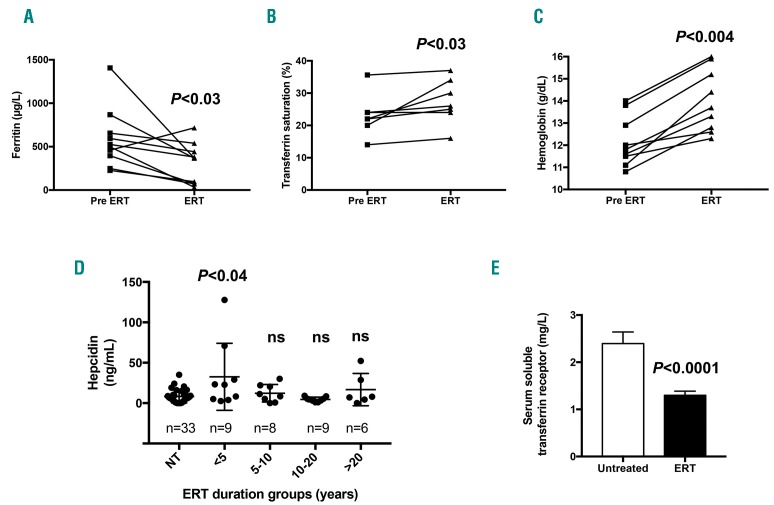
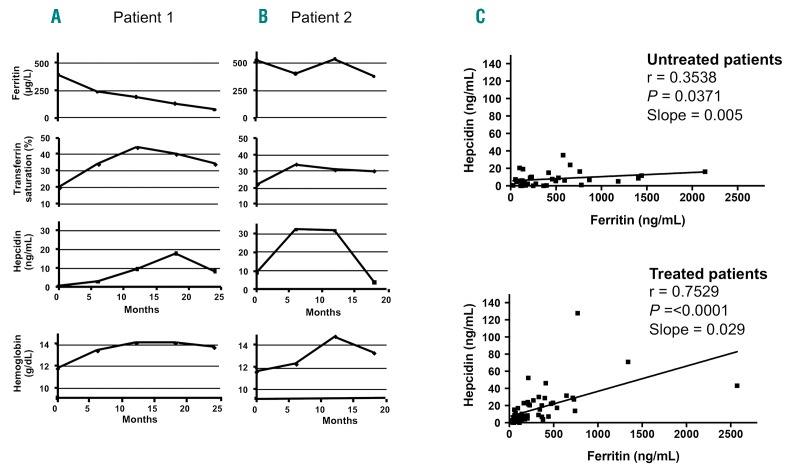
Gaucher disease (GD) is an inherited deficiency of glucocerebrosidase leading to accumulation of glucosylceramide in tissues such as the spleen, liver, and bone marrow. The resulting lipid-laden macrophages lead to the appearance of "Gaucher cells". Anemia associated with an unexplained hyperferritinemia is a frequent finding in GD, but whether this pathogenesis is related to an iron metabolism disorder has remained unclear. To investigate this issue, we explored the iron status of a large cohort of 90 type I GD patients, including 66 patients treated with enzyme replacement therapy. Ten of the patients treated with enzyme replacement were followed up before and during treatment. Serum levels of hepcidin, the iron regulatory peptide, remained within the physiological range, while the transferrin saturation was slightly decreased in children. Inflammation-independent hyperferritinemia was found in 65% of the patients, and Perl's staining of the spleen and marrow smear revealed iron accumulation in Gaucher cells. Treated patients exhibited reduced hyperferritinemia, increased transferrin saturation and transiently increased systemic hepcidin. In addition, the hepcidin and ferritin correlation was markedly improved, and, in most patients, the hemoglobin level was normalized. To further explore eventual iron sequestration in macrophages, we produce a Gaucher cells model by treating the J774 macrophage cell line with a glucocerebrosidase inhibitor and showed induced local hepcidin and membrane retrieval of the iron exporter, ferroportin. These data reveal the involvement of Gaucher cells in abnormal iron sequestration, which may explain the mechanism of hyperferritinemia in GD patients. Local hepcidin-ferroportin interaction was involved in this pathogenesis.
Copyright© 2018 Ferrata Storti Foundation.
Figures
Similar articles
-
Hyperferritinemia and iron metabolism in Gaucher disease: Potential pathophysiological implications.Blood Rev. 2016 Nov;30(6):431-437. doi: 10.1016/j.blre.2016.05.003. Epub 2016 May 27. Blood Rev. 2016. PMID: 27265538 Review.
-
Enzyme replacement therapy improves erythropoiesis and iron dysregulation in Gaucher disease.Ann Hematol. 2024 Dec;103(12):5113-5121. doi: 10.1007/s00277-024-05918-2. Epub 2024 Oct 7. Ann Hematol. 2024. PMID: 39370488
-
Ferritinemia and serum inflammatory cytokines in Swedish adults with Gaucher disease type 1.Blood Cells Mol Dis. 2018 Feb;68:35-42. doi: 10.1016/j.bcmd.2016.10.010. Epub 2016 Oct 20. Blood Cells Mol Dis. 2018. PMID: 27816428
-
Iron homeostasis and infIammatory biomarker analysis in patients with type 1 Gaucher disease.Blood Cells Mol Dis. 2014 Dec;53(4):171-5. doi: 10.1016/j.bcmd.2014.07.007. Epub 2014 Aug 18. Blood Cells Mol Dis. 2014. PMID: 25153906
-
Iron Balance and the Role of Hepcidin in Chronic Kidney Disease.Semin Nephrol. 2016 Mar;36(2):87-93. doi: 10.1016/j.semnephrol.2016.02.001. Semin Nephrol. 2016. PMID: 27236128 Free PMC article. Review.
Cited by
-
Examining the Role of a Functional Deficiency of Iron in Lysosomal Storage Disorders with Translational Relevance to Alzheimer's Disease.Cells. 2023 Nov 16;12(22):2641. doi: 10.3390/cells12222641. Cells. 2023. PMID: 37998376 Free PMC article. Review.
-
Impaired iron recycling from erythrocytes is an early hallmark of aging.Elife. 2023 Jan 31;12:e79196. doi: 10.7554/eLife.79196. Elife. 2023. PMID: 36719185 Free PMC article.
-
Effects of sphingolipids overload on red blood cell properties in Gaucher disease.J Cell Mol Med. 2020 Sep;24(17):9726-9736. doi: 10.1111/jcmm.15534. Epub 2020 Aug 7. J Cell Mol Med. 2020. PMID: 32767726 Free PMC article.
-
Real life data: follow-up assessment on Spanish Gaucher disease patients treated with eliglustat. TRAZELGA project.Orphanet J Rare Dis. 2023 Dec 15;18(1):390. doi: 10.1186/s13023-023-02939-4. Orphanet J Rare Dis. 2023. PMID: 38102667 Free PMC article.
-
HAMP Downregulation Contributes to Aggressive Hepatocellular Carcinoma via Mechanism Mediated by Cyclin4-Dependent Kinase-1/STAT3 Pathway.Diagnostics (Basel). 2019 Apr 30;9(2):48. doi: 10.3390/diagnostics9020048. Diagnostics (Basel). 2019. PMID: 31052210 Free PMC article.
References
-
- Brady RO, Kanfer JN, Shapiro D. Metabolism of glucocerebrosides. II. Evidence of an enzymatic deficiency in Gaucher’s disease. Biochem Biophys Res Commun. 1965;18:221–225. - PubMed
-
- Grabowski GA. Phenotype, diagnosis, and treatment of Gaucher’s disease. Lancet Lond Engl. 2008;372(9645):1263–1271. - PubMed
-
- Charrow J, Andersson HC, Kaplan P, et al. The Gaucher registry: demographics and disease characteristics of 1698 patients with Gaucher disease. Arch Intern Med. 2000;160(18):2835–2843. - PubMed
-
- Regenboog M, van Kuilenburg ABP, Verheij J, Swinkels DW, Hollak CEM. Hyperferritinemia and iron metabolism in Gaucher disease: Potential pathophysiological implications. Blood Rev. 2016;30(6):431–437 - PubMed
Publication types
MeSH terms
Substances
LinkOut - more resources
Full Text Sources
Other Literature Sources
Medical
