. 2018 Mar 9;293(10):3562-3587.
doi: 10.1074/jbc.M116.772699. Epub 2018 Jan 5.

Tumor stressors induce two mechanisms of intracellular P-glycoprotein-mediated resistance that are overcome by lysosomal-targeted thiosemicarbazones

Affiliations

Tumor stressors induce two mechanisms of intracellular P-glycoprotein-mediated resistance that are overcome by lysosomal-targeted thiosemicarbazones

Lina Al-Akra et al. J Biol Chem. .

Abstract

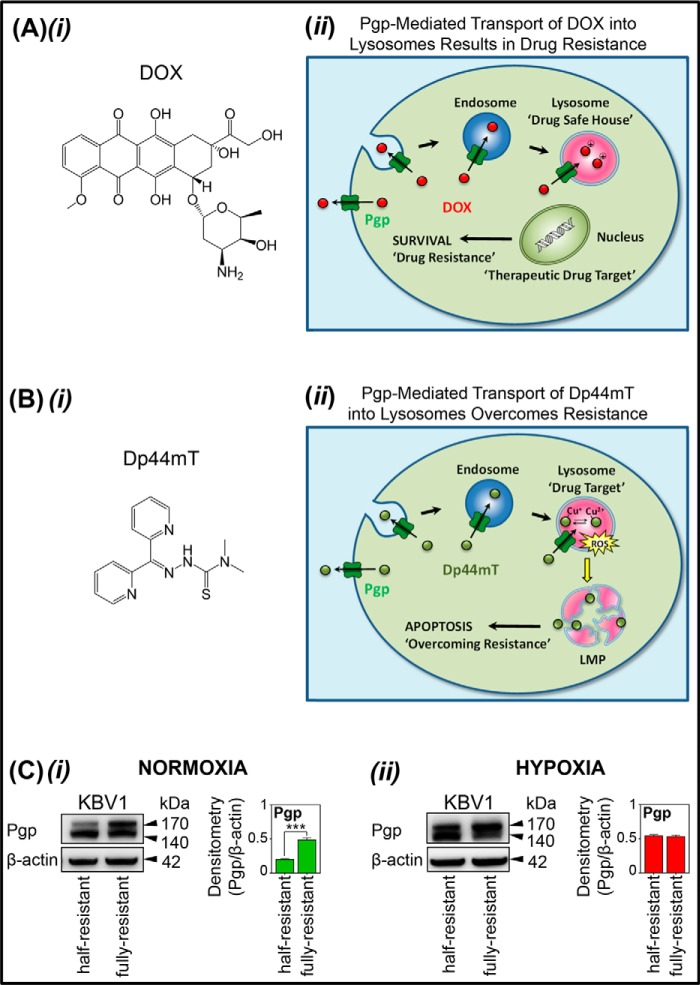
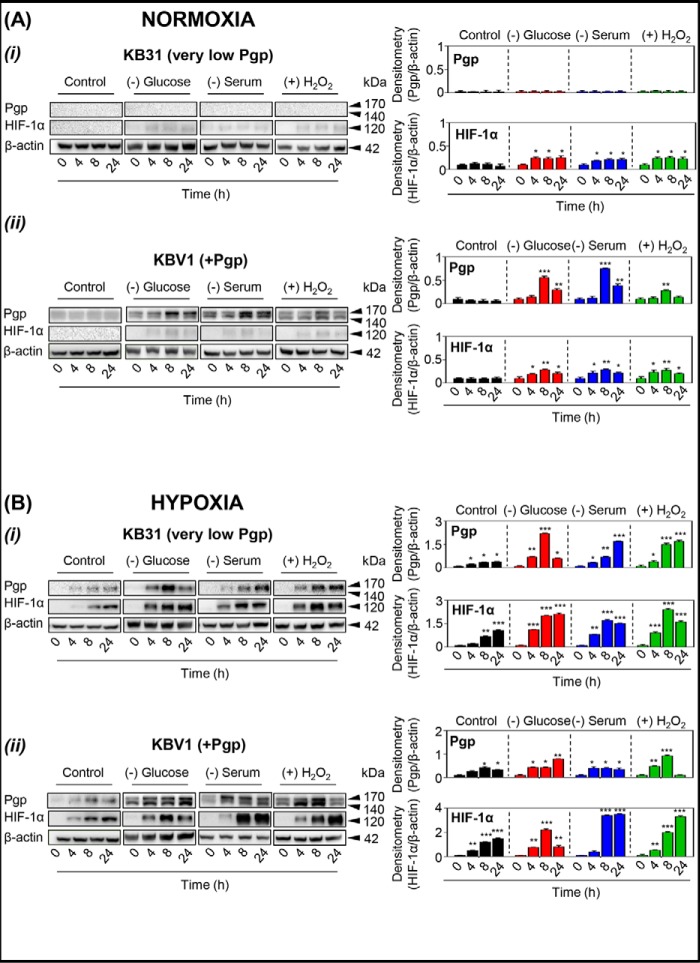
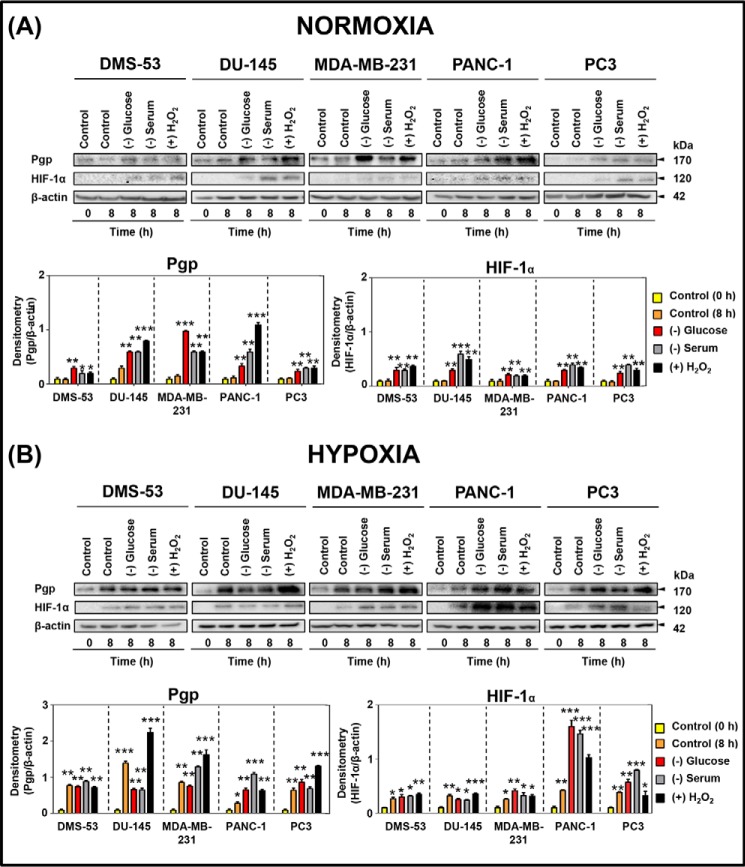
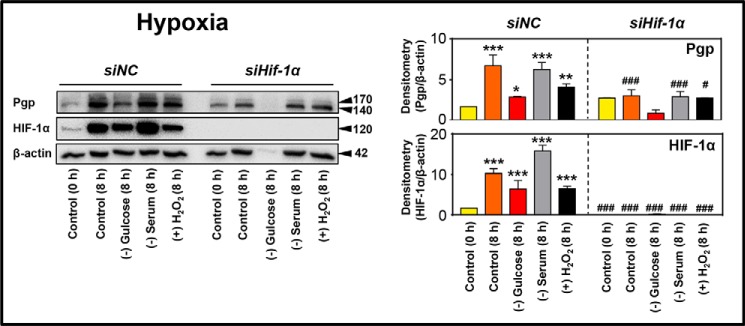
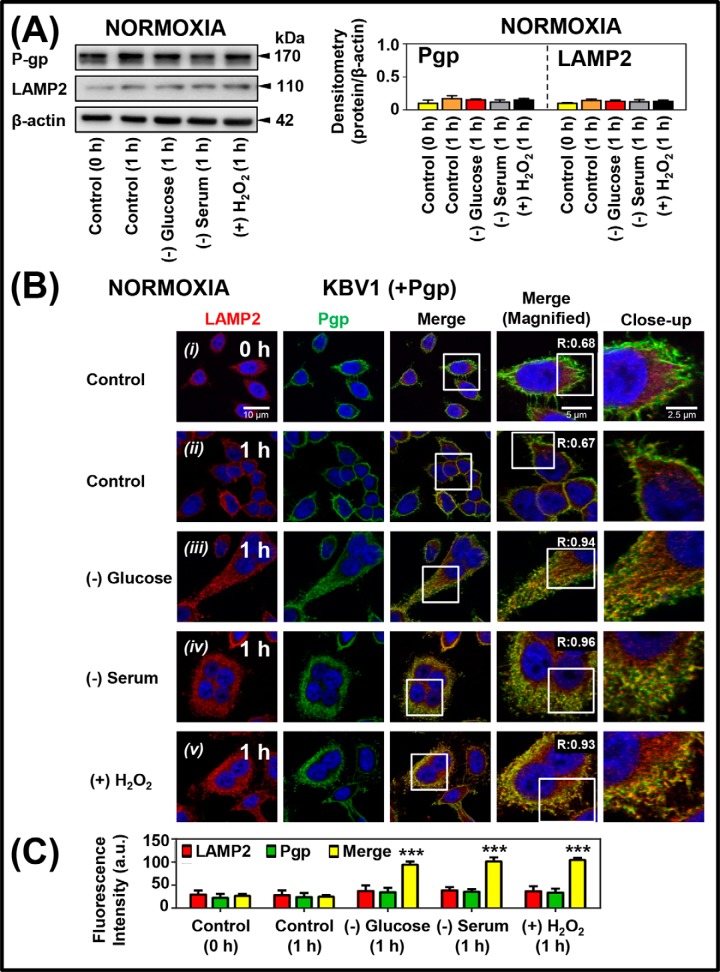
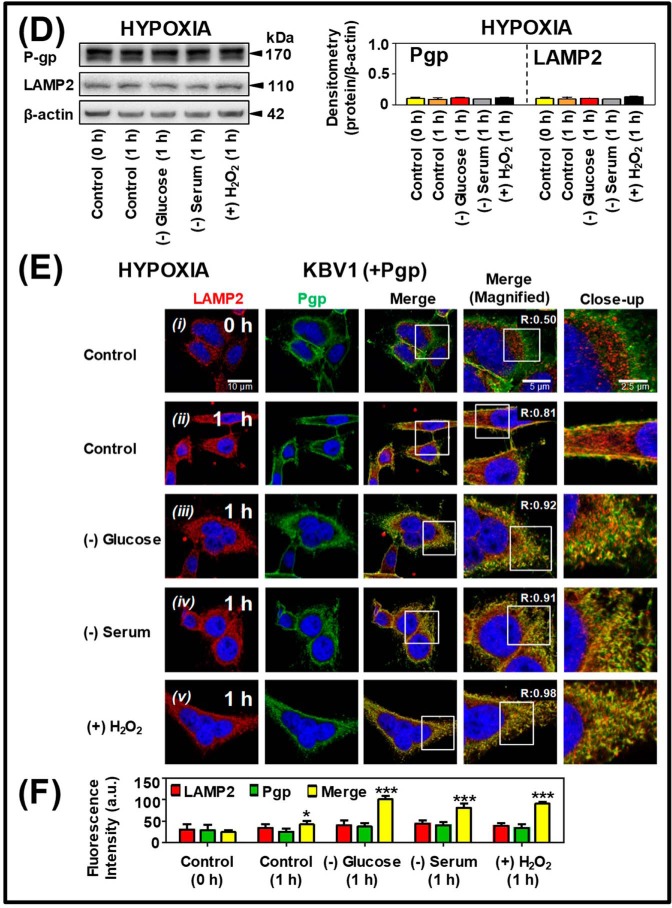
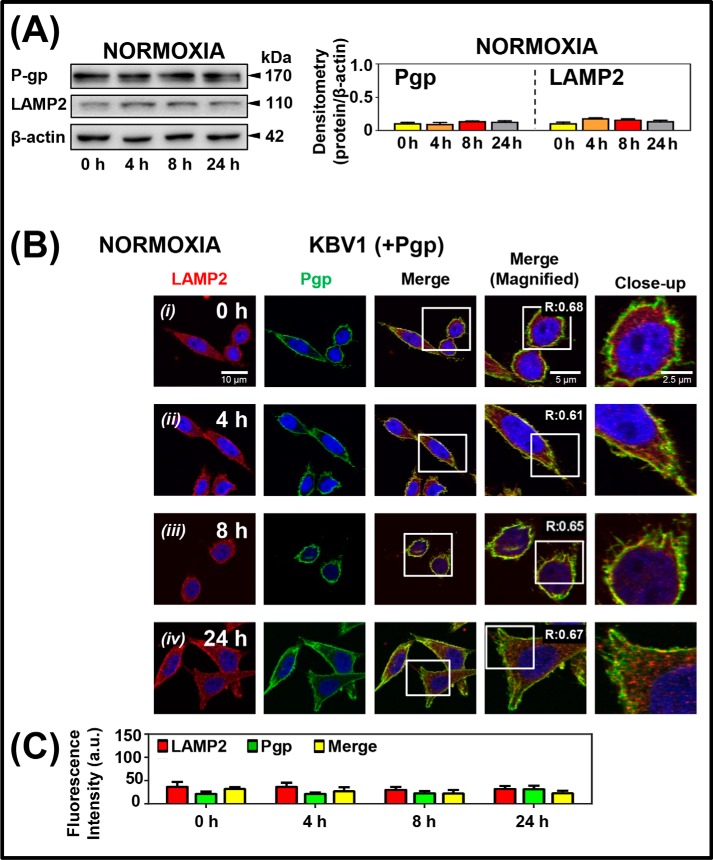
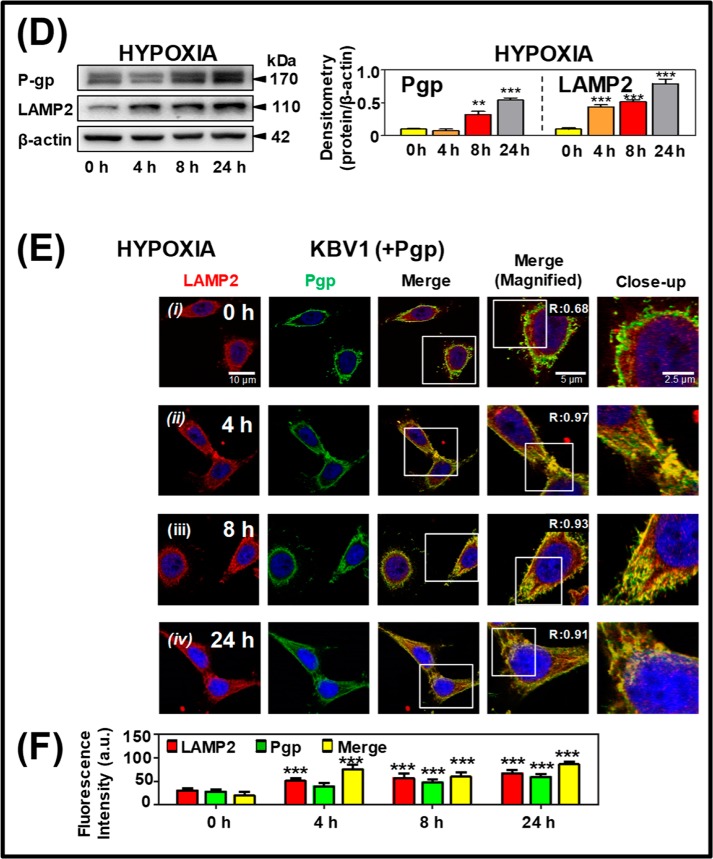
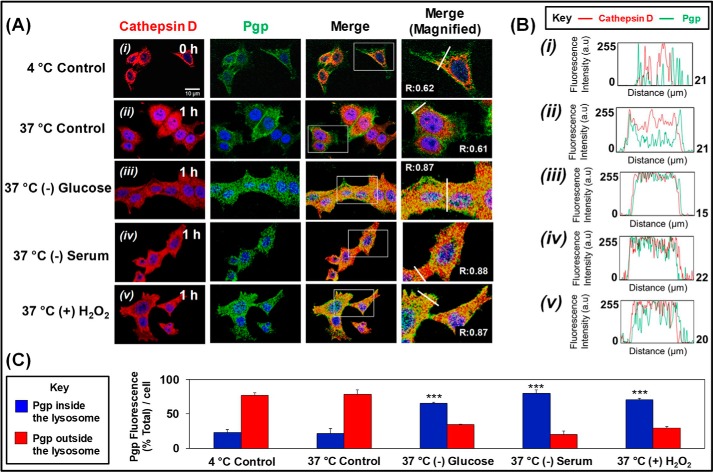
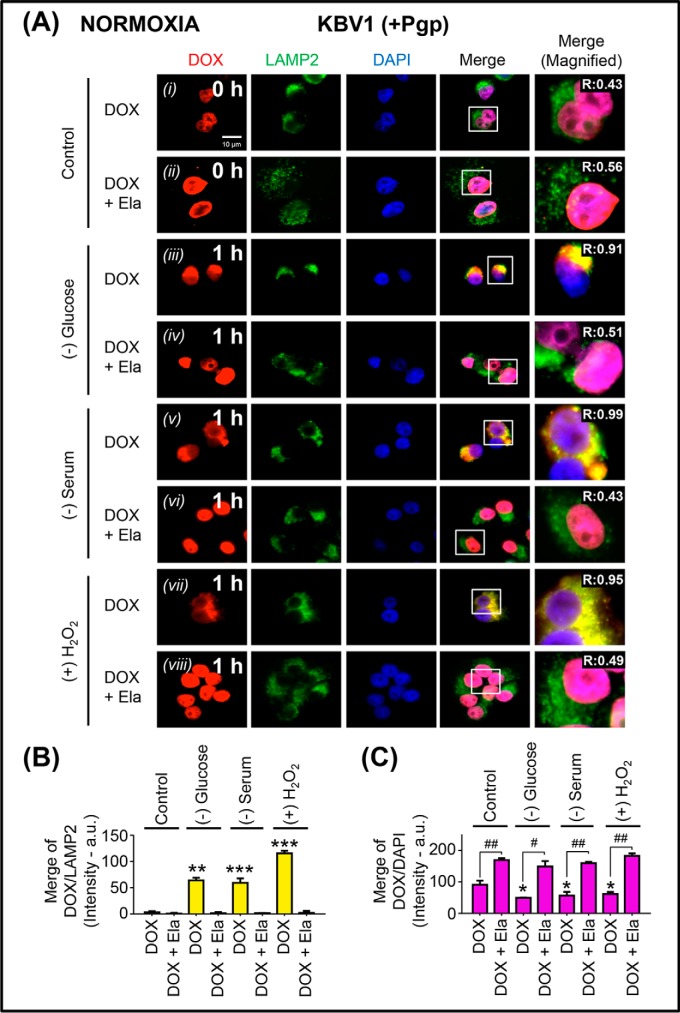
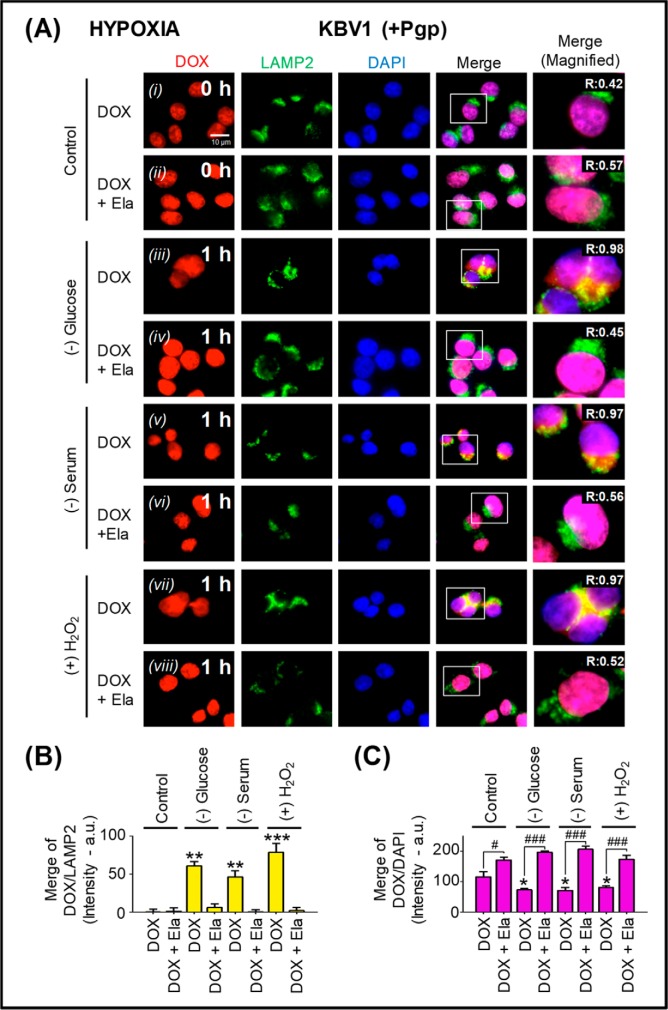
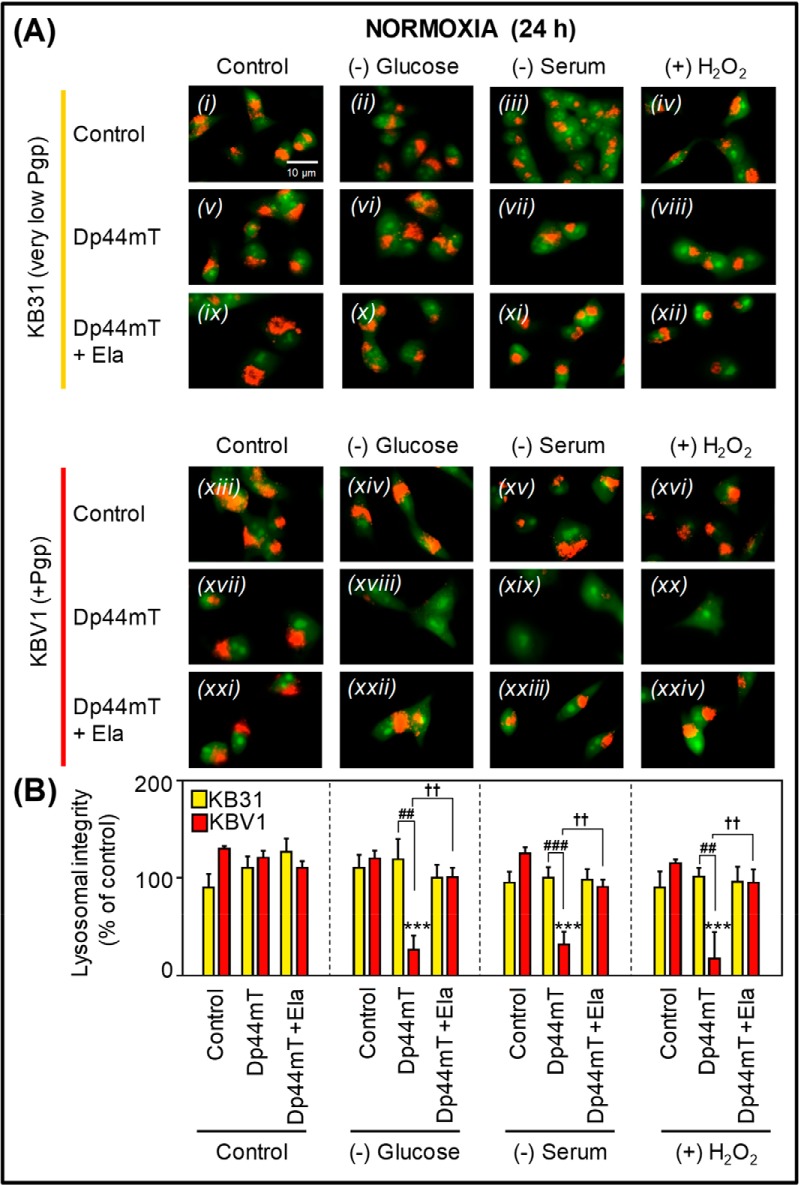
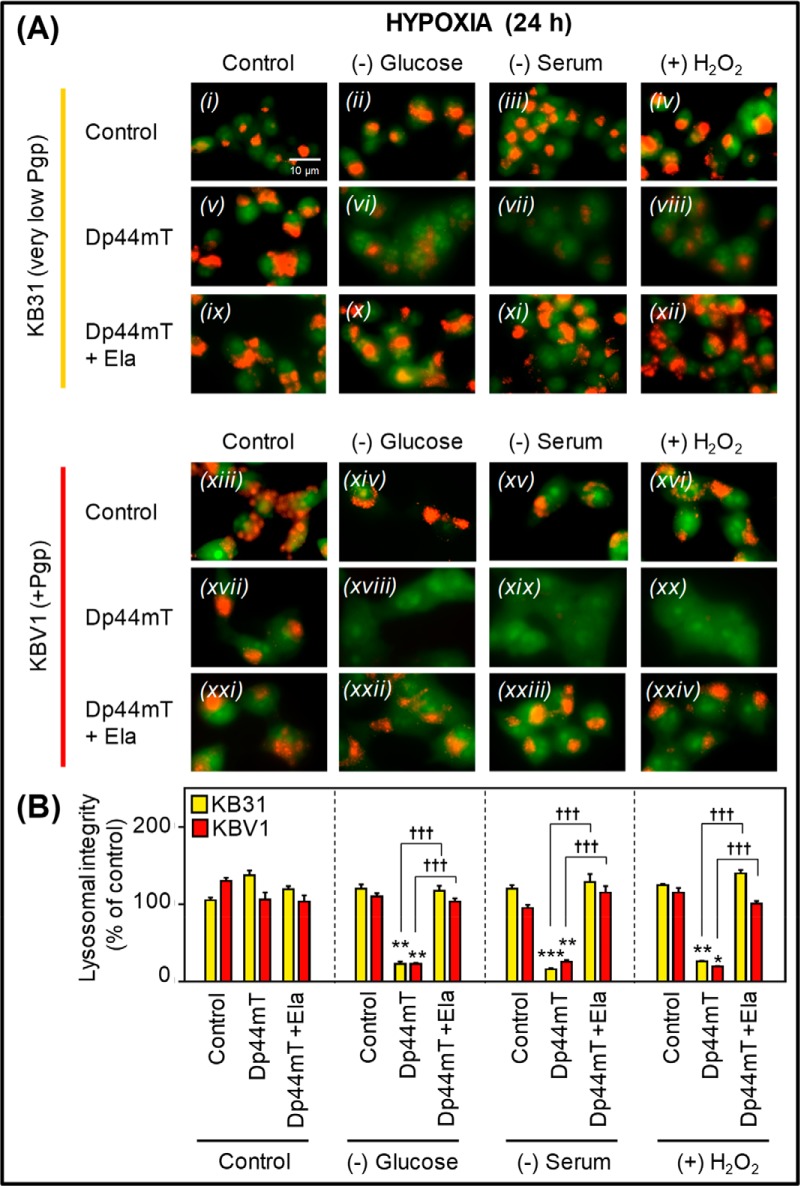
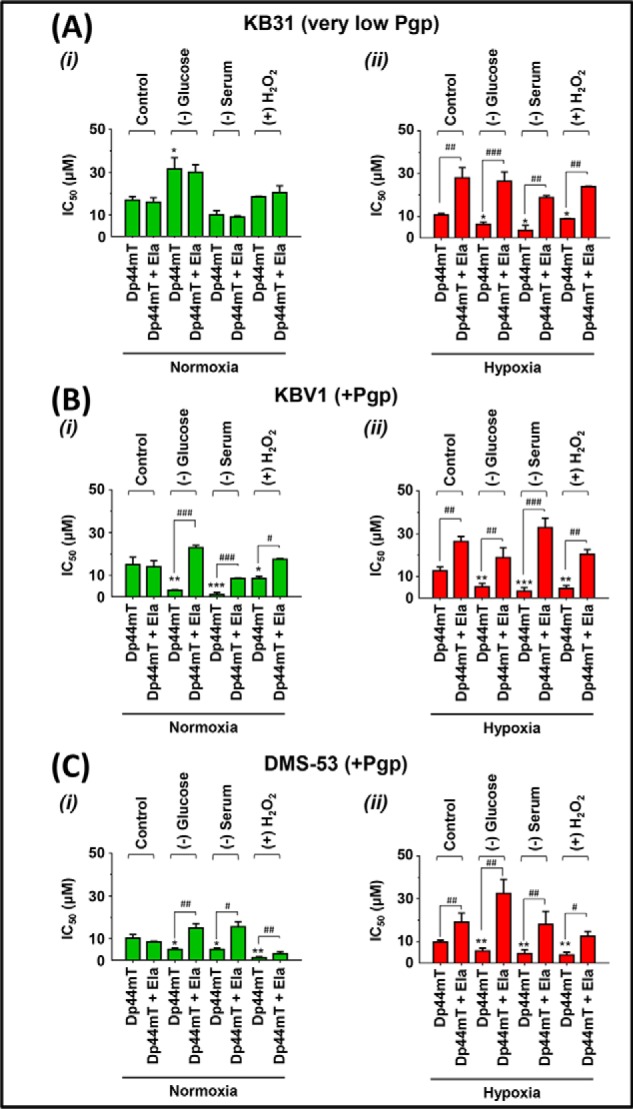
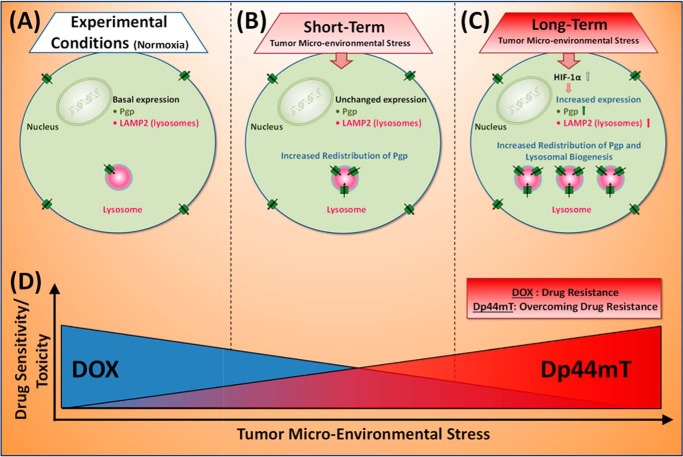
Multidrug resistance (MDR) is a major obstacle in cancer treatment due to the ability of tumor cells to efflux chemotherapeutics via drug transporters (e.g. P-glycoprotein (Pgp; ABCB1)). Although the mechanism of Pgp-mediated drug efflux is known at the plasma membrane, the functional role of intracellular Pgp is unclear. Moreover, there has been intense focus on the tumor micro-environment as a target for cancer treatment. This investigation aimed to dissect the effects of tumor micro-environmental stress on subcellular Pgp expression, localization, and its role in MDR. These studies demonstrated that tumor micro-environment stressors (i.e. nutrient starvation, low glucose levels, reactive oxygen species, and hypoxia) induce Pgp-mediated drug resistance. This occurred by two mechanisms, where stressors induced 1) rapid Pgp internalization and redistribution via intracellular trafficking (within 1 h) and 2) hypoxia-inducible factor-1α expression after longer incubations (4-24 h), which up-regulated Pgp and was accompanied by lysosomal biogenesis. These two mechanisms increased lysosomal Pgp and facilitated lysosomal accumulation of the Pgp substrate, doxorubicin, resulting in resistance. This was consistent with lysosomal Pgp being capable of transporting substrates into lysosomes. Hence, tumor micro-environmental stressors result in: 1) Pgp redistribution to lysosomes; 2) increased Pgp expression; 3) lysosomal biogenesis; and 4) potentiation of Pgp substrate transport into lysosomes. In contrast to doxorubicin, when stress stimuli increased lysosomal accumulation of the cytotoxic Pgp substrate, di-2-pyridylketone 4,4-dimethyl-3-thiosemicarbazone (Dp44mT), this resulted in the agent overcoming resistance. Overall, this investigation describes a novel approach to overcoming resistance in the stressful tumor micro-environment.

Keywords: ABCB1; P-glycoprotein; drug delivery; drug resistance; drug transport; lysosome; tumor micro-environment; tumor micro-environmental stress.


Conflict of interest statement

D. R. R. is a stakeholder in Oncochel Therapeutics LLC and Pty Ltd, which is developing the thiosemicarbazone, DpC, for the treatment of advanced and resistant cancer

Figures

Figure 1.
Figure 1.
A and B, line drawings of the structures of DOX and Dp44mT and their different mechanisms of action in terms of their interaction with intracellular Pgp in lysosomes. C, Western blots demonstrating that hypoxia increases Pgp expression in “half-resistant” KBV1 cells. A (i), line drawing of doxorubicin; A (ii), schematic showing that DOX is effluxed out of cells by Pgp but can also be transported into endosomes and lysosomes by Pgp in these organelles (14). Storage of DOX in the lysosome contributes to drug resistance to this agent, as DOX is sequestered away from its molecular targets in the nucleus (i.e. lysosomal “safe house” effect) (14). B (i), line drawing of the structure of Dp44mT. B (ii), schematic demonstrating that Pgp facilitates Dp44mT transport out of cells and into endosomes/lysosomes (15–17, 19). However, Dp44mT overcomes Pgp-mediated drug resistance by forming copper complexes that potently generate ROS (15, 17, 18). Generation of ROS causes LMP and apoptosis that leads to the death of resistant cancer cells and, thus, overcomes resistance (15, 17, 18). C (i), the Pgp level in KBV1 (half-resistant) cells is less than that in KBV1 (fully resistant cells) under normoxia (i.e. 21% O2). C (ii), the Pgp level in KBV1 (half-resistant) cells is similar to that in KBV1 (fully resistant cells) when incubated for 24 h at 37 °C under hypoxia (i.e. 1% O2). Western blots in C (i) and C (ii) are from a typical experiment of three performed. Densitometry is mean ± S.D. (error bars) (n = 3). ***, p < 0.001 relative to half-resistant cells.
Figure 2.
Figure 2.
The micro-environmental stressors, glucose starvation, serum starvation, and H2O2 stress, increase Pgp and/or HIF-1α expression in KB31 (very low Pgp) cells or Pgp-expressing KBV1 cells under normoxia or hypoxia. KB31 (very low Pgp) (A, i) and KBV1 (+Pgp) (A, ii) cells were incubated with the conditions of glucose starvation (0 μm), serum starvation (no FCS), or H2O2 stress (100 μm) under normoxia or hypoxia (B) for 0, 4, 8, and 24 h at 37 °C. Total protein was then isolated, and the expression of Pgp and HIF-1α was assessed by Western blot analysis. The Western blots are typical of three independent experiments, with the densitometric analysis representing mean ± S.D. (error bars) (n = 3). *, p < 0.05; **, p < 0.01; ***, p < 0.001, relative to the respective 0-h time point.
Figure 3.
Figure 3.
The micro-environmental stressors, glucose starvation, serum starvation, and H2O2 stress, increase Pgp and HIF-1α expression in endogenously Pgp-expressing tumor cells under normoxia and hypoxia. DMS-53, DU-145, MDA-MB-231, PANC-1, and PC3 cells were incubated under control conditions (0 or 8 h at 37 °C) or with glucose starvation (0 μm), serum starvation (no FCS), or H2O2 stress (100 μm) under normoxia (A) or hypoxia (B) for 8 h at 37 °C. Total proteins were then isolated, and the expression of Pgp and HIF-1α was assessed by Western blotting analysis. The Western blots are typical of three independent experiments, with the densitometric analysis representing mean ± S.D. (error bars) (n = 3). *, p < 0.05; **, p < 0.01; ***, p < 0.001, relative to respective 0-h control.
Figure 4.
Figure 4.
Micro-environmental stressors up-regulate Pgp via a HIF-1α–mediated pathway. HIF-1α was silenced using siHIF-1α relative to the non-targeting control siNC in KBV1 (+Pgp), and these cells were then further incubated under control conditions (0 or 8 h) or with the micro-environmental stressors, glucose starvation (0 μm), serum starvation (no FCS), and H2O2 stress (100 μm), under hypoxia for 8 h at 37 °C. Total proteins were then isolated, and Pgp and HIF-1α expression was assessed by Western blot analysis. Western blots are typical of three independent experiments, with the densitometric analysis representing mean ± S.D. (error bars) (n = 3). *, p < 0.05; **, p < 0.01; ***, p < 0.001, relative to respective 0 h control. #, p < 0.05; ###, p < 0.001, relative to its respective siNC condition.
Figure 5.
Figure 5.
Short-term micro-environmental stressors increase Pgp distribution to lysosomes under normoxia and hypoxia. KBV1 (+Pgp) cells were incubated under control conditions (0 and 1 h at 37 °C) or for 1 h at 37 °C with the micro-environmental stressors, namely glucose starvation (0 μm), serum starvation (no FCS), or H2O2 stress (100 μm) under normoxia (A–C) or hypoxia (D–F). A and D, Western blot analysis of Pgp and LAMP2 expression in KBV1 (+Pgp) cells after a 0- or 1-h incubation with control medium or the stressors under normoxia or hypoxia. Blots are from typical experiments with densitometry representing mean ± S.D. (error bars) (n = 3). B and E, cells were examined using confocal immunofluorescence microscopy, and Pgp co-localization was observed with well-characterized organelle-specific antibodies, namely anti-LAMP2 for lysosomes. Nuclei were stained with DAPI. These images are typical of three independent experiments with data analysis in C and F presented as arbitrary units (a.u.) and are the mean ± S.D. (n = 3). *, p < 0.05; ***, p < 0.001, relative to respective 0-h control. Scale bar, 10 μm; scale bar (Magnified), 5 μm; scale bar (Close-up), 2.5 μm.
Figure 5.
Figure 5.
Short-term micro-environmental stressors increase Pgp distribution to lysosomes under normoxia and hypoxia. KBV1 (+Pgp) cells were incubated under control conditions (0 and 1 h at 37 °C) or for 1 h at 37 °C with the micro-environmental stressors, namely glucose starvation (0 μm), serum starvation (no FCS), or H2O2 stress (100 μm) under normoxia (A–C) or hypoxia (D–F). A and D, Western blot analysis of Pgp and LAMP2 expression in KBV1 (+Pgp) cells after a 0- or 1-h incubation with control medium or the stressors under normoxia or hypoxia. Blots are from typical experiments with densitometry representing mean ± S.D. (error bars) (n = 3). B and E, cells were examined using confocal immunofluorescence microscopy, and Pgp co-localization was observed with well-characterized organelle-specific antibodies, namely anti-LAMP2 for lysosomes. Nuclei were stained with DAPI. These images are typical of three independent experiments with data analysis in C and F presented as arbitrary units (a.u.) and are the mean ± S.D. (n = 3). *, p < 0.05; ***, p < 0.001, relative to respective 0-h control. Scale bar, 10 μm; scale bar (Magnified), 5 μm; scale bar (Close-up), 2.5 μm.
Figure 6.
Figure 6.
Long-term hypoxic stress increases both Pgp expression and Pgp distribution to lysosomes under normoxia and hypoxia. KBV1 (+Pgp) cells were incubated under normoxia (A–C) or hypoxia (D–E) for 0, 4, 8, or 24 h at 37 °C. Cells were then examined using Western blotting (A and D) and confocal immunofluorescence microscopy (B and E), with Pgp co-localization being visualized with the anti-LAMP2 antibody for lysosomes. Nuclei were stained with DAPI. Images are typical of three independent experiments with data analysis in C and F presented as arbitrary units (a.u.) and are the mean ± S.D. (error bars) (n = 3). **, p < 0.01; ***, p < 0.001, relative to the respective 0-h control. Scale bar, 10 μm; scale bar (Magnified), 5 μm; scale bar (Close-up), 2.5 μm.
Figure 6.
Figure 6.
Long-term hypoxic stress increases both Pgp expression and Pgp distribution to lysosomes under normoxia and hypoxia. KBV1 (+Pgp) cells were incubated under normoxia (A–C) or hypoxia (D–E) for 0, 4, 8, or 24 h at 37 °C. Cells were then examined using Western blotting (A and D) and confocal immunofluorescence microscopy (B and E), with Pgp co-localization being visualized with the anti-LAMP2 antibody for lysosomes. Nuclei were stained with DAPI. Images are typical of three independent experiments with data analysis in C and F presented as arbitrary units (a.u.) and are the mean ± S.D. (error bars) (n = 3). **, p < 0.01; ***, p < 0.001, relative to the respective 0-h control. Scale bar, 10 μm; scale bar (Magnified), 5 μm; scale bar (Close-up), 2.5 μm.
Figure 7.
Figure 7.
Stressors increase internalization of Pgp from the plasma membrane to the cathepsin D–defined lysosomal compartment. KBV1 (+Pgp) cells were incubated under normoxia, and internalization of Pgp was assessed using pulse-chase analysis via immunofluorescence examining co-localization of anti-Pgp Ab and a well-characterized lysosomal marker, cathepsin D. A, plates were first cooled to 4 °C on ice, and the anti-Pgp Ab was added and incubated for 1 h at 4 °C on ice, washed, fixed, and permeabilized. For the 1 h at 37 °C control or stress conditions, the 4 °C plates were washed, and prewarmed medium was added containing the stressors and incubated for 1 h at 37 °C. Cells were then washed, fixed, etc., as above. Cells were then blocked and incubated with anti-cathepsin D Ab. B, plot profile analyses at 4 °C control (i), 37 °C control (ii); 37 °C (−) glucose (iii); 37 °C (−) serum (iv), and 37 °C (+) H2O2 (v). C, analysis of masking the cathepsin D channel to calculate Pgp inside and outside the cathepsin D–defined lysosome region using ImageJ. The images in A are typical of three independent experiments. ***, p < 0.001, relative to the respective 37 °C control. Scale bar, 10 μm. Densitometry is mean ± S.E. (error bars) (n = 3).
Figure 8.
Figure 8.
Micro-environmental stressors under normoxia increase Pgp-dependent sequestration of DOX in lysosomes of Pgp-expressing KBV1 cells, preventing access of DOX to its nuclear targets. A, KBV1 (+Pgp) cells were incubated under control conditions (0 or 1 h at 37 °C) or for 1 h at 37 °C under the micro-environmental stressors, namely glucose starvation (0 μm), serum starvation (no FCS), or H2O2 stress (100 μm) under normoxia. The cells were then reincubated for 2 h at 37 °C with DOX (25 μm) in the presence and absence of the Pgp inhibitor, Ela (0.2 μm), with the same stressors. Cells were examined via live-cell immunofluorescence imaging with intrinsically fluorescent DOX and with antibodies against LAMP2 for lysosomes or DAPI for nuclei. These images are typical of three independent experiments with data analysis in B and C presented as arbitrary units (a.u.) and are the mean ± S.D. (error bars) (n = 3). *, p < 0.05; **, p < 0.01; ***, p < 0.001, compared with the respective DOX control in B and C. #, p < 0.05; ##, p < 0.01, compared with the relative DOX treatment in C. Scale bar, 10 μm.
Figure 9.
Figure 9.
Micro-environmental stressors under hypoxia increase Pgp-dependent sequestration of DOX into lysosomes of Pgp-expressing KBV1 cells, preventing access of DOX to its nuclear targets. A, KBV1 (+Pgp) cells were incubated under control conditions (0 and 1 h) or for 1 h at 37 °C with glucose starvation (0 μm), serum starvation (no FCS), or H2O2 stress (100 μm) under normoxia. This was followed by a 2-h/37 °C incubation of DOX (25 μm) in the presence and absence of the Pgp inhibitor, Ela (0.2 μm), with the same stressors. Cells were examined via live-cell immunofluorescence imaging with the intrinsically fluorescent Pgp substrate, DOX, and with antibodies against LAMP2 for lysosomes. Nuclei (a molecular target for DOX) were stained with DAPI. These images are typical of three independent experiments with data analysis in B and C presented as arbitrary units (a.u.) and are the mean ± S.D. (error bars) (n = 3). *, p < 0.05; **, p < 0.01; ***, p < 0.001, compared with the respective DOX control in B and C. #, p < 0.05; ###, p < 0.001, compared with the relative DOX treatment in C. Scale bar, 10 μm.
Figure 10.
Figure 10.
Under normoxia, micro-environmental stressors potentiate Dp44mT-mediated lysosomal damage only in high-Pgp–expressing cells. A, KB31 (very low Pgp; i–xii) and KBV1 (+Pgp; xiii–xxiv) cells under normoxia were preincubated for 1 h with either control medium or stressors, namely glucose starvation, serum starvation, or H2O2 stress (100 μm). Cells were then incubated with Dp44mT (25 μm) in the presence or absence of the Pgp inhibitor, Ela (0.2 μm), in the continued absence or presence of these stressors (under normoxia) for 24 h at 37 °C. Lysosomal stability was examined using live-cell immunofluorescence imaging of the lysosomotropic fluorophore, AO, which is sequestered and retained in intact lysosomes. At high lysosomal concentrations of acridine orange, an orange fluorescence is visualized, whereas lower cytosolic and nuclear concentrations produce a green fluorescence. Images are typical of three independent experiments with data analysis in B representing mean ± S.D. (error bars) (n = 3). ***, p < 0.001, relative to respective KBV1 control. ††, p < 0.01, relative to respective treatment with Dp44mT alone. ##, p < 0.01; ###, p < 0.001, relative to respective treatment of KB31 cells with Dp44mT alone. Scale bar, 10 μm.
Figure 11.
Figure 11.
Under hypoxia, micro-environmental stressors potentiate Dp44mT-mediated lysosomal damage in both low- and high-Pgp–expressing cells. A, KB31 (very low Pgp; i–xii) and KBV1 (+Pgp; xiii–xxiv) cells under hypoxia were preincubated for 1 h with either control medium or stressors, namely glucose starvation, serum starvation, or H2O2 stress (100 μm). Cells were then incubated with Dp44mT (25 μm) in the presence or absence of the Pgp inhibitor, Ela (0.2 μm), in the continued absence or presence of these stressors (under hypoxia) for 24 h at 37 °C. Lysosomal stability was examined using live-cell immunofluorescence imaging of the lysosomotropic fluorophore, AO, which is retained within intact lysosomes. At high lysosomal concentrations of acridine orange, a red fluorescence is visualized, whereas lower cytosolic and nuclear concentrations produce a green fluorescence. Images are typical of three independent experiments with data analysis in B representing mean ± S.D. (error bars) (n = 3). *, p < 0.05; **, p < 0.01; ***, p < 0.001, relative to respective control. †††, p < 0.001, relative to the respective treatment with Dp44mT alone. Scale bar, 10 μm.
Figure 12.
Figure 12.
Micro-environmental stressors potentiate Pgp-mediated Dp44mT cytotoxicity to a greater extent under hypoxia relative to normoxia. KB31 (very low Pgp) (A), KBV1 (+Pgp) (B), and DMS-53 (+Pgp) (C) cells were preincubated for 1 h at 37 °C either under control conditions or with the micro-environmental stressors glucose starvation (0 μm), serum starvation (no FCS), or H2O2 stress (100 μm) under either normoxia (i) or hypoxia (ii). An additional incubation of 24 h/37 °C under the same conditions was then performed with the addition of Dp44mT (0.2–100 μm) in the presence and absence of the Pgp inhibitor, Ela (0.2 μm), under normoxia or hypoxia. Cellular proliferation was measured using the MTT proliferation assay. Results are typical of three independent experiments with data analysis representing mean ± S.D. (error bars) (n = 3). *, p < 0.05; **, p < 0.01; ***, p < 0.001, relative to the respective Dp44mT control. #, p < 0.05; ##, p < 0.01; ###, p < 0.001, relative to the respective Dp44mT treatment with Ela.
Figure 13.
Figure 13.
Schematic model illustrating the two major mechanisms of Pgp regulation by which tumor micro-environmental stressors increase drug resistance. Tumor micro-environment stressors (i.e. serum starvation, low glucose levels, ROS, and hypoxia) induced Pgp-mediated resistance by two mechanisms: 1) redistribution of Pgp to lysosomes after short-term (1-h) stress and 2) increased Pgp expression via HIF-1α accompanied by lysosomal biogenesis after long-term (4–24-h) stress. A, basal Pgp expression in unstressed (normoxic) cancer cells; B, short-term exposure to stressors causes a rapid increase in Pgp redistribution to lysosomes; C, long-term exposure to stressors also redistributes Pgp to lysosomes but additionally increases Pgp levels via HIF-1α and lysosomal biogenesis. Within the lysosome, Pgp allows import of Pgp substrates into this organelle. D, from a therapeutic standpoint, stressors decrease drug sensitivity/toxicity (i.e. increase drug resistance) to DOX via increased Pgp expression and Pgp-mediated lysosomal drug trapping (i.e. lysosomal “safe house” effect). In contrast to DOX, tumor micro-environmental stress increases drug sensitivity/toxicity of Dp44mT toward Pgp-expressing cells. Significantly, the stressors induce Pgp-mediated resistance to DOX, whereas Dp44mT directly utilizes Pgp to overcome this resistance and kill tumor cells.

Similar articles

Cited by

References

    1. Germann U. A. (1996) P-glycoprotein: a mediator of multidrug resistance in tumour cells. Eur. J. Cancer 32A, 927–944 - PubMed
    1. Cole S. P., Bhardwaj G., Gerlach J. H., Mackie J. E., Grant C. E., Almquist K. C., Stewart A. J., Kurz E. U., Duncan A. M., and Deeley R. G. (1992) Overexpression of a transporter gene in a multidrug-resistant human lung cancer cell line. Science 258, 1650–1654 10.1126/science.1360704 - DOI - PubMed
    1. Seebacher N., Lane D. J., Richardson D. R., and Jansson P. J. (2016) Turning the gun on cancer: utilizing lysosomal P-glycoprotein as a new strategy to overcome multi-drug resistance. Free Radic. Biol. Med. 96, 432–445 10.1016/j.freeradbiomed.2016.04.201 - DOI - PubMed
    1. Sharom F. J. (2008) ABC multidrug transporters: structure, function and role in chemoresistance. Pharmacogenomics 9, 105–127 10.2217/14622416.9.1.105 - DOI - PubMed
    1. Comerford K. M., Wallace T. J., Karhausen J., Louis N. A., Montalto M. C., and Colgan S. P. (2002) Hypoxia-inducible factor-1-dependent regulation of the multidrug resistance (MDR1) gene. Cancer Res. 62, 3387–3394 - PubMed

Publication types

MeSH terms

LinkOut - more resources