. 2018 Mar 1;84(6):e00014-18.
doi: 10.1128/AEM.00014-18. Print 2018 Mar 15.

How Much Do rRNA Gene Surveys Underestimate Extant Bacterial Diversity?

Affiliations

How Much Do rRNA Gene Surveys Underestimate Extant Bacterial Diversity?

Luis M Rodriguez-R et al. Appl Environ Microbiol. .

Abstract

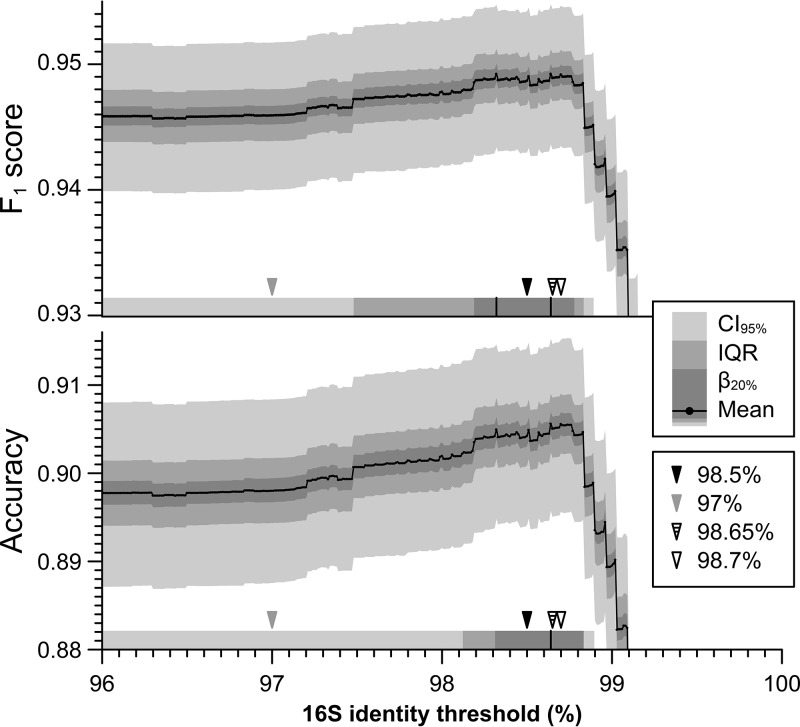
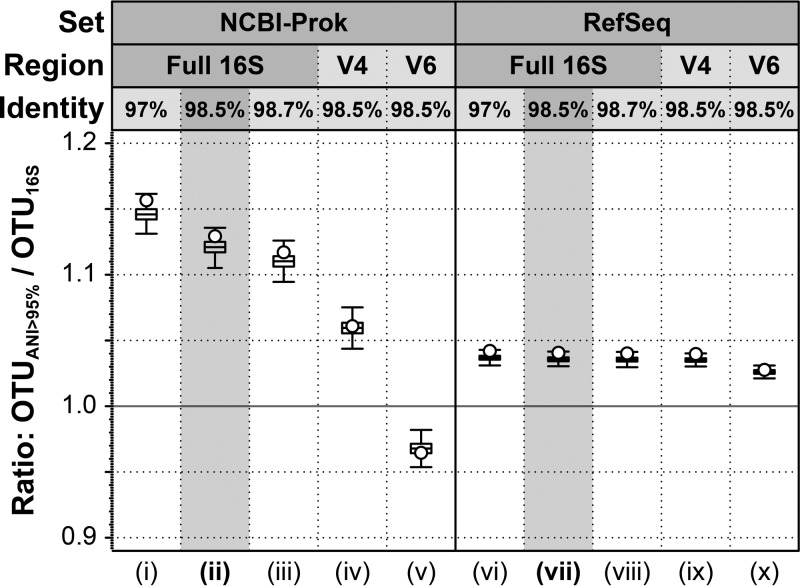
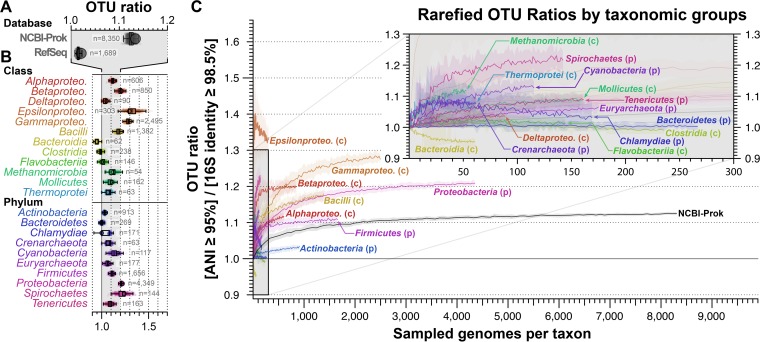
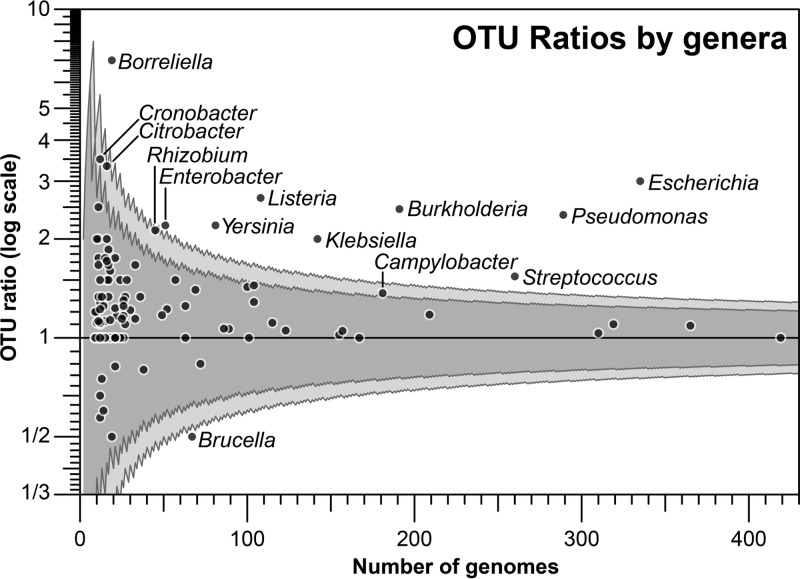
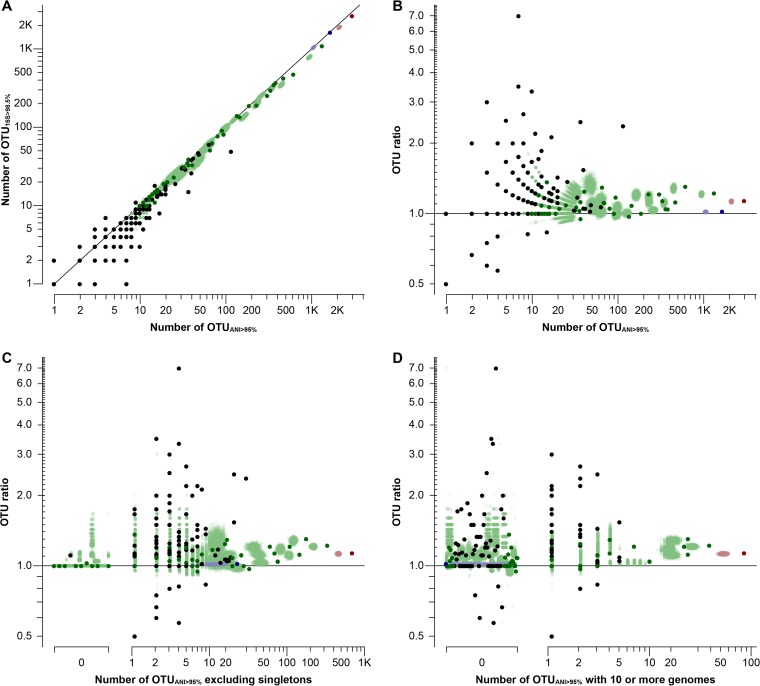
The most common practice in studying and cataloguing prokaryotic diversity involves the grouping of sequences into operational taxonomic units (OTUs) at the 97% 16S rRNA gene sequence identity level, often using partial gene sequences, such as PCR-generated amplicons. Due to the high sequence conservation of rRNA genes, organisms belonging to closely related yet distinct species may be grouped under the same OTU. However, it remains unclear how much diversity has been underestimated by this practice. To address this question, we compared the OTUs of genomes defined at the 97% or 98.5% 16S rRNA gene identity level against OTUs of the same genomes defined at the 95% whole-genome average nucleotide identity (ANI), which is a much more accurate proxy for species. Our results show that OTUs resulting from a 98.5% 16S rRNA gene identity cutoff are more accurate than 97% compared to 95% ANI (90.5% versus 89.9% accuracy) but indistinguishable from any other threshold in the 98.29 to 98.78% range. Even with the more stringent thresholds, however, the 16S rRNA gene-based approach commonly underestimates the number of OTUs by ∼12%, on average, compared to the ANI-based approach (∼14% underestimation when using the 97% identity threshold). More importantly, the degree of underestimation can become 50% or more for certain taxa, such as the genera Pseudomonas, Burkholderia, Escherichia, Campylobacter, and Citrobacter These results provide a quantitative view of the degree of underestimation of extant prokaryotic diversity by 16S rRNA gene-defined OTUs and suggest that genomic resolution is often necessary.IMPORTANCE Species diversity is one of the most fundamental pieces of information for community ecology and conservational biology. Therefore, employing accurate proxies for what a species or the unit of diversity is are cornerstones for a large set of microbial ecology and diversity studies. The most common proxies currently used rely on the clustering of 16S rRNA gene sequences at some threshold of nucleotide identity, typically 97% or 98.5%. Here, we explore how well this strategy reflects the more accurate whole-genome-based proxies and determine the frequency with which the high conservation of 16S rRNA sequences masks substantial species-level diversity.

Keywords: 16S rRNA gene; average nucleotide identity; diversity.


Figures

FIG 1
FIG 1
Most accurate 16S rRNA gene identity thresholds with respect to 95% ANI. The figure shows the F1 score (top) and accuracy (bottom) of different 16S rRNA gene identity thresholds (x axis) using 95% ANI as a reference. Both metrics represent trade-offs between recall and precision. For each metric, the plot displays the summary statistics of 1,000 rounds of bootstrap on the NCBI-Prok collection as bands; mean (solid line), 80% power range (β20%, darker band), interquartile range (IQR; intermediate band), and 95% confidence interval (CI95%; lightest band). In the lower portion of each panel (horizontal shading), the identity thresholds with the highest F1 score or accuracy are marked with vertical solid black lines (98.32% and 98.64% for F1, 98.64% for accuracy). The regions in which the mean F1 score or accuracy is within the β20%, IQR, and 95% CI ranges of the thresholds with highest values are indicated with concentric gray bands. The 16S rRNA gene identity threshold used in this study (98.5%) is indicated with a filled black arrowhead, the default 16S rRNA gene identity threshold in QIIME and mothur (97%) is indicated with a filled gray arrowhead, and other less common thresholds used in the literature (98.65% and 98.7%) are indicated with open black arrowheads. All except 97% are within the β20% range of the highest F1.
FIG 2
FIG 2
Differences in the number of OTUs recovered by ANI relative to 16S rRNA. Graph shows the ratio of the number of OTUs recovered based on 95% ANI (OTUANI>95%) versus 16S rRNA (y axis) for different 16S rRNA gene cutoffs (x axis): i and vi, 97% identity across the full-length gene sequence (OTU16S>97%); ii and vii, 98.5% across the full-length gene sequence (OTU16S>98.5%); iii and viii, 98.7% across the full-length gene sequence (OTU16S>98.7%); iv and ix, 98.5% across the V4 region only, a cutoff exceeded with two nucleotide substitutions; and v and x, 98.5% across the V6 region, exceeded with one substitution. Open circles indicate the OTU ratio estimations; error bars denote standard deviations over 1,000 rounds of bootstrapping.
FIG 3
FIG 3
Phylogenetic biases in the ANI-to-16S rRNA OTU ratio. (A) Average OTUANI>95%-to-OTU16S>98.5% ratios based on all genomes in NCBI-Prok and RefSeq collections. (B) Ratios are reported separately for the most frequently sampled phyla and classes (at least 50 available genomes). Boxplots denote the distribution of estimations over 1,000 rounds of bootstrapping (box, interquartile range; whiskers, full range without outliers), open circles indicate the estimate without bootstraps, and numbers denote the number of genomes used for each taxon. Alphaproteo., Alphaproteobacteria; Betaproteo., Betaproteobacteria; Deltaproteo., Deltaproteobacteria; Epsilonproteo., Epsilonproteobacteria; Gammaproteo., Gammaproteobacteria. (C) Rarefaction of ratios for most sampled classes and phyla. Shaded ribbons denote the interquartile range over 100 rounds of bootstrapping. Inset is the zoomed-in version of the gray-shaded area in the graph.
FIG 4
FIG 4
OTU ratios for different genera in NCBI-Prok. All genera with at least nine genomes available in the NCBI-Prok collection were reclustered in OTUANI>95% and OTU16S>98.5%, and OTU ratios (y axis) were calculated as in Fig. 2. The OTU ratios per genera are displayed by the number of genome representatives available (x axis). The 95% and 99% confidence intervals for a binomial-based ratio statistic are displayed as dark and light gray bands, respectively.
FIG 5
FIG 5
Effect of number of genomes within an OTU on OTU ratio estimates. (A) The number of OTU16S>98.5% (x axis) is lesser than or equal to the number of OTUANI>95%, with only few examples of the opposite trend mostly from small sets (5 or fewer OTUANI>95%; diagonal line indicates a 1:1 relationship, or OTU ratio of 1.0). The remaining panels show the OTU ratios (y axis) per number of OTUANI>95% (B), number of OTUANI>95% excluding singletons (i.e., with 2 or more genomes) (C), and number of OTUANI>95% with 10 or more genomes (x axes) (D). The colors indicate the type of genome collection used: NCBI-Prok (red), RefSeq (blue), phylum-/class-level subsets (green), or genus-level subsets (black). Lighter dots, mostly overlapping and forming clouds of the corresponding data set color, indicate bootstrapped values. Note that the three distributions in panels B to D are not substantially different from each other.

References

    1. Hubbell SP. 2008. The Unified neutral theory of biodiversity and biogeography (MPB-32). Princeton University Press, Princeton, NJ.
    1. Krause S, Le Roux X, Niklaus PA, Van Bodegom PM, Lennon JT, Bertilsson S, Grossart H-P, Philippot L, Bodelier PLE. 2014. Trait-based approaches for understanding microbial biodiversity and ecosystem functioning. Front Microbiol 5:251. doi: 10.3389/fmicb.2014.00251. - DOI - PMC - PubMed
    1. Martiny JBH, Jones SE, Lennon JT, Martiny AC. 2015. Microbiomes in light of traits: a phylogenetic perspective. Science 350:aac9323. doi: 10.1126/science.aac9323. - DOI - PubMed
    1. Oren A, Garrity GM. 2014. Then and now: a systematic review of the systematics of prokaryotes in the last 80 years. Antonie Van Leeuwenhoek 106:43–56. doi: 10.1007/s10482-013-0084-1. - DOI - PubMed
    1. Rosselló-Mora R, Amann R. 2001. The species concept for prokaryotes. FEMS Microbiol Rev 25:39–67. doi: 10.1111/j.1574-6976.2001.tb00571.x. - DOI - PubMed

Publication types

Substances