

Elucidating Waterborne Pathogen Presence and Aiding Source Apportionment in an Impaired Stream
- PMID: 29305503
- PMCID: PMC5835731
- DOI: 10.1128/AEM.02510-17
Elucidating Waterborne Pathogen Presence and Aiding Source Apportionment in an Impaired Stream
Abstract
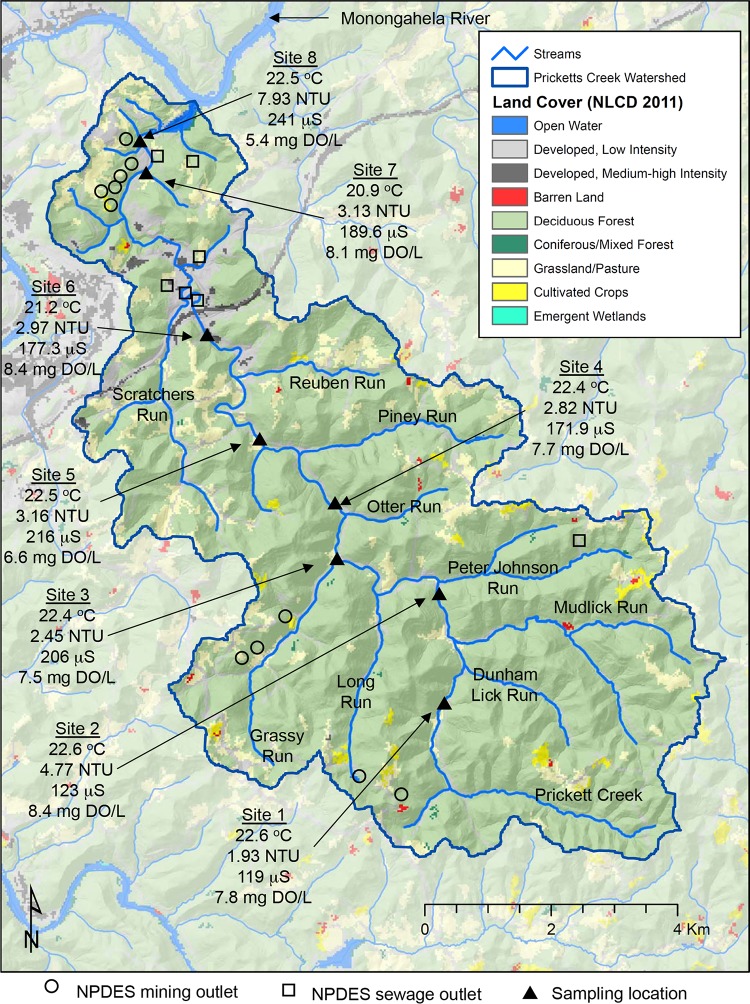
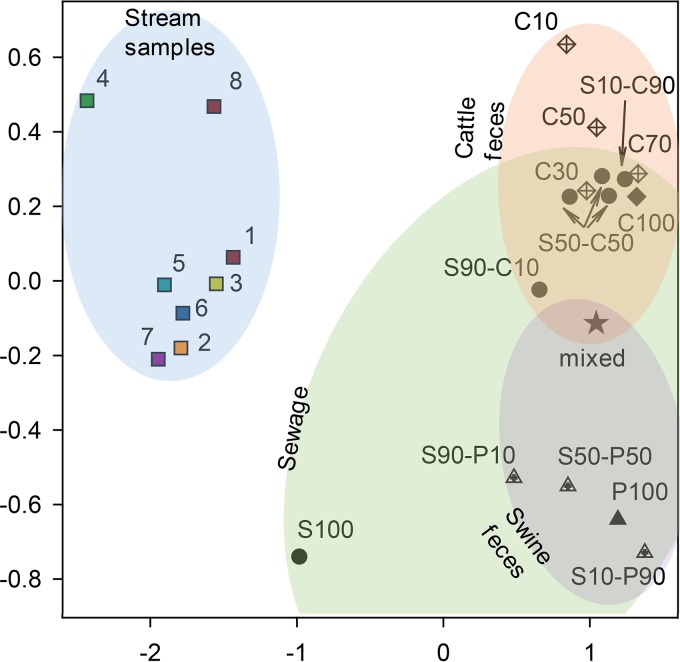
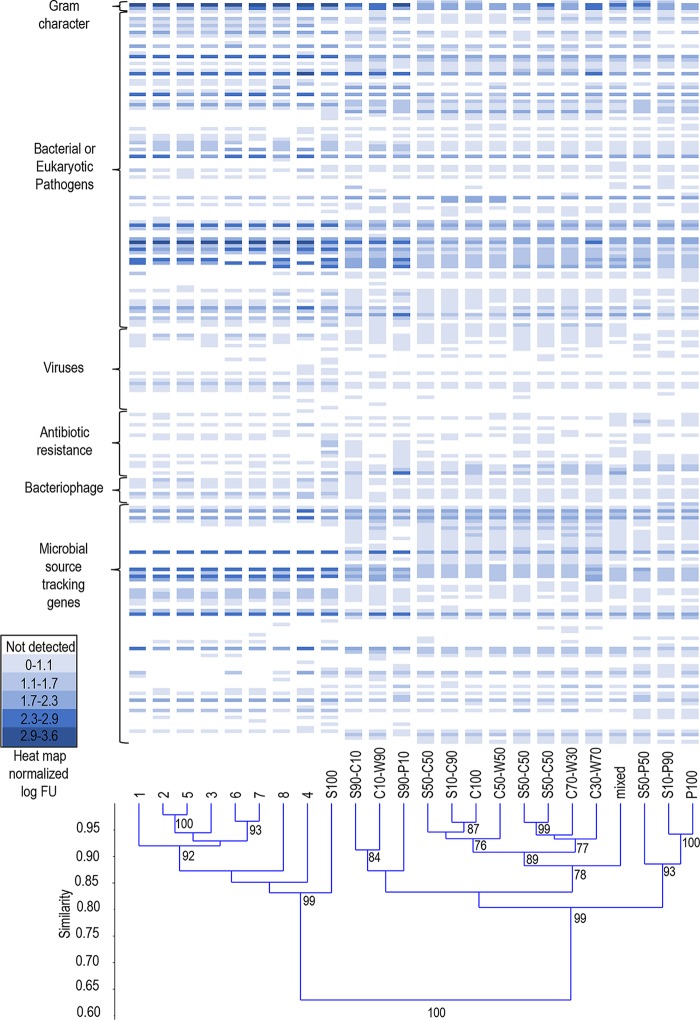
Fecal indicator bacteria (FIB) are the basis for water quality regulations and are considered proxies for waterborne pathogens when conducting human health risk assessments. The direct detection of pathogens in water and simultaneous identification of the source of fecal contamination are possible with microarrays, circumventing the drawbacks to FIB approaches. A multigene target microarray was used to assess the prevalence of waterborne pathogens in a fecally impaired mixed-use watershed. The results indicate that fecal coliforms have improved substantially in the watershed since its listing as a 303(d) impaired stream in 2002 and are now near United States recreational water criterion standards. However, waterborne pathogens are still prevalent in the watershed, as viruses (bocavirus, hepatitis E and A viruses, norovirus, and enterovirus G), bacteria (Campylobacter spp., Clostridium spp., enterohemorrhagic and enterotoxigenic Escherichia coli, uropathogenic E. coli, Enterococcus faecalis, Helicobacter spp., Salmonella spp., and Vibrio spp.), and eukaryotes (Acanthamoeba spp., Entamoeba histolytica, and Naegleria fowleri) were detected. A comparison of the stream microbial ecology with that of sewage, cattle, and swine fecal samples revealed that human sources of fecal contamination dominate in the watershed. The methodology presented is applicable to a wide range of impaired streams for the identification of human health risk due to waterborne pathogens and for the identification of areas for remediation efforts.IMPORTANCE The direct detection of waterborne pathogens in water overcomes many of the limitations of the fecal indicator paradigm. Furthermore, the identification of the source of fecal impairment aids in identifying areas for remediation efforts. Multitarget gene microarrays are shown to simultaneously identify waterborne pathogens and aid in determining the sources of impairment, enabling further focused investigations. This study shows the use of this methodology in a historically impaired watershed in which total maximum daily load reductions have been successfully implemented to reduce risk. The results suggest that while the fecal indicators have been reduced more than 96% and are nearing recreational water criterion levels, pathogens are still detectable in the watershed. Microbial source tracking results show that additional remediation efforts are needed to reduce the impact of human sewage in the watershed.
Keywords: TMDL; fecal organisms; indicator bacteria; microarray; microbial source tracking; waterborne pathogen.
Copyright © 2018 American Society for Microbiology.
Figures
Similar articles
-
Relationships between Microbial Indicators and Pathogens in Recreational Water Settings.Int J Environ Res Public Health. 2018 Dec 13;15(12):2842. doi: 10.3390/ijerph15122842. Int J Environ Res Public Health. 2018. PMID: 30551597 Free PMC article. Review.
-
Determination of wild animal sources of fecal indicator bacteria by microbial source tracking (MST) influences regulatory decisions.Water Res. 2018 Nov 1;144:424-434. doi: 10.1016/j.watres.2018.07.034. Epub 2018 Jul 17. Water Res. 2018. PMID: 30059905
-
The River Ruhr - an urban river under particular interest for recreational use and as a raw water source for drinking water: The collaborative research project "Safe Ruhr" - microbiological aspects.Int J Hyg Environ Health. 2016 Oct;219(7 Pt B):643-661. doi: 10.1016/j.ijheh.2016.07.005. Epub 2016 Jul 14. Int J Hyg Environ Health. 2016. PMID: 27495908
-
Comparison of Microbial and Chemical Source Tracking Markers To Identify Fecal Contamination Sources in the Humber River (Toronto, Ontario, Canada) and Associated Storm Water Outfalls.Appl Environ Microbiol. 2016 Oct 14;82(21):6357-6366. doi: 10.1128/AEM.01675-16. Print 2016 Nov 1. Appl Environ Microbiol. 2016. PMID: 27542934 Free PMC article.
-
Microbial agents associated with waterborne diseases.Crit Rev Microbiol. 2002;28(4):371-409. doi: 10.1080/1040-840291046768. Crit Rev Microbiol. 2002. PMID: 12546197 Review.
Cited by
-
Molecular Diagnostic Tools Applied for Assessing Microbial Water Quality.Int J Environ Res Public Health. 2022 Apr 22;19(9):5128. doi: 10.3390/ijerph19095128. Int J Environ Res Public Health. 2022. PMID: 35564522 Free PMC article. Review.
-
Waterborne pathogens detection technologies: advances, challenges, and future perspectives.Front Microbiol. 2023 Nov 23;14:1286923. doi: 10.3389/fmicb.2023.1286923. eCollection 2023. Front Microbiol. 2023. PMID: 38075917 Free PMC article. Review.
-
Relationships between Microbial Indicators and Pathogens in Recreational Water Settings.Int J Environ Res Public Health. 2018 Dec 13;15(12):2842. doi: 10.3390/ijerph15122842. Int J Environ Res Public Health. 2018. PMID: 30551597 Free PMC article. Review.
-
Construction of enterovirus G expressing reporter genes for antiviral drug screening assays.BMC Vet Res. 2025 Aug 13;21(1):515. doi: 10.1186/s12917-025-04960-0. BMC Vet Res. 2025. PMID: 40804379 Free PMC article.
-
Human Fecal Contamination Corresponds to Changes in the Freshwater Bacterial Communities of a Large River Basin.Microbiol Spectr. 2021 Oct 31;9(2):e0120021. doi: 10.1128/Spectrum.01200-21. Epub 2021 Sep 8. Microbiol Spectr. 2021. PMID: 34494860 Free PMC article.
References
-
- U.S. Environmental Protection Agency. 2017. Assessment and total maximum daily load tracking and implementation system (ATTAINS). U.S. Environmental Protection Agency, Washington, DC: https://ofmpub.epa.gov/waters10/attains_index.home Accessed 15 September 2017.
-
- U.S. Environmental Protection Agency. 2005. Guidance for 2006 assessment, listing and reporting requirements pursuant to sections 303(d), 305(b) and 314 of the Clean Water Act. U.S. Environmental Protection Agency, Washington, DC.
-
- U.S. Environmental Protection Agency. 1986. Ambient water quality criteria for bacteria. EPA/440/5-84/002. Criteria and Standards Division, U.S. Environmental Protection Agency, Washington, DC.
-
- National Research Council. 2004. Indicators of waterborne pathogens, p 329. National Research Council, National Academies Press, Washington, DC.
-
- Gronewold AD, Borsuk ME, Wolpert RL, Reckhow KH. 2008. An assessment of fecal indicator bacteria-based water quality standards. Environ Sci Technol 42:4676–4682. - PubMed
Publication types
MeSH terms
Substances
LinkOut - more resources
Full Text Sources
Other Literature Sources
Molecular Biology Databases
Miscellaneous
