

The development of brain white matter microstructure
- PMID: 29305910
- PMCID: PMC6030512
- DOI: 10.1016/j.neuroimage.2017.12.097
The development of brain white matter microstructure
Abstract
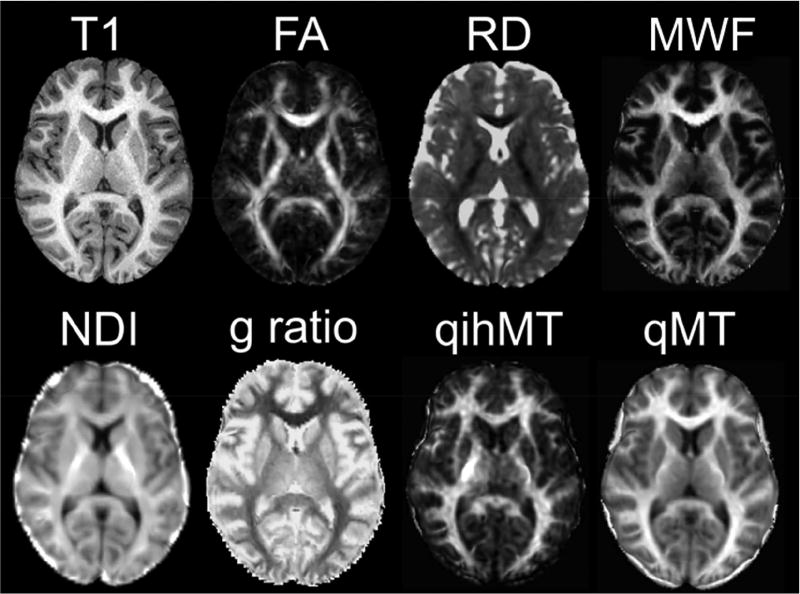
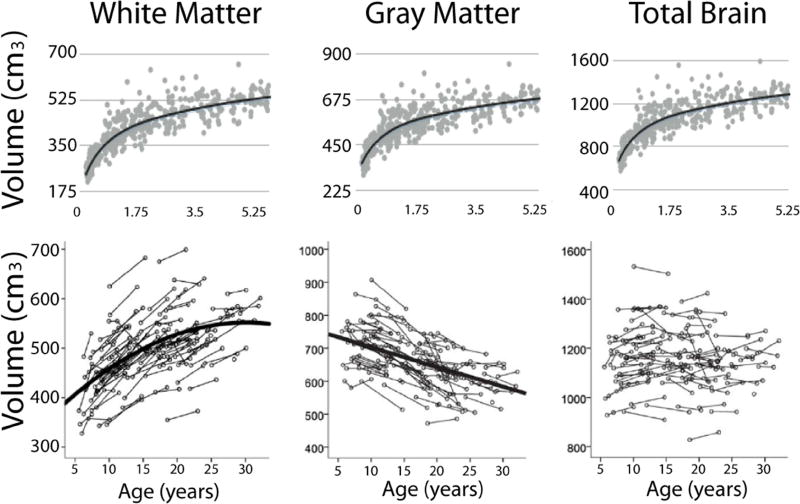
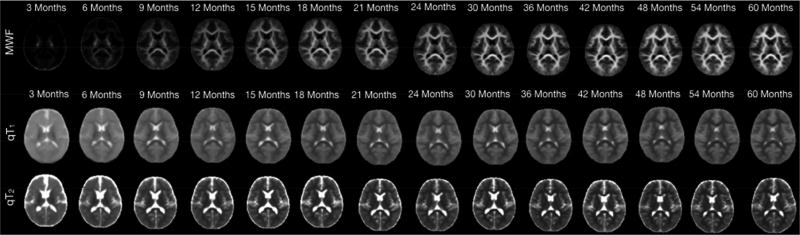
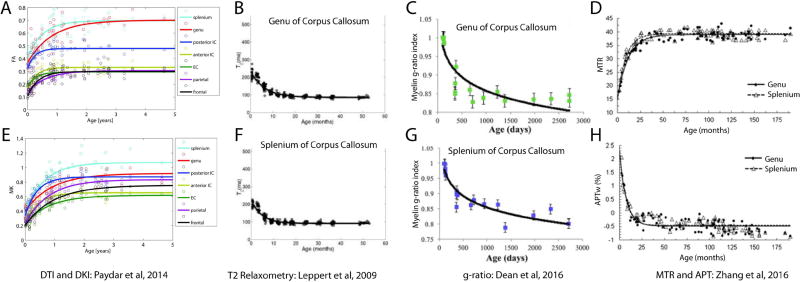
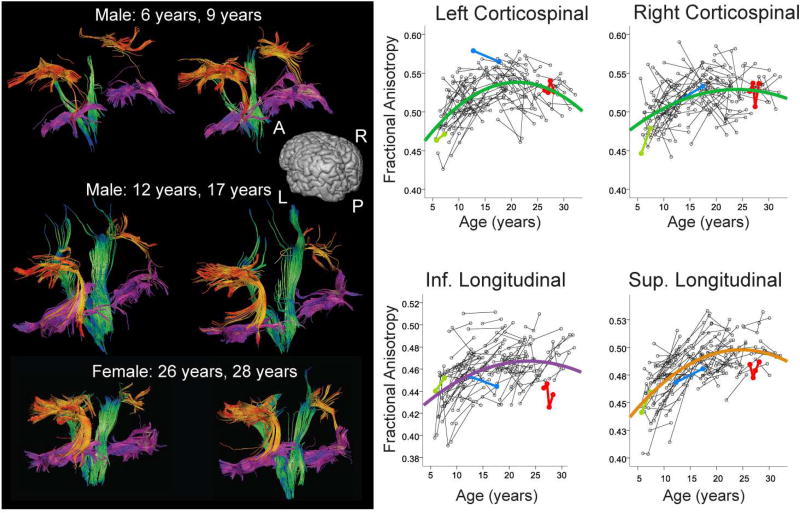
Throughout infancy, childhood, and adolescence, our brains undergo remarkable changes. Processes including myelination and synaptogenesis occur rapidly across the first 2-3 years of life, and ongoing brain remodeling continues into young adulthood. Studies have sought to characterize the patterns of structural brain development, and early studies predominately relied upon gross anatomical measures of brain structure, morphology, and organization. MRI offers the ability to characterize and quantify a range of microstructural aspects of brain tissue that may be more closely related to fundamental neurodevelopmental processes. Techniques such as diffusion, magnetization transfer, relaxometry, and myelin water imaging provide insight into changing cyto- and myeloarchitecture, neuronal density, and structural connectivity. In this review, we focus on the growing body of literature exploiting these MRI techniques to better understand the microstructural changes that occur in brain white matter during maturation. Our review focuses on studies of normative brain development from birth to early adulthood (∼25 years), and places particular emphasis on longitudinal studies and newer techniques that are being used to study microstructural white matter development. All imaging methods demonstrate consistent, rapid microstructural white matter development over the first 3 years of life, suggesting increased myelination and axonal packing. Diffusion studies clearly demonstrate continued white matter maturation during later childhood and adolescence, though the lack of consistent findings in other modalities suggests changes may be mainly due to axonal packing. An emerging literature details differential microstructural development in boys and girls, and connects developmental trajectories to cognitive abilities, behaviour, and/or environmental factors, though the nature of these relationships remains unclear. Future research will need to focus on newer imaging techniques and longitudinal studies to provide more detailed information about microstructural white matter development, particularly in the childhood years.
Keywords: Brain MRI; Brain development; Myelination; Neuroimaging; White matter.
Copyright © 2018 Elsevier Inc. All rights reserved.
Figures
References
-
- Aboitiz F, Scheibel AB, Fisher RS, Zaidel E. Fiber composition of the human corpus callosum. Brain Res. 1992;598:143–153. - PubMed
-
- Assaf Y, Basser PJ. Composite hindered and restricted model of diffusion (CHARMED) MR imaging of the human brain. Neuroimage. 2005;27:48–58. - PubMed
-
- Aubert-Broche B, Fonov VS, Garcia-Lorenzo D, Mouiha A, Guizard N, Coupe P, Eskildsen SF, Collins DL. A new method for structural volume analysis of longitudinal brain MRI data and its application in studying the growth trajectories of anatomical brain structures in childhood. Neuroimage. 2013;82:393–402. - PubMed
-
- Barkovich AJ, Kjos BO, Jackson DE, Jr, Norman D. Normal maturation of the neonatal and infant brain: MR imaging at 1.5 T. Radiology. 1988;166:173–180. - PubMed
Publication types
MeSH terms
Grants and funding
LinkOut - more resources
Full Text Sources
Other Literature Sources
Medical
