

Featured Article: Modulation of the OGF-OGFr pathway alters cytokine profiles in experimental autoimmune encephalomyelitis and multiple sclerosis
- PMID: 29307283
- PMCID: PMC6022923
- DOI: 10.1177/1535370217749830
Featured Article: Modulation of the OGF-OGFr pathway alters cytokine profiles in experimental autoimmune encephalomyelitis and multiple sclerosis
Abstract
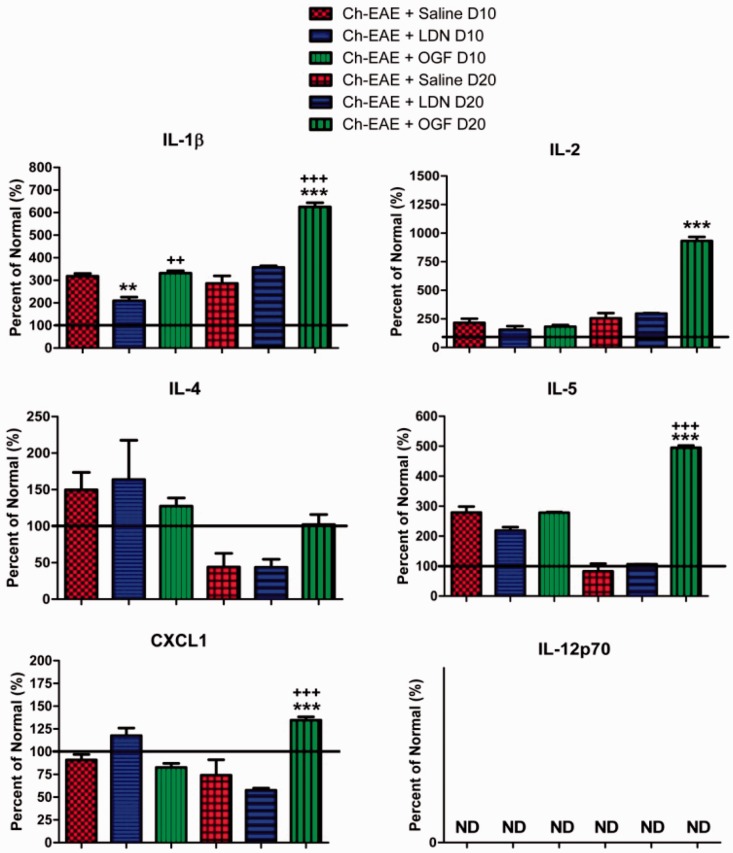
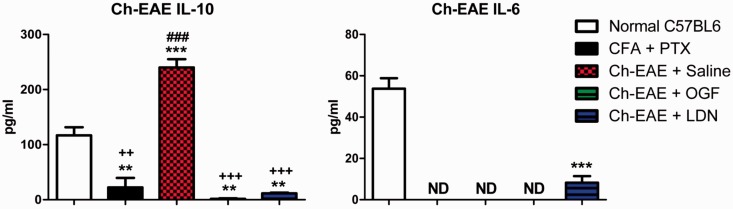
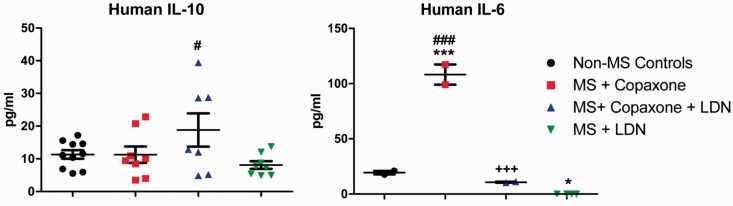
The endogenous neuropeptide opioid growth factor, chemically termed [Met5]-enkephalin, has growth inhibitory and immunomodulatory properties. Opioid growth factor is distributed widely throughout most tissues, is autocrine and paracrine produced, and interacts at the nuclear-associated receptor, OGFr. Serum levels of opioid growth factor are decreased in patients with multiple sclerosis and in animals with experimental autoimmune encephalomyelitis suggesting that the OGF-OGFr pathway becomes dysregulated in this disease. This study begins to assess other cytokines that are altered following opioid growth factor or low-dose naltrexone modulation of the OGF-OGFr axis in mice with experimental autoimmune encephalomyelitis using serum samples collected in mice treated for 10 or 20 days and assayed by a multiplex cytokine assay for inflammatory markers. Cytokines of interest were validated in mice at six days following immunization for experimental autoimmune encephalomyelitis. In addition, selected cytokines were validated with serum from MS patients treated with low-dose naltrexone alone or low-dose naltrexone in combination with glatiramer acetate (Copaxone®). Experimental autoimmune encephalomyelitis mice had elevated levels of 7 of 10 cytokines. Treatment with opioid growth factor or low-dose naltrexone resulted in elevated expression levels of the IL-6 cytokine, and significantly reduced IL-10 values, relative to saline-treated experimental autoimmune encephalomyelitis mice. TNF-γ values were increased in experimental autoimmune encephalomyelitis mice relative to normal, but were not altered by opioid growth factor or low-dose naltrexone. IFN-γ levels were reduced in opioid growth factor- or low-dose naltrexone-treated experimental autoimmune encephalomyelitis mice relative to saline-treated mice at 10 days, and elevated relative to normal values at 20 days. Validation studies revealed that within six days of immunization, opioid growth factor or low-dose naltrexone modulated IL-6 and IL-10 cytokine expression. Validation in human serum revealed markedly reduced IL-6 cytokine levels in MS patients taking low-dose naltrexone relative to standard care. In summary, modulation of the OGF-OGFr pathway regulates some inflammatory cytokines, and together with opioid growth factor serum levels, may begin to form a panel of valid biomarkers to monitor progression of multiple sclerosis and response to therapy. Impact statement Modulation of the opioid growth factor (OGF)-OGF receptor (OGFr) alters inflammatory cytokine expression in multiple sclerosis and experimental autoimmune encephalomyelitis (EAE). Multiplex cytokine assays demonstrated that mice with chronic EAE and treated with either OGF or low-dose naltrexone (LDN) had decreased expression of interferon-gamma (IFN-γ), tumor necrosis factor-alpha (TNF-α), and the anti-inflammatory cytokine IL-10 within 10 days or treatment, as well as increased serum expression of the pro-inflammatory cytokine IL-6, relative to immunized mice receiving saline. Multiplex data were validated using ELISA kits and serum from MS patients treated with LDN and revealed decreased in IL-6 levels in patients taking LDN relative to standard care alone. These data, along with serum levels of OGF, begin to formulate a selective biomarker profile for MS that is easily measured and effective at monitoring disease progression and response to therapy.
Keywords: IFN-γ; IL-10; IL-6; cytokines; experimental autoimmune encephalomyelitis; low-dose naltrexone; opioid growth factor.
Figures

References
-
- Owens GM. Economic burden of multiple sclerosis and the role of managed care organizations in multiple sclerosis management. Am J Manag Care 2016; 22:S151–8 - PubMed
-
- www.nationalmssociety.org/about-multiple-sclerosis/index.aspx (accessed 23 October 2017)
-
- Pietrangelo A, Higuera V. Multiple sclerosis by the numbers: facts, statistics, and you, www.healthline.com/health/multiple-sclerosis/facts-statistics-infographic (accessed 23 October 2017)
-
- Sharafaddinzadeh N, Moghtaderi A, Kashipazha D, Majdinasab N, Shalbafan B. The effect of low-dose naltrexone on quality of life of patients with multiple sclerosis: a randomized placebo-controlled trial. Mult Scler 2010; 16:964–9 - PubMed
Publication types
MeSH terms
Substances
LinkOut - more resources
Full Text Sources
Other Literature Sources
Medical
Miscellaneous