. 2018 Jan 11;172(1-2):205-217.e12.
doi: 10.1016/j.cell.2017.12.007. Epub 2018 Jan 4.

Multiclonal Invasion in Breast Tumors Identified by Topographic Single Cell Sequencing

Affiliations

Multiclonal Invasion in Breast Tumors Identified by Topographic Single Cell Sequencing

Anna K Casasent et al. Cell. .

Abstract

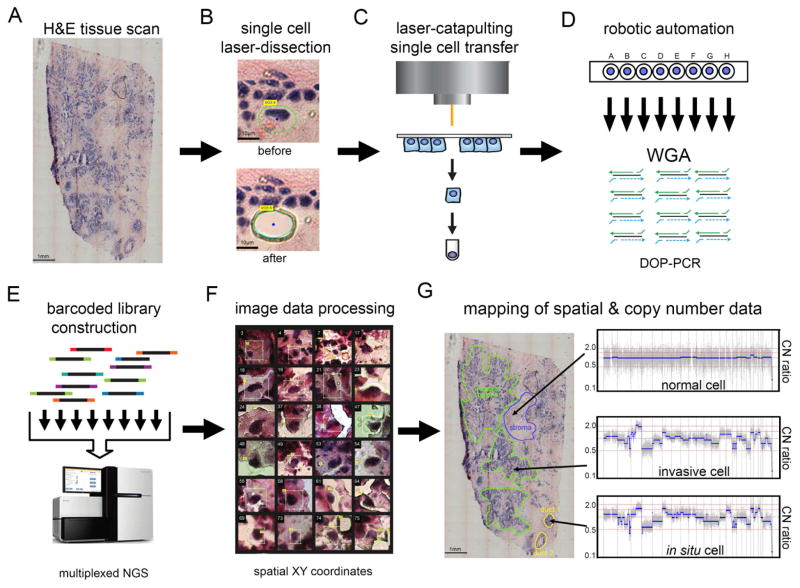
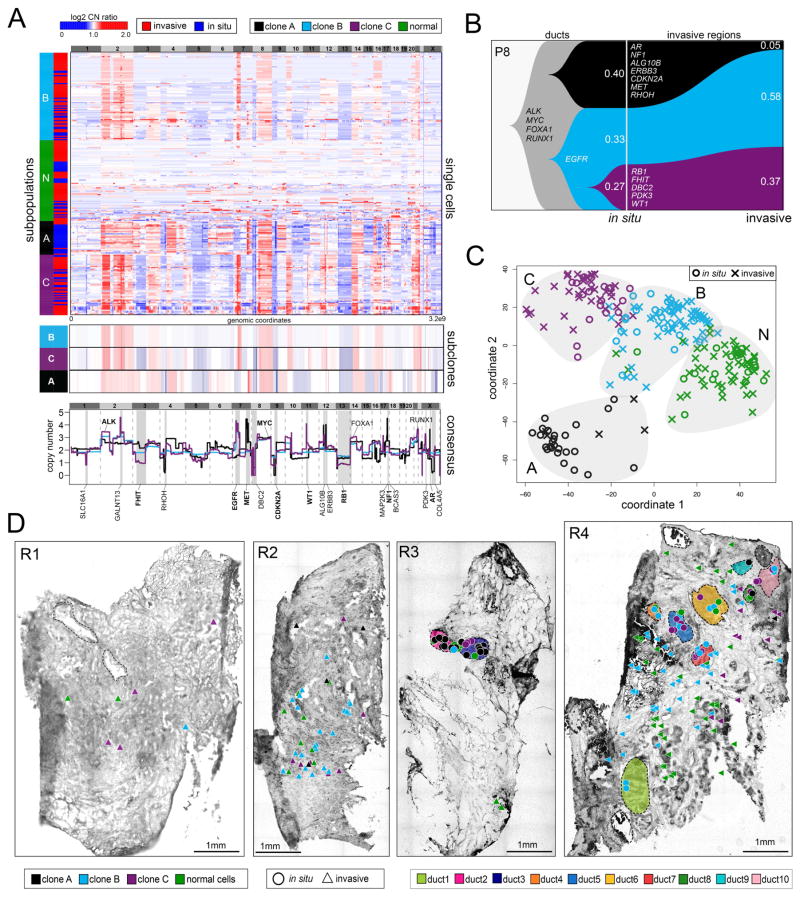
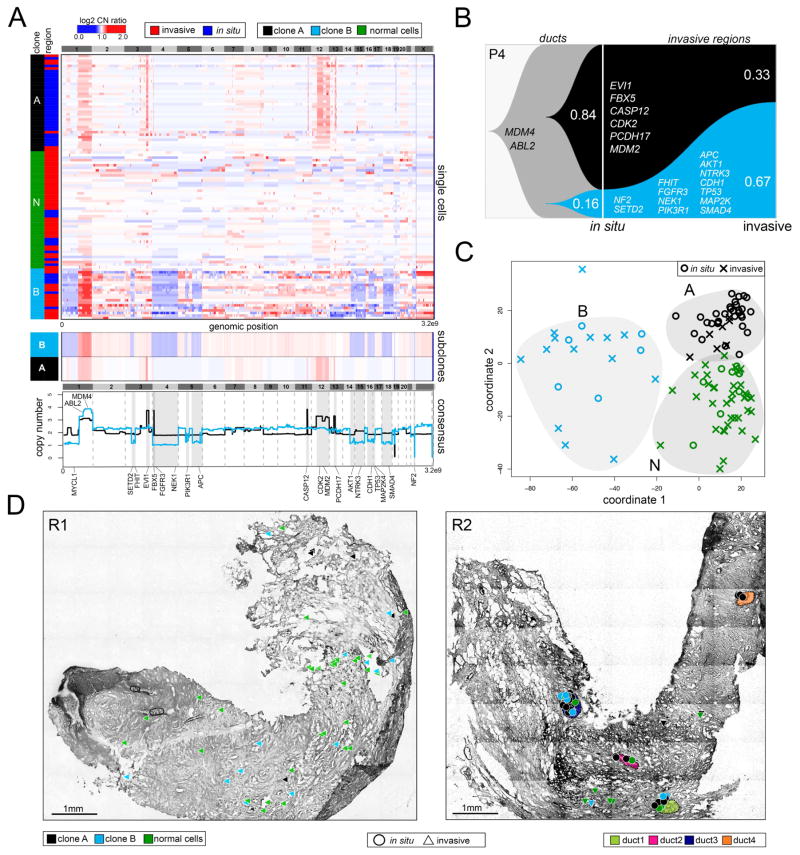
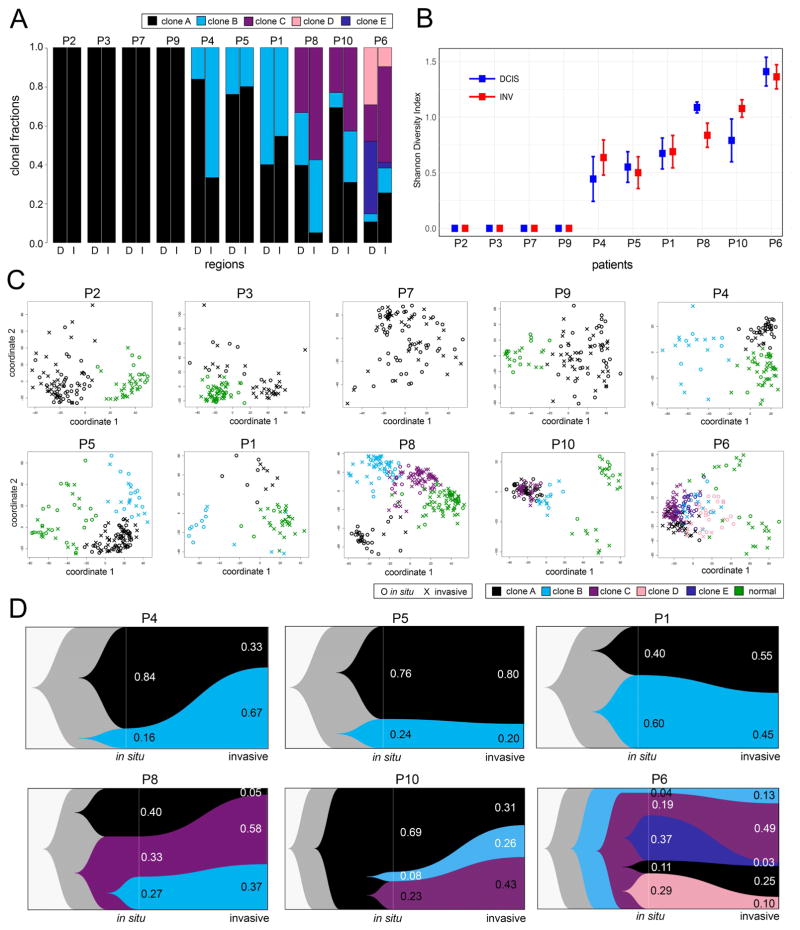
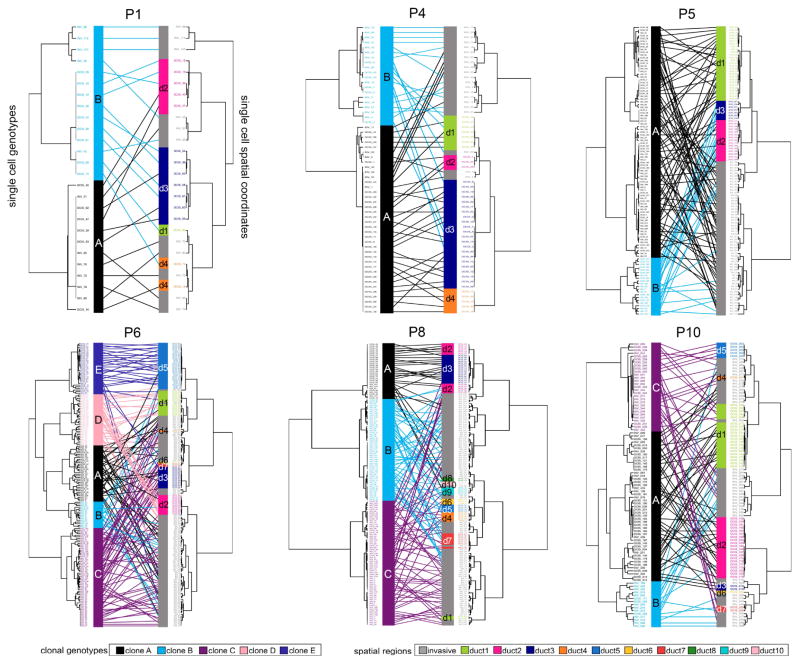
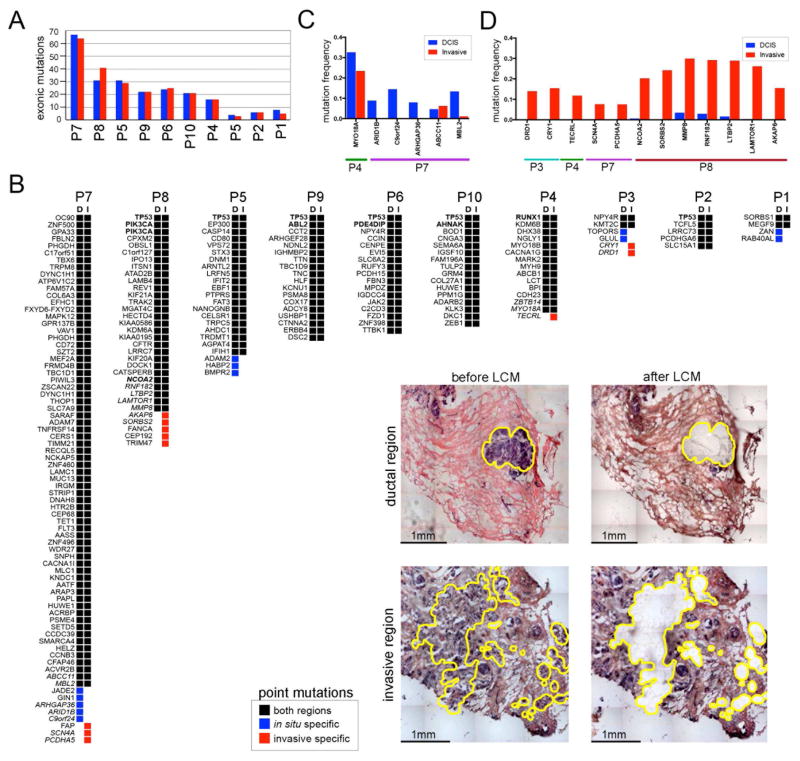
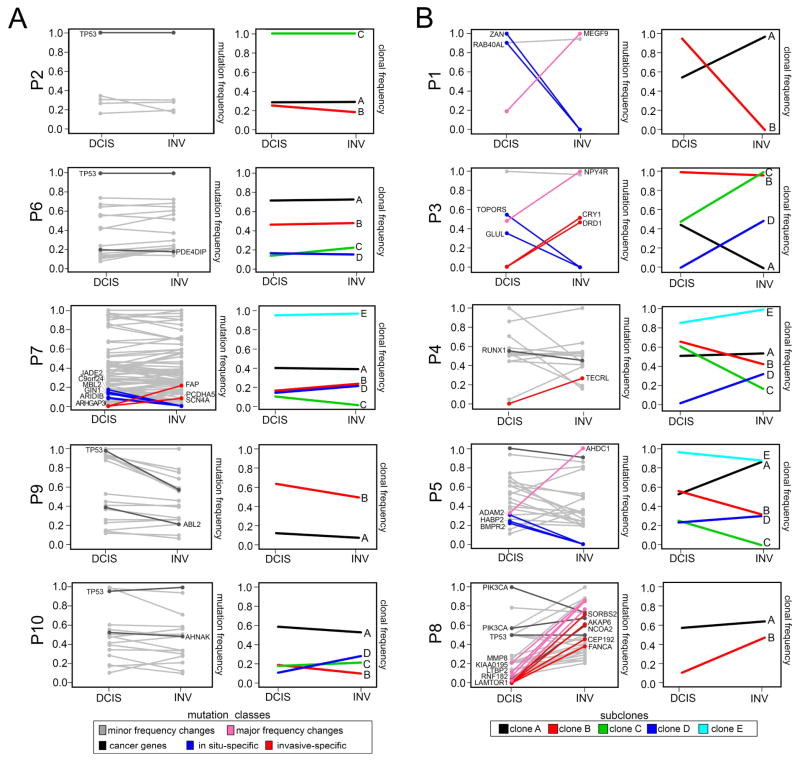
Ductal carcinoma in situ (DCIS) is an early-stage breast cancer that infrequently progresses to invasive ductal carcinoma (IDC). Genomic evolution has been difficult to delineate during invasion due to intratumor heterogeneity and the low number of tumor cells in the ducts. To overcome these challenges, we developed Topographic Single Cell Sequencing (TSCS) to measure genomic copy number profiles of single tumor cells while preserving their spatial context in tissue sections. We applied TSCS to 1,293 single cells from 10 synchronous patients with both DCIS and IDC regions in addition to exome sequencing. Our data reveal a direct genomic lineage between in situ and invasive tumor subpopulations and further show that most mutations and copy number aberrations evolved within the ducts prior to invasion. These results support a multiclonal invasion model, in which one or more clones escape the ducts and migrate into the adjacent tissues to establish the invasive carcinomas.

Keywords: breast cancer; breast cancer progression; cancer genomics; clonal evolution; copy number evolution; ductal carcinoma in situ; genome evolution; intratumor heterogeneity; invasion; single-cell sequencing.


Figures

Figure 1
Figure 1. Topographic Single Cell Sequencing of DCIS Tissues
(A) Whole-tissue scanning is performed on H&E stained synchronous DCIS tissues at low 10X magnification. (B) UV laser-microdissection of a single cell at 63X magnification (C) laser-catapulting transfer of a single cell into a collection tube. (D) automated robotic depositing of single cells into 8-well strip tubes with lysis buffer into a 96-well manifold, followed by whole-genome-amplification using DOP-PCR. (E) Construction of barcoded single cell libraries for multiplexed pooling and sparse whole-genome sequencing on the Illumina platform. (F) Processing of brightfield images of single cells and spatial XY coordinates. (G) Mapping of spatial coordinates and genomic data in tissue sections, showing examples of genomic copy number profiles from a normal cell, in situ tumor cell, and an invasive tumor cell.
Figure 2
Figure 2. Single Cell Copy Number Profiling in Patient P8
(A) Clustered heatmap of single cell copy number profiles with headers indicating the major subpopulations and tissue regions (in situ or invasive) from which the cells were isolated. Lower panels show consensus profiles of the major clonal subpopulations, with known cancer gene annotations for common CNAs listed above and divergent CNAs listed below. (B) Clonal lineages of the major tumor subpopulations plotted with Timescape with inferred common ancestors indicated in grey, and clonal frequencies labelled. (C) MDS plot of single cell copy number profiles with in situ or invasive regions indicated. (D) Spatial maps of tissue sections from four different tumor regions, with single cells marked as in situ or invasive. Tumor cells are color coded by their clonal genotypes or by diploid genomes, and ducts are annotated with different colors.
Figure 3
Figure 3. Single Cell Copy Number Profiling in Patient P4
(A) Clustered heatmap of single cell copy number profiles with headers indicating the major subpopulations and in situ or invasive regions from which the cells were isolated. Lower panels show consensus profiles of the major clonal subpopulations, with known cancer gene annotations for common CNAs listed above and divergent CNAs listed below. (B) Clonal lineages of the major tumor subpopulations plotted using Timescape with inferred common ancestors indicated in grey, and clonal frequencies labelled. (C) MDS plot of single cell copy number profiles with in situ or invasive regions indicated. (D) Spatial maps of tissue sections from two different tumor regions, with single cells marked as in situ or invasive. Tumor cells are colored by their clonal genotypes or by diploid genomes, and ducts are annotated with different colors.
Figure 4
Figure 4. Copy Number Substructure and Clonal Evolution in 10 DCIS Patients
(A) Bar plots of clonal frequencies calculated from single cell copy number profiles in the in situ (D) or invasive (I) regions. (B) Shannon Diversity indexes calculated from single cell copy number profiles from the in situ and invasive regions of each patient with confidence intervals. (C) MDS plots of single cell copy number profiles from each DCIS patient with clonal subpopulations and normal cells indicated by color, and in situ or invasive regions indicated by shape. (D) Clonal lineages of the major tumor subpopulations plotted using Timescape, with common ancestors indicated in grey and clonal frequencies labeled for the in situ and invasive regions.
Figure 5
Figure 5. Mapping of Spatial Coordinates and Clonal Genotypes
Genomic copy number trees were mapped to spatial coordinate trees using tanglegrams in the 6 polyclonal patients. Genotype trees are located on the left side for each patient, with clonal subpopulations indicated by color. Spatial trees are located on the right side with different ducts indicated by colors, and the invasive regions colored in grey. Mapping of cells coordinates and genotypes were performed by minimizing overlapping connections.
Figure 6
Figure 6. Exome Mutations in the in situ and Invasive Regions
Exome sequencing of laser-capture microdissected in situ and invasive regions. (A) Bar plot of exonic mutation frequencies detected in the in situ and invasive regions of 10 DCIS-IDC patients. (B) Oncomap of nonsynonymous mutations in the in situ and invasive regions from each patient. The presence or absence of mutations has been updated based on the results from amplicon deep-sequencing validation data. Known breast cancer genes are indicated in bold, while mutations that were validated by deep-amplicon sequencing are in italics. Inset panels show examples of brightfield images of in situ or invasive regions isolated by laser-capture-microdissection. (C) Amplicon targeted deep-sequencing of in situ-specific mutations. (D) Amplicon targeted deep-sequencing of the invasive-specific mutations.
Figure 7
Figure 7. Mutation Frequencies and Clonal Dynamics During Invasion
Purity adjusted mutation frequencies and clonal subpopulations and frequencies inferred from exome data. (A) Patients with minor changes in mutation and clonal frequencies. (B) Patients with large mutation or clonal frequency changes during invasion. The left panels show purity-adjusted nonsynonymous mutation frequencies for the in situ and invasive regions. Lines in grey indicate mutations with minor frequency changes, while lines in pink show large frequency changes (>0.5) between the in situ and invasive regions. Mutations in dark grey indicate driver mutations, while mutations in blue are in-situ and red are invasive-specific. Right panels indicate clonal subpopulations and frequencies inferred by PyClone2 and CITUP, with lines indicating different clonal subpopulations.

Comment in

Similar articles

Cited by

References

    1. Aceto N, Bardia A, Miyamoto DT, Donaldson MC, Wittner BS, Spencer JA, Yu M, Pely A, Engstrom A, Zhu H, et al. Circulating tumor cell clusters are oligoclonal precursors of breast cancer metastasis. Cell. 2014;158:1110–1122. - PMC - PubMed
    1. Allred DC. Ductal carcinoma in situ: terminology, classification, and natural history. J Natl Cancer Inst Monogr. 2010;2010:134–138. - PMC - PubMed
    1. Allred DC, Wu Y, Mao S, Nagtegaal ID, Lee S, Perou CM, Mohsin SK, O’Connell P, Tsimelzon A, Medina D. Ductal carcinoma in situ and the emergence of diversity during breast cancer evolution. Clin Cancer Res. 2008;14:370–378. - PubMed
    1. Andl CD, Mizushima T, Oyama K, Bowser M, Nakagawa H, Rustgi AK. EGFR-induced cell migration is mediated predominantly by the JAK-STAT pathway in primary esophageal keratinocytes. Am J Physiol Gastrointest Liver Physiol. 2004;287:G1227–1237. - PubMed
    1. Baslan T, Kendall J, Rodgers L, Cox H, Riggs M, Stepansky A, Troge J, Ravi K, Esposito D, Lakshmi B, et al. Genome-wide copy number analysis of single cells. Nat Protoc. 2012;7:1024–1041. - PMC - PubMed

Publication types