

Discovery of Next-Generation Antimicrobials through Bacterial Self-Screening of Surface-Displayed Peptide Libraries
- PMID: 29307492
- PMCID: PMC5786472
- DOI: 10.1016/j.cell.2017.12.009
Discovery of Next-Generation Antimicrobials through Bacterial Self-Screening of Surface-Displayed Peptide Libraries
Abstract
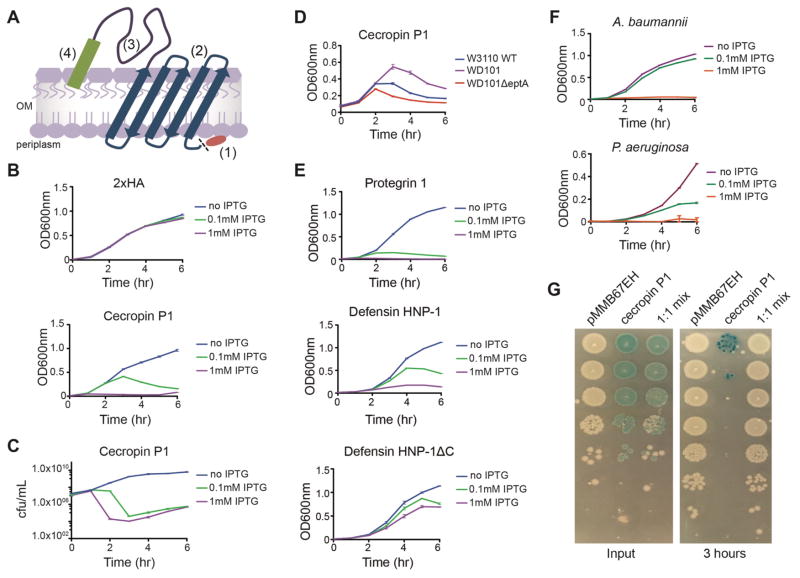
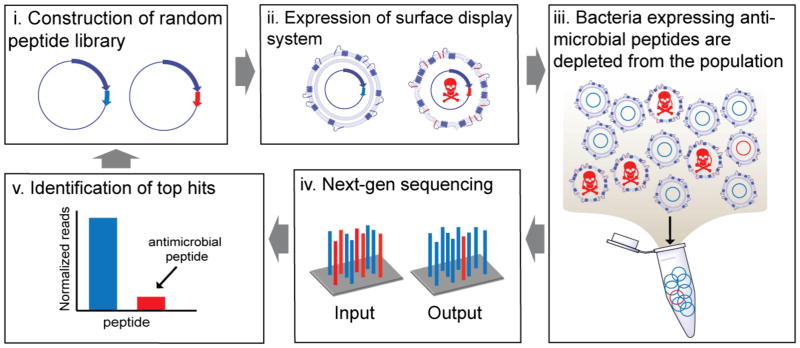
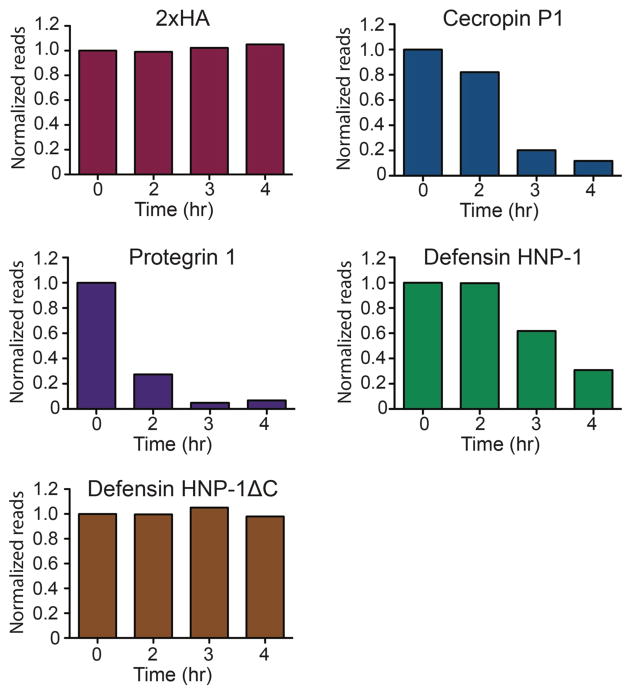
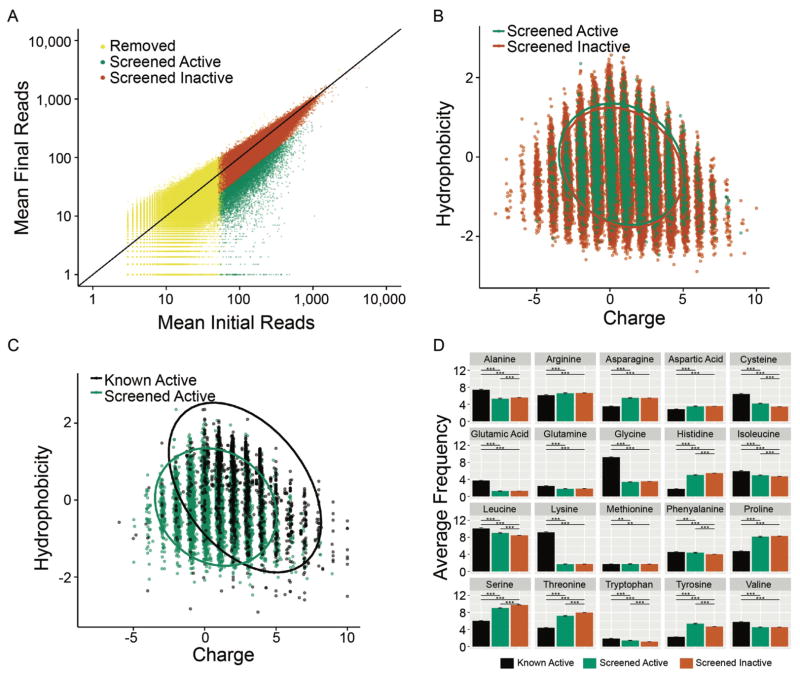
Peptides have great potential to combat antibiotic resistance. While many platforms can screen peptides for their ability to bind to target cells, there are virtually no platforms that directly assess the functionality of peptides. This limitation is exacerbated when identifying antimicrobial peptides because the phenotype, death, selects against itself and has caused a scientific bottleneck that confines research to a few naturally occurring classes of antimicrobial peptides. We have used this seeming dissonance to develop Surface Localized Antimicrobial Display (SLAY), a platform that allows screening of unlimited numbers of peptides of any length, composition, and structure in a single tube for antimicrobial activity. Using SLAY, we screened ∼800,000 random peptide sequences for antimicrobial function and identified thousands of active sequences, dramatically increasing the number of known antimicrobial sequences. SLAY hits present with different potential mechanisms of peptide action and access to areas of antimicrobial physicochemical space beyond what nature has evolved. VIDEO ABSTRACT.
Keywords: antibiotic resistance; bacteria; drug discovery; high-throughput screening; infectious diseases.
Copyright © 2017 Elsevier Inc. All rights reserved.
Figures
Similar articles
-
Discovery of Antimicrobial Peptide Macrocycles Through Bacterial Display.Methods Mol Biol. 2022;2371:287-298. doi: 10.1007/978-1-0716-1689-5_15. Methods Mol Biol. 2022. PMID: 34596854
-
Small angle X-ray scattering as a high-throughput method to classify antimicrobial modes of action.Biochim Biophys Acta. 2016 May;1858(5):918-25. doi: 10.1016/j.bbamem.2015.12.022. Epub 2015 Dec 28. Biochim Biophys Acta. 2016. PMID: 26730877
-
High-throughput expression of animal venom toxins in Escherichia coli to generate a large library of oxidized disulphide-reticulated peptides for drug discovery.Microb Cell Fact. 2017 Jan 17;16(1):6. doi: 10.1186/s12934-016-0617-1. Microb Cell Fact. 2017. PMID: 28095880 Free PMC article.
-
Using the Bacterial Ribosome as a Discovery Platform for Peptide-Based Antibiotics.Biochemistry. 2019 Jan 15;58(2):75-84. doi: 10.1021/acs.biochem.8b00927. Epub 2018 Nov 8. Biochemistry. 2019. PMID: 30372045 Free PMC article. Review.
-
Optimization and high-throughput screening of antimicrobial peptides.Curr Pharm Des. 2010;16(28):3204-11. doi: 10.2174/138161210793292438. Curr Pharm Des. 2010. PMID: 20687884 Review.
Cited by
-
Emerging drug development technologies targeting ubiquitination for cancer therapeutics.Pharmacol Ther. 2019 Jul;199:139-154. doi: 10.1016/j.pharmthera.2019.03.003. Epub 2019 Mar 7. Pharmacol Ther. 2019. PMID: 30851297 Free PMC article. Review.
-
A haem-sequestering plant peptide promotes iron uptake in symbiotic bacteria.Nat Microbiol. 2022 Sep;7(9):1453-1465. doi: 10.1038/s41564-022-01192-y. Epub 2022 Aug 11. Nat Microbiol. 2022. PMID: 35953657 Free PMC article.
-
Creation of Recombinant Biocontrol Agents by Genetic Programming of Yeast.Acta Naturae. 2023 Jan-Mar;15(1):74-80. doi: 10.32607/actanaturae.11878. Acta Naturae. 2023. PMID: 37153506 Free PMC article.
-
Thanatin: An Emerging Host Defense Antimicrobial Peptide with Multiple Modes of Action.Int J Mol Sci. 2021 Feb 3;22(4):1522. doi: 10.3390/ijms22041522. Int J Mol Sci. 2021. PMID: 33546369 Free PMC article. Review.
-
A review on the screening methods for the discovery of natural antimicrobial peptides.J Pharm Anal. 2025 Jan;15(1):101046. doi: 10.1016/j.jpha.2024.101046. Epub 2024 Jul 18. J Pharm Anal. 2025. PMID: 39885972 Free PMC article. Review.
References
-
- Belloc F, Dumain P, Boisseau MR, Jalloustre C, Reiffers J, Bernard P, Lacombe F. A Flow Cytometric Method Using Hoechst-33342 and Propidium Iodide for Simultaneous Cell-Cycle Analysis and Apoptosis Determination in Unfixed Cells. Cytometry. 1994;17:59–65. - PubMed
-
- Brunetti J, Falciani C, Bracci L, Pini A. Models of In-Vivo Bacterial Infections for the Development of Antimicrobial Peptide-based Drugs. Curr Top Med Chem. 2017;17:613–619. - PubMed
-
- Carmona G, Rodriguez A, Juarez D, Corzo G, Villegas E. Improved protease stability of the antimicrobial peptide Pin2 substituted with D-amino acids. Protein J. 2013;32:456–466. - PubMed
Publication types
MeSH terms
Substances
Grants and funding
LinkOut - more resources
Full Text Sources
Other Literature Sources
Medical
Molecular Biology Databases
