. 2018 Jan 11;172(1-2):289-304.e18.
doi: 10.1016/j.cell.2017.12.014. Epub 2018 Jan 4.

The Dynamic Landscape of Open Chromatin during Human Cortical Neurogenesis

Affiliations

The Dynamic Landscape of Open Chromatin during Human Cortical Neurogenesis

Luis de la Torre-Ubieta et al. Cell. .

Abstract

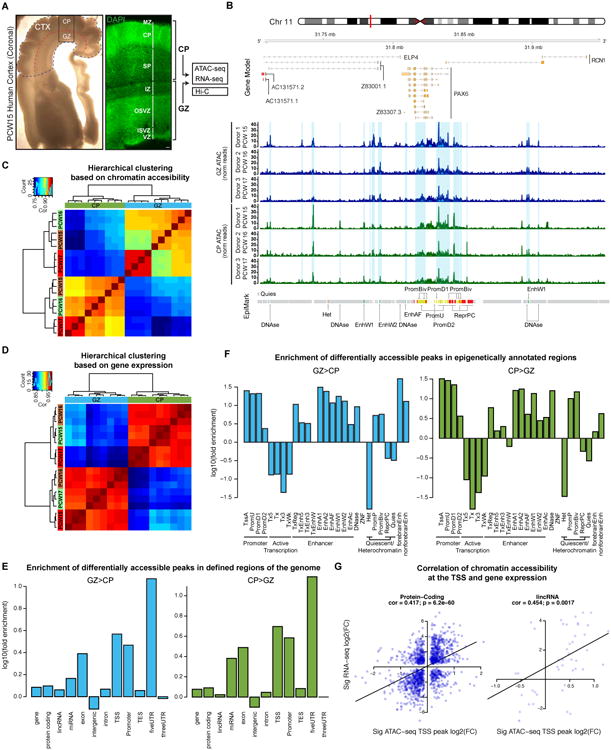
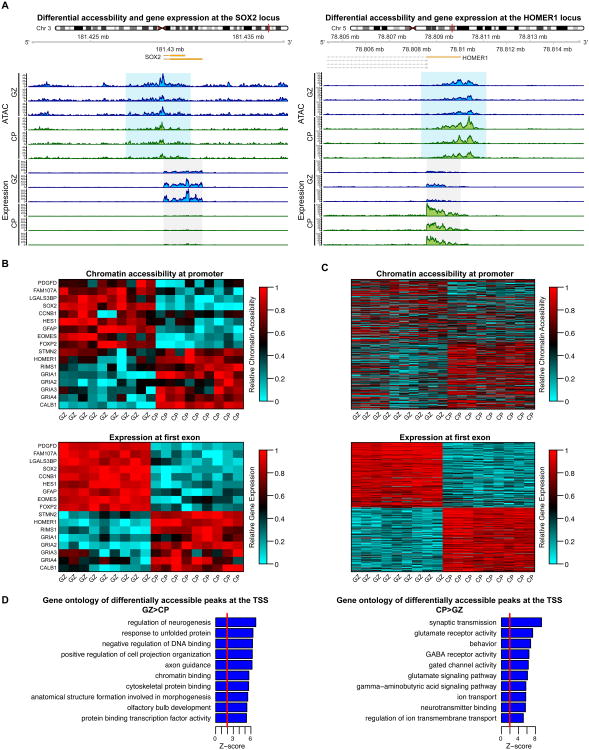
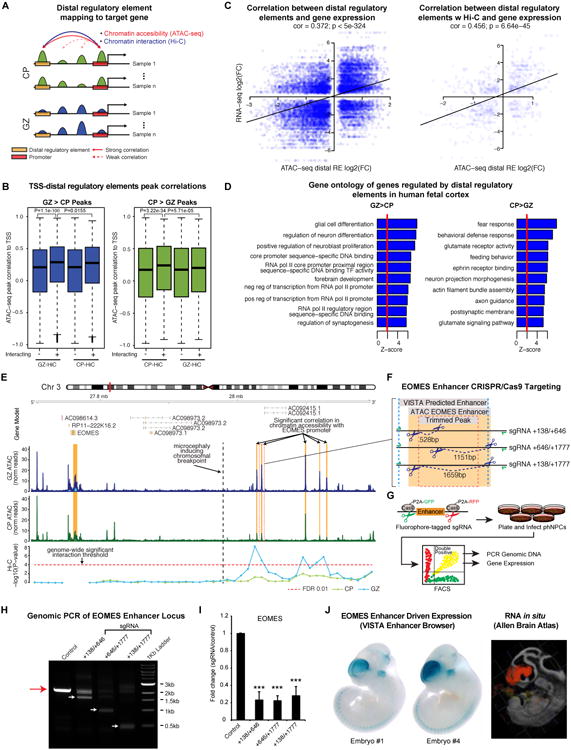
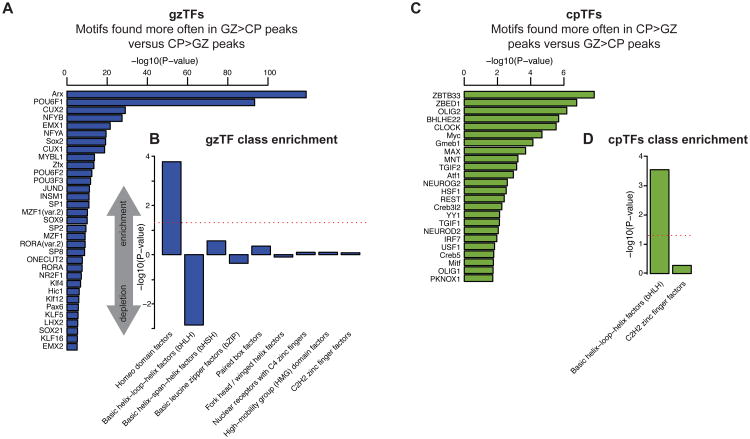
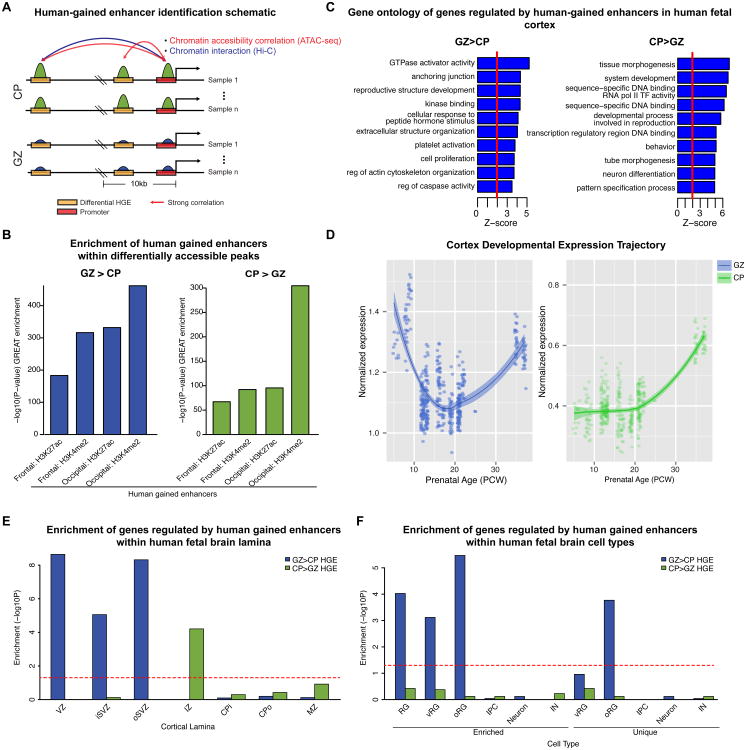
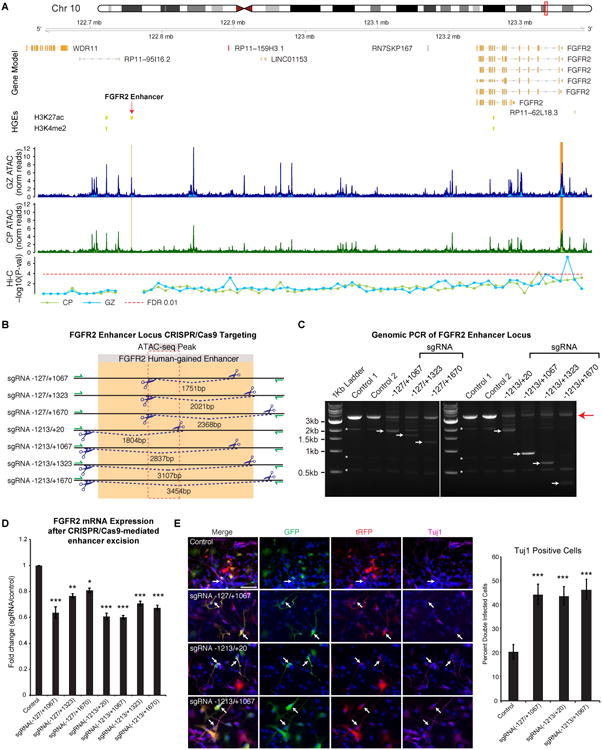
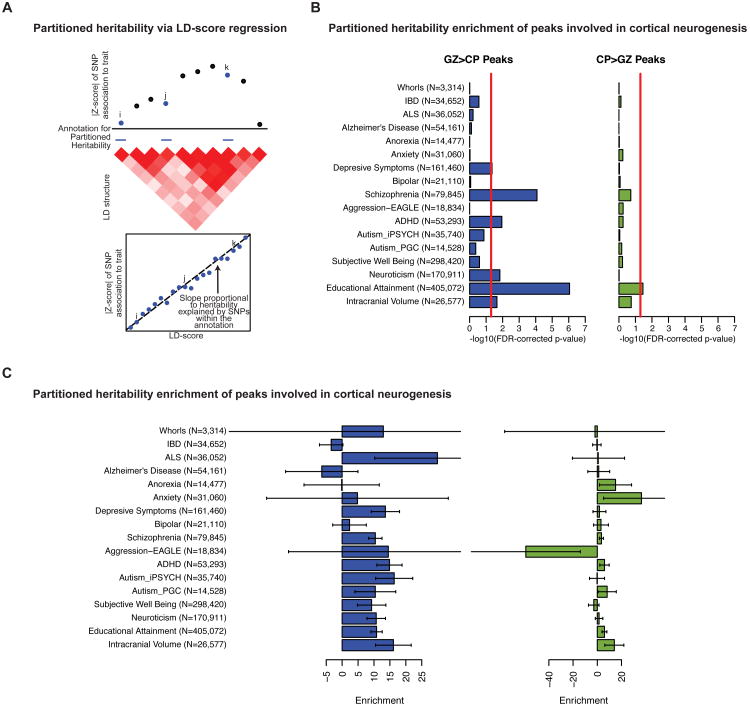
Non-coding regions comprise most of the human genome and harbor a significant fraction of risk alleles for neuropsychiatric diseases, yet their functions remain poorly defined. We created a high-resolution map of non-coding elements involved in human cortical neurogenesis by contrasting chromatin accessibility and gene expression in the germinal zone and cortical plate of the developing cerebral cortex. We link distal regulatory elements (DREs) to their cognate gene(s) together with chromatin interaction data and show that target genes of human-gained enhancers (HGEs) regulate cortical neurogenesis and are enriched in outer radial glia, a cell type linked to human cortical evolution. We experimentally validate the regulatory effects of predicted enhancers for FGFR2 and EOMES. We observe that common genetic variants associated with educational attainment, risk for neuropsychiatric disease, and intracranial volume are enriched within regulatory elements involved in cortical neurogenesis, demonstrating the importance of this early developmental process for adult human cognitive function.

Keywords: ATAC-seq; chromatin; enhancers; evolution; human neocortical development; transcription factors.


Conflict of interest statement

The authors declare no financial conflict of interest.

Figures

Figure 1
Figure 1
Defining regions of differential chromatin accessibility in developing human neocortex. (A) Left: Brightfield coronal section from PCW 15 neocortex (CTX) showing the dissected regions processed for ATAC-seq, RNA-seq, and Hi-C: cortical plate (CP) and germinal zone (GZ). Right: DAPI staining of a coronal section showing the dissected lamina: GZ encompasses the ventricular zone (VZ), inner and outer subventricular zone (I/OSVZ), and intermediate zone (IZ); and CP encompasses the subplate (SP), cortical plate (CP) and marginal zone (MZ). (B) DA peaks (highlighted in sky blue) above coverage maps of normalized reads from ATAC-seq are shown near the PAX6 gene on chromosome 11 along with chromatin states derived from fetal tissue. (C) Hierarchical clustering based on ATAC-seq genome-wide normalized reads within peaks shows high technical reproducibility and strong biological differences between GZ and CP. (D) Hierarchical clustering based on RNA-seq transcriptome-wide normalized reads within genes shows similar results as chromatin accessibility clustering. (E) Fold enrichment of DA peaks within defined regions of the genome shows strong enrichment in regions near promoters (TSS, Promoter, 5′ UTR). (F) Fold enrichment of DA peaks in fetal brain derived chromatin states shows enrichment in enhancer and promoter regions. (G) Correlation between effect sizes of significantly DA promoters and significantly DE exons closest to those promoters show a variable but positive correlation between chromatin accessibility at the promoter and expression for both protein-coding genes and lncRNAs. Chromatin states are defined in STAR*Methods. See also Figures S1-3 and Table S1.
Figure 2
Figure 2
The relationship between DA chromatin at promoter regions with gene expression and biological pathways. (A) Chromatin accessibility and gene expression coverage maps for genes expressed in neural progenitor cells (SOX2) or differentiated neurons (HOMER1) show the expected patterns of chromatin accessibility and expression (GZ>CP for SOX2 and CP>GZ for HOMER1). (B) Heatmaps of chromatin accessibility and expression of the exon closest to the promoter for selected genes canonically involved in neural development across samples show a variable but positive correlation between chromatin accessibility and gene expression. (C) A similar relationship between chromatin accessibility and gene expression is observed when selecting the top 240 DE genes. (D) Genes with DA promoters fall into known functional categories related to neural development as determined by GO analysis. See also Figure S4.
Figure 3
Figure 3
Mapping DREs involved in cortical neurogenesis to their cognate genes. (A) A schematic showing chromatin accessibility correlation and chromatin interaction assays used to map DREs to their cognate genes. (B) Distal ATAC-seq peaks show on average a higher correlation to promoter peaks when supported by chromatin interaction derived from their cognate GZ or CP tissue. GZ>CP and CP>GZ peaks show significantly higher peak correlation when supported by GZ or CP Hi-C data as compared to the absence of Hi-C support, respectively (GZ: P=1.1×10-100, CP: P=3.22×10⁻³⁴). (C) The correlation between DREs accessibility and gene expression of their cognate gene shows a stronger relationship when the regulatory element is mapped using both chromatin accessibility correlation and interaction rather than chromatin accessibility correlation alone. (D) DA DREs are mapped onto genes supported by both chromatin accessibility correlation and chromatin interaction that fall into known biological pathways involved in neural development. See also Table S2. (E) An example of DRE mapping is provided at the EOMES locus, where DREs are supported by both chromatin interaction via Hi-C in GZ tissue and chromatin accessibility correlation. The location of a chromosomal breakpoint for a balanced chromosomal translocation that leads to complete absence of EOMES expression and microcephaly is shown (Baala et al., 2007). (F) Three distinct sgRNA pairs were designed to excise the EOMES enhancer. Overlap of ATAC-seq differential peak and predicted VISTA forebrain enhancer is shown. Primers used to validate genomic deletions are represented by green half arrows. (G) Schematic of functional validation of EOMES enhancer. sgRNA pairs flanking the EOMES enhancer were delivered along with P2A-linked GFP or RFP Cas9 via lentiviral infection into phNPCs. Following 3 wks of differentiation, cells containing both sgRNAs were selected via FACS and probed for enhancer excision and EOMES expression. (H) Genomic PCR of the 1.8kb region containing the EOMES enhancer in control or CRISPR/Cas9 + sgRNA infected phNPCs. Red arrow points to the expected 2107bp band in controls and white arrows point to expected products following excision (see 3F). (I) Excision of the EOMES enhancer led to a 72-77% reduction in EOMES expression as measured by qPCR in phNPCs (***P<0.0001, **P<0.001, *P<0.01, ANOVA, with Bonferroni post-hoc test, n=4, mean ± SEM shown). (J) VISTA predicted EOMES enhancer reporter (LacZ staining) (https://enhancer.lbl.gov/) and RNA in situ hybridization for EOMES (http://developingmouse.brain-map.org/) at E11.5. Reporter signal and EOMES RNA expression display a similar pattern with enrichment in the telencephalon. See also Table S4 and Figure S5.
Figure 4
Figure 4
Predicting TFs involved in neural progenitor proliferation and neurogenesis. (A,C) TFs with significant differential enrichment of conserved motifs in DA peaks. The statistical test identifies TFs likely involved in neural progenitor proliferation and maintenance (gzTFs; A) or neurogenesis and maturation (cpTFs; C). An abridged list is shown here for clarity, and the full list can be found in Table S3. (B,D) Enrichment of TF classes for gzTFs (B) or cpTFs (D). See also Figure S4.
Figure 5
Figure 5
Gene expression, biological pathways, and cell-types impacted by HGEs. (A) schematic showing chromatin accessibility correlation and chromatin interaction are used to nominate genes regulated by DREs. (B) HGEs are strongly enriched in DA peaks. (C) GO analysis of genes regulated by HGEs within GZ>CP DA peaks. (D) Gene expression profiles throughout prenatal human cortical development (Kang et al., 2011) are shown for genes regulated by GZ>CP (GZ) or CP>GZ (CP) HGEs. (E) Enrichment of genes regulated by HGEs within specific human fetal cortical laminae (Miller et al., 2014) (VZ: ventricular zone; i/oSVZ: inner/outer subventricular zone; IZ: intermediate zone; CPi/o: inner/outer cortical plate; MZ: marginal zone). Enrichment of GZ HGEs targets is observed in the progenitor-enriched VZ, iSVZ and oSVZ, whereas CP HGEs targets show enrichment in the IZ enriched in migrating neurons. (F) Enrichment of genes regulated by HGEs within specific cell types present in human fetal cortex (Pollen et al., 2015) (RG: radial glia, IPC: intermediate progenitor cell; IN: inhibitory neuron; v/oRG: ventricular or outer radial glia). Enrichment of GZ HGEs targets is observed in vRGs and oRGs and oRG-unique genes. Cell type gene sets enriched or unique (no overlapping genes between cell types) are shown.
Figure 6
Figure 6
FGFR2 is a target of a HGE impacting human cortical neurogenesis. (A) An HGE within a DA peak interacts with the FGFR2 promoter with evidence from both chromatin accessibility correlation and chromatin interaction. (B) Seven sgRNA pairs were used to excise the DA peak and/or the overlapping HGE peak measured via H3K27ac ChIP-seq. Primers used to validate genomic deletions are represented by green half arrows. (C) Genomic PCR of the 3.7kb region containing the FGFR2 HGE in control or CRISPR/Cas9 + sgRNA infected phNPCs. Red arrow points to the expected 2107bp band in controls and white arrows point to expected products following excision (see 6B). Asterisks indicate background PCR amplicons. (D) Excision of the FGFR2 HGE led to a 19-40% reduction in FGFR2 expression as measured by qPCR in phNPCs (***P<0.0001, **P<0.001, *P<0.01, ANOVA, with Bonferroni post-hoc test, n=4, mean ± SEM shown). (E) Excision of the FGFR2 HGE led to an increase in the number of neurons generated after two weeks of differentiation. phNPCs infected with sgRNA pairs designed to excise the FGFR2 enhancer were stained with antibodies to GFP, tRFP, and the early neuron marker Tuj1. The percent of dual GFP/RFP+ cells positive for Tuj1 (arrows) was quantified. Co-infection with any of the three sgRNA pairs led to an increase in Tuj1+ positive cells compared to control (P=1.31×10⁻⁷, sgRNA -127/+1067; P=2.38×10⁻⁸, sgRNA -1213/+1067; P=1.44×10⁻⁸, sgRNA - 1213/+20; n=4 independent infections with 30 image fields/infection, mean ± SEM shown). Scale bar = 50μm. See also Table S4 and Figure S6.
Figure 7
Figure 7
Common genetic variation within DA peaks affects adult cognition, risk for neuropsychiatric disease, and global brain size. (A) A schematic demonstrating the partitioned heritability approach via LD (linkage disequilibrium)-score regression implemented to determine enrichment of association statistics within DA peaks. (B) The FDR-corrected significance of partitioned heritability enrichment demonstrates a significant enrichment of heritability in specific brain traits. References for each GWAS is found in the STAR*Methods. (C) Partitioned heritability enrichment across multiple GWAS. Error bars represent standard error. See also Figure S7.

Comment in

References

    1. Aarts E, Verhage M, Veenvliet JV, Dolan CV, van der Sluis S. A solution to dependency: using multilevel analysis to accommodate nested data. Nat Neurosci. 2014;17:491–496. - PubMed
    1. Adams HH, Hibar DP, Chouraki V, Stein JL, Nyquist PA, Renteria ME, Trompet S, Arias-Vasquez A, Seshadri S, Desrivieres S, et al. Novel genetic loci underlying human intracranial volume identified through genome-wide association. Nat Neurosci. 2016;19:1569–1582. - PMC - PubMed
    1. Amano T, Sagai T, Tanabe H, Mizushina Y, Nakazawa H, Shiroishi T. Chromosomal dynamics at the Shh locus: limb bud-specific differential regulation of competence and active transcription. Developmental cell. 2009;16:47–57. - PubMed
    1. Arnold SJ, Huang GJ, Cheung AF, Era T, Nishikawa S, Bikoff EK, Molnar Z, Robertson EJ, Groszer M. The T-box transcription factor Eomes/Tbr2 regulates neurogenesis in the cortical subventricular zone. Genes Dev. 2008;22:2479–2484. - PMC - PubMed
    1. Baala L, Briault S, Etchevers HC, Laumonnier F, Natiq A, Amiel J, Boddaert N, Picard C, Sbiti A, Asermouh A, et al. Homozygous silencing of T-box transcription factor EOMES leads to microcephaly with polymicrogyria and corpus callosum agenesis. Nat Genet. 2007;39:454–456. - PubMed

Publication types

MeSH terms