. 2018 Jan 22;28(2):287-295.e6.
doi: 10.1016/j.cub.2017.11.064. Epub 2018 Jan 4.

Vps13D Encodes a Ubiquitin-Binding Protein that Is Required for the Regulation of Mitochondrial Size and Clearance

Affiliations

Vps13D Encodes a Ubiquitin-Binding Protein that Is Required for the Regulation of Mitochondrial Size and Clearance

Allyson L Anding et al. Curr Biol. .

Abstract

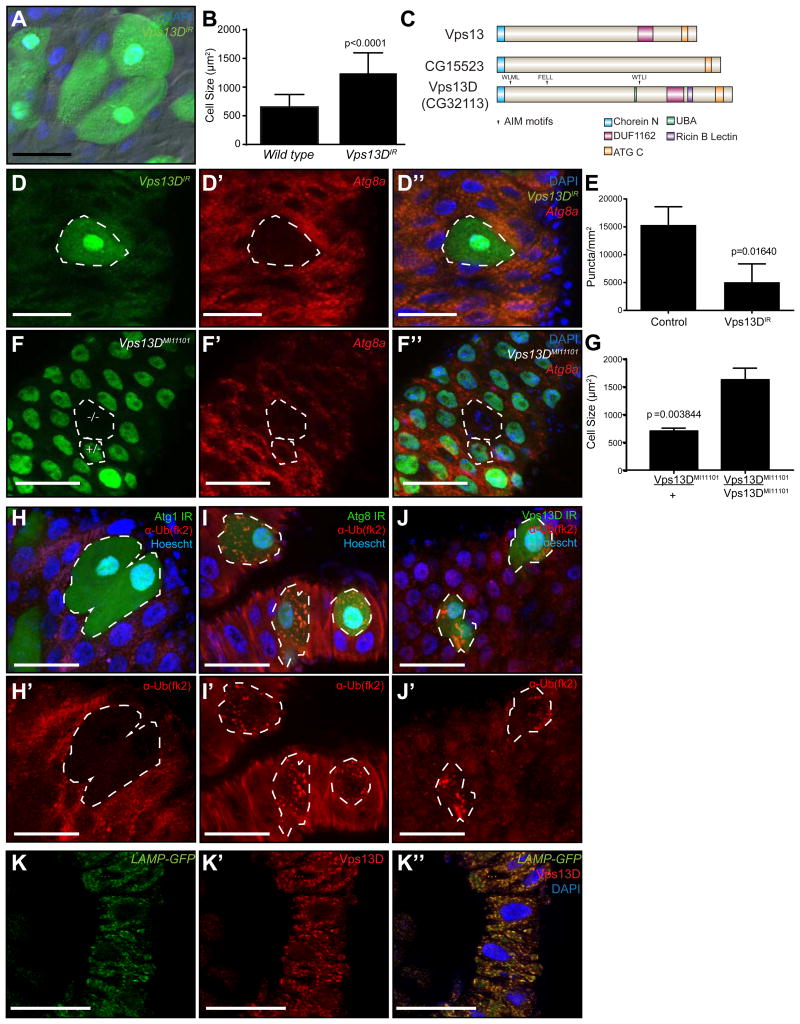
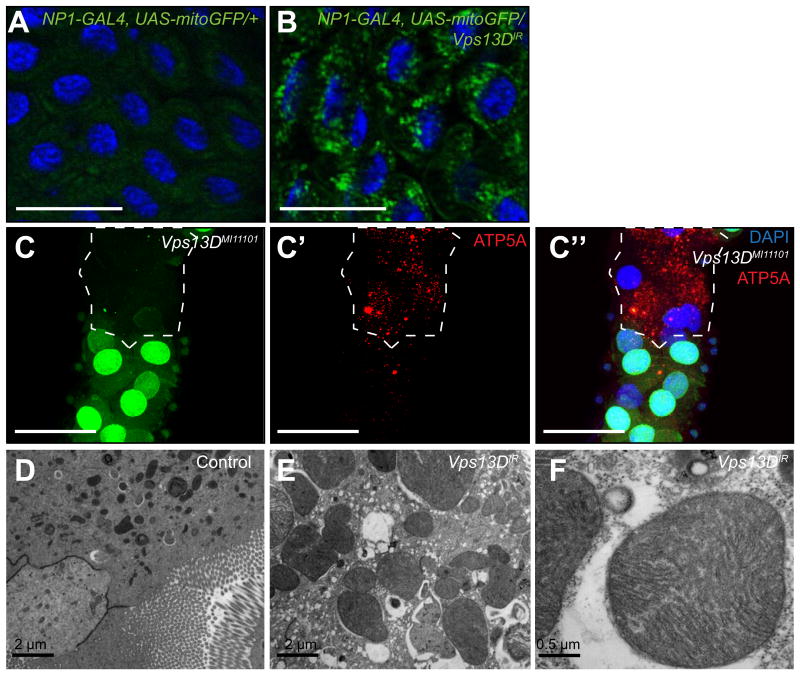
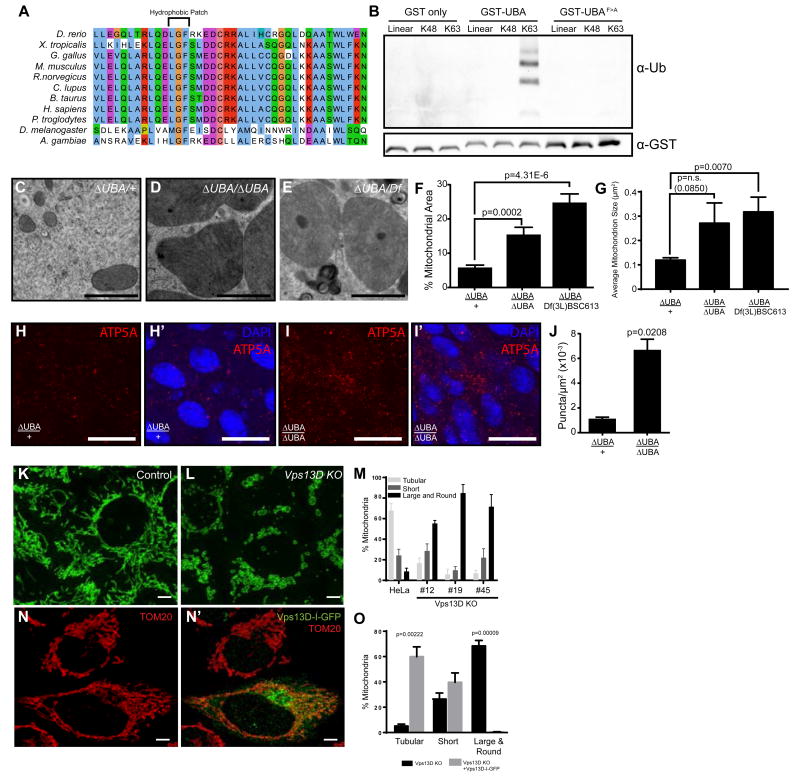
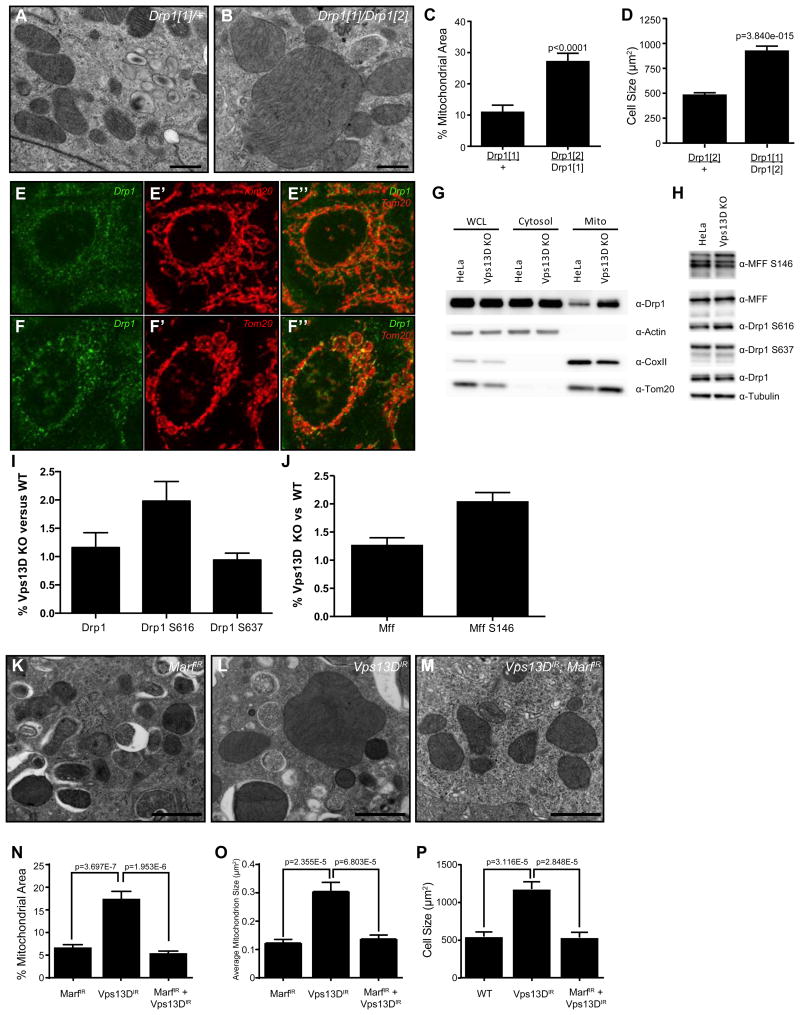
The clearance of mitochondria by autophagy, mitophagy, is important for cell and organism health [1], and known to be regulated by ubiquitin. During Drosophila intestine development, cells undergo a dramatic reduction in cell size and clearance of mitochondria that depends on autophagy, the E1 ubiquitin-activating enzyme Uba1, and ubiquitin [2]. Here we screen a collection of putative ubiquitin-binding domain-encoding genes for cell size reduction and autophagy phenotypes. We identify the endosomal sorting complex required for transport (ESCRT) components TSG101 and Vps36, as well as the novel gene Vps13D. Vps13D is an essential gene that is necessary for autophagy, mitochondrial size, and mitochondrial clearance in Drosophila. Interestingly, a similar mitochondrial phenotype is observed in VPS13D mutant human cells. The ubiquitin-associated (UBA) domain of Vps13D binds K63 ubiquitin chains, and mutants lacking the UBA domain have defects in mitochondrial size and clearance and exhibit semi-lethality, highlighting the importance of Vps13D ubiquitin binding in both mitochondrial health and development. VPS13D mutant cells possess phosphorylated DRP1 and mitochondrial fission factor (MFF) as well as DRP1 association with mitochondria, suggesting that VPS13D functions downstream of these known regulators of mitochondrial fission. In addition, the large Vps13D mitochondrial and cell size phenotypes are suppressed by decreased mitochondrial fusion gene function. Thus, these results provide a previously unknown link between ubiquitin, mitochondrial size regulation, and autophagy.

Keywords: Drosophila; Vps13D; autophagy; fission; mitochondria; mitophagy; ubiquitin.


Figures

Figure 1
Figure 1. Vps13D functions in programmed cell size reduction and Atg8 puncta formation in the Drosophila intestine
(A) Control and Vps13D knockdown (green) cells in the Drosophila midgut stained with DAPI (blue). (B) Quantitation of control wild type and Vps13D knockdown cell size from at least 76 cells in at least 9 intestines of either control or knockdown cell clones. (C) Schematic of the Vps13 family. Drosophila Vps13D is the only Vps13 family member with a UBA domain. Atg8 interacting motifs analyzed in the manuscript are marked with arrows. (D-D”) Clonal knockdown of Vpsl3D (green cells) impairs mCherry-Atg8a puncta formation (red). (E) Quantitation of mCherry-Atg8a puncta in control and Vpsl3D knockdown cell clones from at least 28 clones in 4 intestines. (F-F”) MiMIC insertion Vpsl3D mutant cell clones phenocopy Vpsl3D knockdown failure in cell size reduction and mCherry-Atg8a autophagy reporter puncta formation (red). The mutant clone (-/-; top cell) and an example of a heterozygous control cell (+/-; bottom cell) are outlined in white. (G) Quantitation of Vpsl3D mutant and heterozygous control (green) cell size from clones from three intestines. (H-J') (H-H'), Atg8a (I-I'), and Vpsl3D (J-J') knockdown (green) cells in the Drosophila midgut stained with DAPI (blue) and ubiquitin (fk2) antibody (red). Results are representative of at least three intestines per genotype. (K-K”) Intestines expressing LAMP-GFP (green) were dissected 2h after puparium formation and stained with DAPI (blue) and Vpsl3D antibody (red). Results are representative of at least three intestines. Scale bars in all images represent 50um. See also: Figures SI and S2, Table SI
Figure 2
Figure 2. Vpsl3D function is required for mitochondrial clearance and size control in the Drosophila intestine
(A) Mito-GFP in control gut and (B) Vps13D knockdown midguts 2 h after puparium formation. Results are representative of at least three biological replicates. Scale bars represent 50 μm. (C-C”) MiMIC insertion Vps13D mutant midgut cells (lacking GFP) possess persistent mitochondrial ATP5A protein compared to neighboring control cells (GFP-positive) indicating a defect in the clearance of mitochondria. Scale bars represent 50 μm. (D-F) Knockdown of Vps13D results in enlarged midgut mitochondria compared to mitochondria from control w1118 animal midguts. Results are representative of at least three biological replicates. See also: Figure S3
Figure 3
Figure 3. Vps13D ubiquitin binding is required for mitochondrial size in Drosophila and humans
(A) Vps13D contains a UBA domain with a conserved hydrophobic patch known to mediate the interaction with poly-ubiquitin. (B) Interaction of the Vps13D UBA domain or a phenylalanine to alanine mutant with tetra-ubiquitin chains. Results are representative of at least three binding assays. (C) TEM highlighting the mitochondria of Vps13D UBA domain (∆UBA) heterozygous and (D) homozygous mutants as well as (E) Vps13D∆UBA/Df(3L)BSC613 midguts. Scale bars represent 1 μm. (F) Percent area occupied by mitochondria and (G) average mitochondrion size quantitated from at least 5 fields from 3 intestines per sample. (H-H’) ATP5A staining in Vps13D∆UBA/+ control guts 2 h after puparium formation. Results are representative of six biological replicates. Scale bars represent 25 μm. (I-I’) ATP5A staining in Vps13D∆UBA/Vps13D∆UBA mutant guts 2 h after puparium formation. Results are representative of six biological replicates. Scale bars represent 25 μm. (J) ATP5A staining is quantitated from 3 intestines each from heterozygous control and mutant midguts. (K) TOM20 labeling of control and (L) Vps13D KO HeLa cells. Scale bars represent 5 μm. (M) Quantitation of percent mitochondria representing tubular, short, or large and round phenotypes in control HeLa or Vps13D KO cell lines #12, #19 and #45. Results are representative of three biological replicates. For tubular mitochondria, P values are all <0.0001 for #12, #19 and #45 vs control HeLa. For short mitochondria, P=0.85, 0.07, 0.98 respectively for #12, #19 and #45 vs control HeLa. For large and round mitochondria, P values are all <0.0001 for #12, #19 and #45 vs control HeLa. (N-N’) Vps13D tagged internally with GFP (Vps13D-I-GFP) rescues the large and round mitochondrial phenotype seen in Vps13D KO cells. Scale bars represent 5 μm. Results are quantitated in (O) and are representative of three biological replicates. See also: Figures S3 and S4
Figure 4
Figure 4. Decreased Vps13D function leads to enlarged mitochondria because of a defect in mitochondrial dynamics
(A-B) TEM of Drp1 heterozygous (A) versus transheterozygous (B) mutant intestines. Scale bars represent 0.5 μm. (C) Homozygous Drp1 mutant intestine cells fail to clear mitochondria compared to a control Drp1/+ intestine (results are quantitated from at least 4 fields from 2 (controls) or 3 (mutant) intestines). (D) Drp1 mutant intestine cells exhibit a defect in programmed cell size reduction (quantitated from 41 cells from 4 guts/genotype). (E-E”) Drp1 localization in control versus (F-F”) Vps13D KO HeLa cells co-stained with Tom20. Scale bars represent 5 μm. (G) Western blot analysis of Drp1 accumulation on mitochondria in Vps13D KO versus wild type HeLa cells. Actin, COXII, and Tom20 were used to identify the cytosolic (cytosol) and mitochondrial (mito) fractions. (H) Western blot analysis of Drp1 and MFF phosphorylation in Vps13D KO versus control HeLa cells. Western results are representative of at least three independent experiments. (I, J) Quantitation of three replicates of the western blot in (H). (K) TEM of Marf IR, Vps13D IR (L), and Vps13D, Marf double knockdown (M) intestines. Scale bars represent 1 μm. (N) Percent mitochondrial area, (O) average mitochondrion size, and (P) cell size in Marf, Vps13D, and Marf Vps13D double knockdown intestines. Results are representative of at least three biological replicates. See also: Figure S4

Comment in

References

    1. Stolz A, Ernst A, Dikic I. Cargo recognition and trafficking in selective autophagy. Nature cell biology. 2014;16:495–501. - PubMed
    1. Chang TK, Shravage BV, Hayes SD, Powers CM, Simin RT, Wade Harper J, Baehrecke EH. Uba1 functions in Atg7- and Atg3-independent autophagy. Nature cell biology. 2013;15:1067–1078. - PMC - PubMed
    1. Rusten TE, Stenmark H. How do ESCRT proteins control autophagy? Journal of cell science. 2009;122:2179–2183. - PubMed
    1. Venken KJ, Schulze KL, Haelterman NA, Pan H, He Y, Evans-Holm M, Carlson JW, Levis RW, Spradling AC, Hoskins RA, et al. MiMIC: a highly versatile transposon insertion resource for engineering Drosophila melanogaster genes. Nature methods. 2011;8:737–743. - PMC - PubMed
    1. Henne WM, Buchkovich NJ, Emr SD. The ESCRT pathway. Developmental cell. 2011;21:77–91. - PubMed

Publication types

MeSH terms