. 2018 Jan 17;97(2):434-449.e4.
doi: 10.1016/j.neuron.2017.12.022. Epub 2018 Jan 4.

Nucleus Accumbens Subnuclei Regulate Motivated Behavior via Direct Inhibition and Disinhibition of VTA Dopamine Subpopulations

Affiliations

Nucleus Accumbens Subnuclei Regulate Motivated Behavior via Direct Inhibition and Disinhibition of VTA Dopamine Subpopulations

Hongbin Yang et al. Neuron. .

Abstract

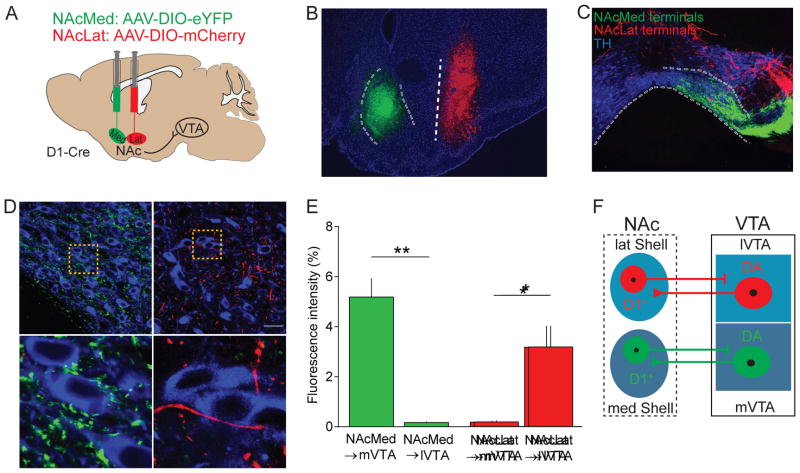
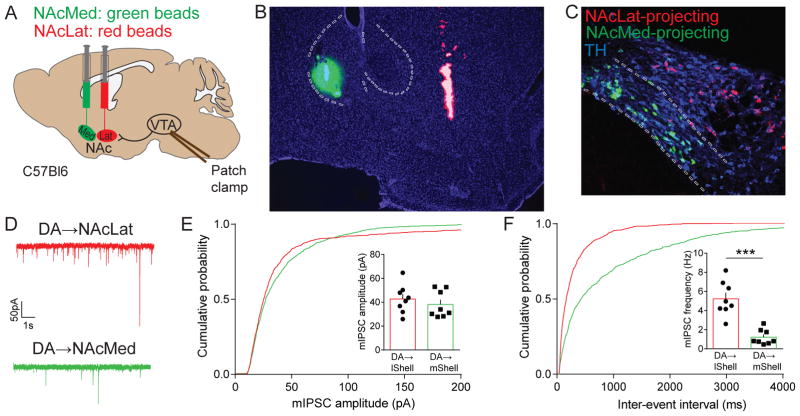
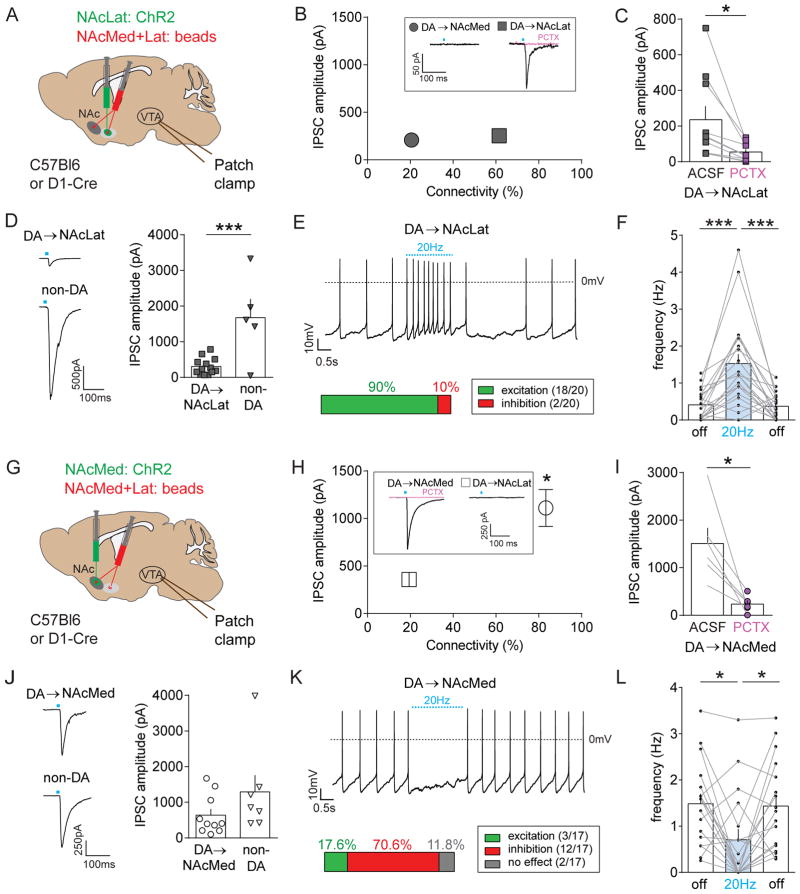
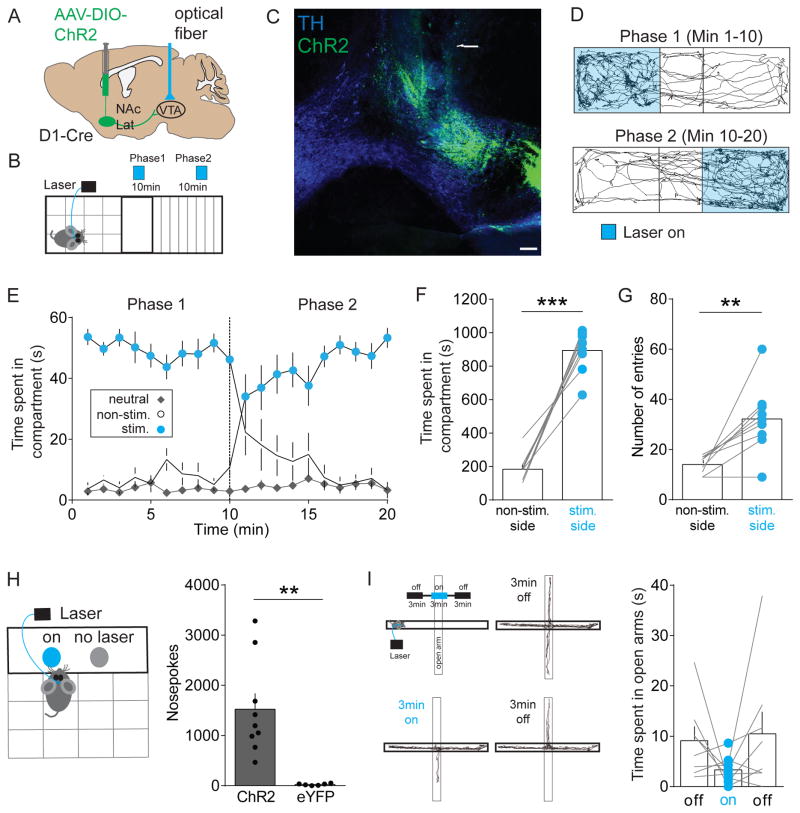
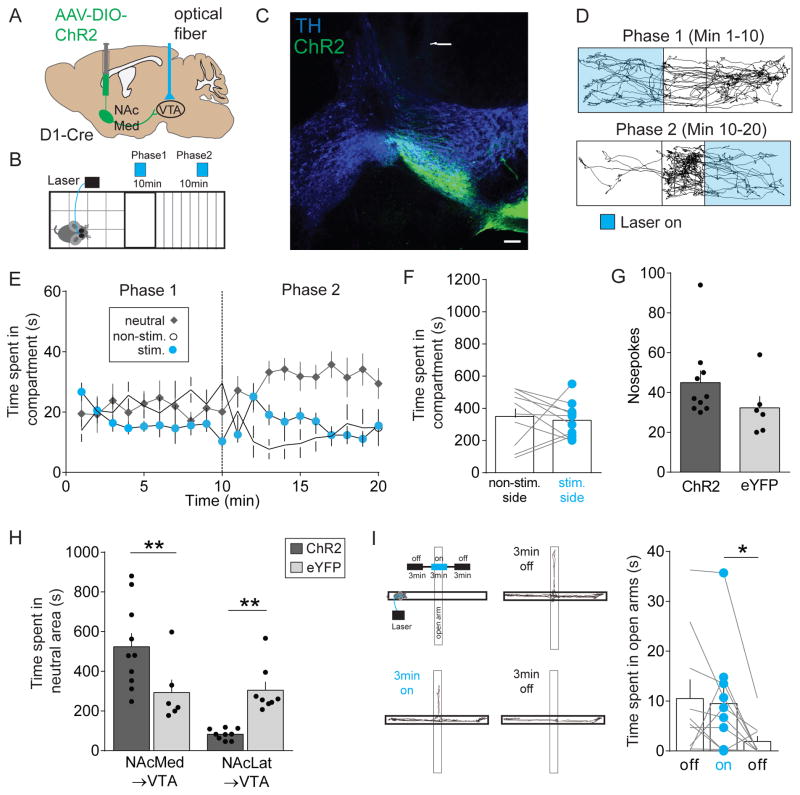
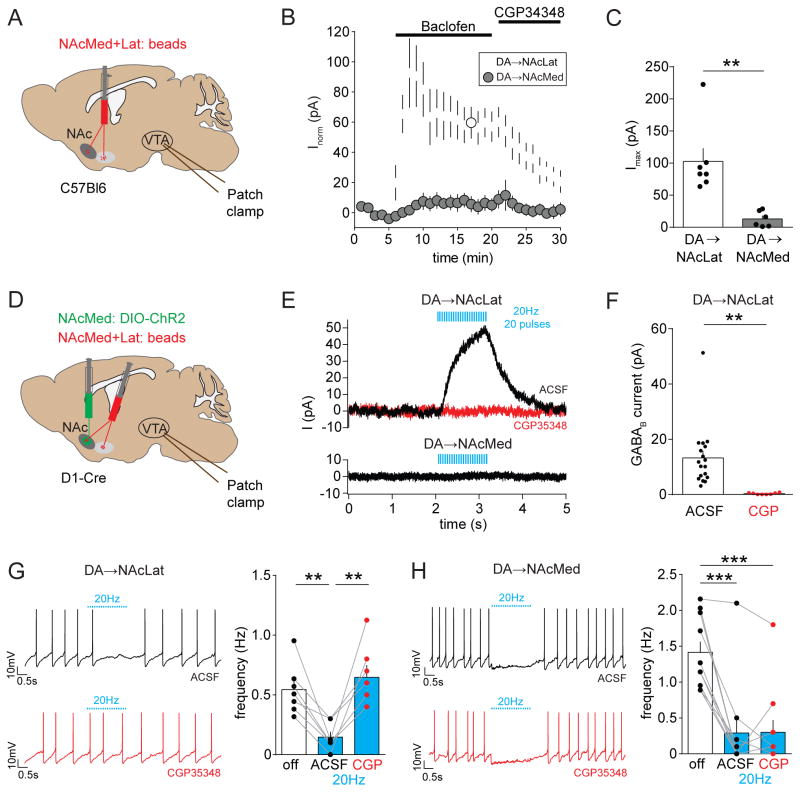
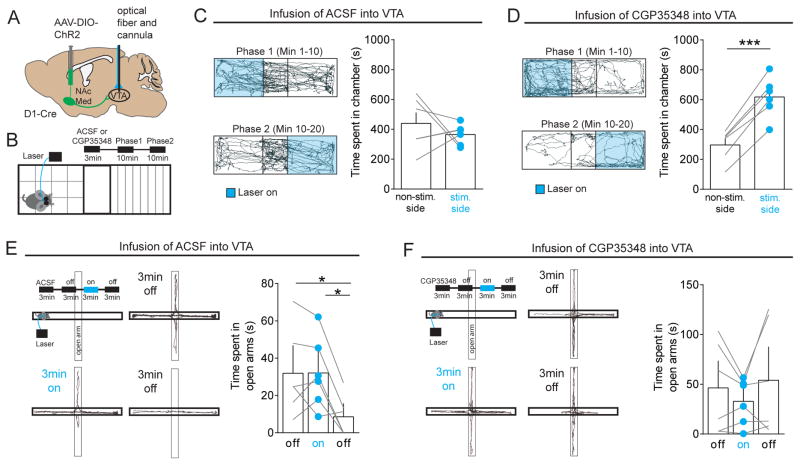
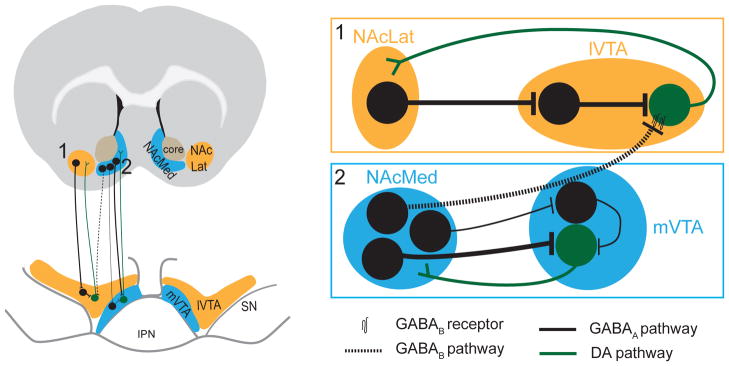
Mesolimbic dopamine (DA) neurons play a central role in motivation and reward processing. Although the activity of these mesolimbic DA neurons is controlled by afferent inputs, little is known about the circuits in which they are embedded. Using retrograde tracing, electrophysiology, optogenetics, and behavioral assays, we identify principles of afferent-specific control in the mesolimbic DA system. Neurons in the medial shell subdivision of the nucleus accumbens (NAc) exert direct inhibitory control over two separate populations of mesolimbic DA neurons by activating different GABA receptor subtypes. In contrast, NAc lateral shell neurons mainly synapse onto ventral tegmental area (VTA) GABA neurons, resulting in disinhibition of DA neurons that project back to the NAc lateral shell. Lastly, we establish a critical role for NAc subregion-specific input to the VTA underlying motivated behavior. Collectively, our results suggest a distinction in the incorporation of inhibitory inputs between different subtypes of mesolimbic DA neurons.

Keywords: GABA; dopamine; mesolimbic; motivation; nucleus accumbens; reward; ventral tegmental area.


Conflict of interest statement

DECLARATION OF INTERESTS

The authors declare no competing interests.

Figures

Figure 1
Figure 1. Anatomical characterization of NAcMed and NAcLat inputs to the VTA
(A) Schematic showing dual injection of AAVs expressing eYFP or mCherry into the NAcMed (medial shell of nucleus accumbens) and NAcLat (lateral shell of nucleus accumbens) of D1-Cre mice, respectively. (B) Fluorescence image showing eYFP expression (green, 488 nm) in the NAcMed and mCherry expression (red, 546 nm) in the NAcLat of a D1-Cre mouse. Blue staining represents DAPI (LV: lateral ventricle, aca: anterior commissure, CPu: caudate putamen, LS: lateral septum, Pir: piriform cortex; Scale bar 100 μm). (C) Confocal image of a coronal midbrain section showing TH-immunostaining (blue, 647 nm) with eYFP-expressing NAcMed terminals in the medial VTA (mVTA) and mCherry-expressing NAcLat terminals in the lateral VTA (lVTA; IPN: interpeduncular nucleus, ml: medial lemniscus, Scale bar 100 μm). (D) Confocal images showing dense clustering of eYFP-expressing NAcMed terminals in close proximity of DA neurons in the mVTA (1). mCherry-expressing NAcLat terminals are less frequently observed near DA neurons in the lVTA (2; Scale bars 50 μm). (E) Bar graphs showing differences in fluorescence intensity for NAcMed and NAcLat terminals in different VTA subregions (* p < 0.05, ** p < 0.01) (Data represent means ± SEM). (F) Schematic overview demonstrating matching projection patterns between NAc and VTA subregions.
Figure 2
Figure 2. Characterization of inhibitory synaptic transmission in distinct mesolimbic DA subpopulations
(A) Schematic showing dual injection of green and red fluorescent retrobeads into the NAcMed and NAcLat of C57Bl6 mice, respectively, and whole-cell patch clamp recordings of retrogradely labeled VTA DA neurons. (B) Fluorescence image showing representative example of injection site with green beads located in the NAcMed and red beads in the NAcLat. Blue staining represents DAPI (Scale bar 50 μm). (C) Confocal image showing TH-immunostaining (647 nm) colocalization with NAcMed-projecting cells in the mVTA (green, 488 nm) and NAcLat projecting cells (red, 546 nm) in the lVTA. ~ 90–97 % of the retrogradely labeled neurons in these regions are TH-immunopositive (i.e., DAergic; Lammel et al., 2011). Note, that NAcMed- and NAcLat-projecting VTA DA neurons represent largely independent projection systems with little collateralization (only 0.4 % of bead-labeled cells harbored both red and green beads (13 out of 3600 cells; red beads: n = 2166 cells, green beads: n = 1421 cells; n = 4 mice) (Scale bar 50 μm). (D) Example traces of miniature inhibitory postsynaptic currents (mIPSCs) from NAcLat-projecting (red) and NAcMed-projecting (green) VTA DA neurons (recorded in 1 μM TTX, 20 μM CNQX, 50 μM D-AP5). (E and F) Cumulative probability plots of the amplitudes (E) and frequencies (F) of mIPSCs recorded from NAcLat-projecting (red) and NAcMed-projecting (green) VTA DA neurons. Insets: bar graphs of the means obtained from mIPSC amplitudes (E) or frequencies (F) (*** p < 0.001) (Data represent means ± SEM).
Figure 3
Figure 3. Optogenetic stimulation of discrete NAc inputs to the VTA reveals opposing effects in different mesolimbic DA subpopulations
(A) Schematic of AAV injection into the NAcLat and red retrobead injection into the NAcLat and NAcMed of C57Bl6 (for experiments shown in panels B and C) or D1-Cre mice (for experiments shown in panels D–F). Whole-cell patch clamp recordings were performed from retrogradely labeled neurons in different VTA subregions while optogenetically stimulating NAcLat terminals in the VTA. (B) Synaptic connectivity plotted against the amplitude of light-evoked inhibitory postsynaptic currents (IPSCs; recorded in 20 μM CNQX, 50 μM D-AP5, 1 μM TTX, 1 mM 4-AP) from NAcMed- (grey circle) and NAcLat-projecting (grey square) DA neurons. Inset shows sample trace of a light-evoked IPSC from a NAcLat-projecting DA neuron (black trace), which are blocked by bath application of 50 μM picrotoxin (red trace). Note that relatively few (~20%) of NAcMed-projecting DA neurons responded to NAcLat terminal stimulation. Error bars are too small to resolve. (Data represent means ± SEM). (C) Bar graph showing mean IPSC amplitudes before (ACSF) and after bath-application of 50 μM picrotoxin (PCTX) in NAcLat-projecting DA neurons (* p < 0.05) (Data represent means ± SEM). (D) Sample traces showing light-evoked IPSCs recorded in NAcLat-projecting DA neurons and non-DA VTA neurons when stimulating NAcLat terminals in the VTA (left). Bar graph showing significantly larger IPSC amplitudes in non-DA neurons compared to NAcLat-projecting DA neurons (right) (*** p < 0.001) (Data represent means ± SEM). (E) Sample whole-cell patch clamp recording of spontaneous firing in NAcLat-projecting DA neuron and 20 Hz stimulation of NAcLat terminals. Bar chart indicates the percentage of cells that were excited (i.e., increased firing frequency) or inhibited (i.e., decreased firing frequency) in response to NAcLat stimulation. (F) Bar graph showing the mean firing frequency of NAcLat-projecting DA neurons before (light off), during (light on, 20 Hz) and after (light off) stimulation of NAcLat terminals in the VTA (*** p < 0.001) (Data represent means ± SEM). (G–L) Same experimental approach as in (A–F), but for analyzing NAcMed inputs to NAcLat- and NAcMed-projecting DA neurons. Note the strong synaptic connectivity between the NAcMed and NAcMed-projecting DA neurons (H), the inhibition of light-evoked IPSCs by PCTX (I) and inhibition of spontaneous firing in the majority of NAcMed-projecting DA neurons in response to NAcMed terminal stimulation (K, L) (* p < 0.05) (Data represent means ± SEM).
Figure 4
Figure 4. In vivo optogenetic stimulation of NAcLat terminals in the VTA promotes reward-related behaviors
(A) Schematic of AAV injection into the NAcLat of D1-Cre mice and light activation of NAcLat terminals in the VTA. (B) Schematic of real-time place preference assay, which involves switching of light stimulated compartments after 10 min. (C) Confocal image showing TH-immunostaining (blue, 647 nm), ChR2-eYFP expression in the lVTA (green, 488 nm) and the optical fiber track. Note, that ChR2-eYFP expression is predominantly located in the lVTA (RLi: rostral linear nucleus) (Scale bar 100 μm). (D) Trajectory of a typical D1-Cre animal that received stimulation in one compartment (Phase 1, blue, top panel) for the initial 10 min period and then received stimulation in the other compartment (Phase 2, blue, lower panel) for an additional 10 min. (E) Graph showing time spent in individual compartments (neutral: grey; non-stimulated side: white; stimulated side: blue) plotted as a function of time over the course of the experiment (1 min intervals). Dashed line indicates switching of compartment stimulation after 10 min (Data represent means ± SEM). (F) Mice spend significantly more time on the side of the chamber paired with optical stimulation of NAcLat terminals (*** p < 0.001) (Data represent means ± SEM). (G) Mice enter the side of the chamber paired with optical stimulation of NAcLat terminals more frequently compared to the non-stimulated side (** p < 0.01) (Data represent means ± SEM). (H) Schematic showing behavioral assay in which mice receive optogenetic self-stimulation of NAcLat terminals in the VTA in response to nose-poke behavior (left). Bar graph showing significantly higher nose-poke behavior in mice expressing ChR2 in NAcLat terminals compared to eYFP-expressing animals (right) (** p < 0.01) (Data represent means ± SEM). (I) Schematic of elevated plus maze (EPM) assay, which involves 20 Hz light stimulation of NAcLat terminals in the VTA during a 3-min light-on epoch (upper left panel). Representative trajectory of an animal during the initial 3-min light-off epoch (upper right panel), during the 3-min light-on epoch (lower left panel) and final 3-min light-off epoch (lower right panel). Bar graph showing that light stimulation of NAcLat terminals in the VTA did not significantly alter open arm time compared to light-off epochs (Data represent means ± SEM).
Figure 5
Figure 5. In vivo optogenetic stimulation of NAcMed terminals in the VTA induces a general state of behavioral suppression that is not specific to reward or aversion
(A) Schematic of AAV injection into the NAcMed of D1-Cre mice and light activation of NAcMed terminals in the VTA. (B) Schematic of real-time place preference assay, which involves switching of light stimulated compartments after 10 min. (C) Confocal image showing TH-immunostaining (blue, 647 nm), ChR2-eYFP expression in the mVTA (green, 488 nm) and the optical fiber track. Note, that ChR2-eYFP expression is predominantly located in the mVTA (Scale bar 100 μm). (D) Trajectory of a typical D1-Cre animal that received 20 Hz light stimulation in one compartment (Phase 1, blue, top panel) for the initial 10 min period and then received stimulation in the other compartment (Phase 2, blue, lower panel) for an additional 10 min. (E) Graph showing time spent in individual compartments (neutral: grey; non-stimulated side: white; stimulated side: blue) plotted as a function of time over the course of the experiment (1 min intervals). Dashed line indicates switching of compartment stimulation after 10 min (Data represent means ± SEM). (F) Optogenetic stimulation of NAcMed terminals in the VTA did not significantly alter the time spent in the stimulated compartment compared to the non-stimulated side (Data represent means ± SEM). (G) Bar graph showing that optogenetic stimulation of NAcMed terminals in the VTA did not significantly change nose-poke behavior in mice ChR2- compared to eYFP-expressing animals (Data represent means ± SEM). (H) Bar graph showing that mice receiving optogenetic stimulation of NAcMed terminals in the VTA spent significantly more time in the neutral compartment compared to eYFP-expressing animals or mice that express ChR2 or eYFP in NAcLat terminals (* < 0.05, *** p < 0.001) (Data represent means ± SEM). (I) Schematic of elevated plus maze (EPM) assay, which involves 20 Hz light stimulation of NAcMed terminals in the VTA during a 3-min light-on epoch (upper left panel). Representative path of an animal during the initial 3-min light-off epoch (upper right panel), during the 3-min light-on epoch (lower left panel) and final 3-min light-off epoch (lower right panel). Bar graph showing that light stimulation of NAcMed terminals in the VTA significantly reduced open arm time during the final 3-min light-off epochs (* p < 0.05) (Data represent means ± SEM).
Figure 6
Figure 6. Optogenetic stimulation of NAcMed terminals in the VTA elicits GABAB receptor activation selectively in NAcLat-projecting VTA DA neurons
(A) Experimental approach showing dual injection of red fluorescent beads into the NAcMed and NAcLat of the same C57Bl6 mouse and ex-vivo whole-cell recordings of retrogradely labeled VTA neurons. (B) Outward currents (recorded at −55 mV, in 50 μM picrotoxin, 20 μM CNQX, 50 μM D-AP5) are plotted as a function of time for NAcLat-projecting DA neurons (white circles) and NAcMed-projecting DA neurons (grey circles). Bath application of 100 μM baclofen (GABABR agonist) induces a striking increase in outward current in NAcLat-projecting but not NAcMed-projecting DA neurons. Note that the baclofen-induced current is blocked by bath application of the GABABR antagonist CGP35348 (100 μM) (Data represent means ± SEM). (C) Bar graph showing significantly reduced peak outward currents evoked by baclofen in NAcMed-projecting DA neurons compared to NAcLat-projecting DA neurons (** p < 0.01) (Data represent means ± SEM). (D) Schematic of AAV injection into NAcMed and red retrobead injection into NAcMed and NAcLat of D1-Cre mice. Whole-cell patch clamp recordings were performed from retrogradely labeled neurons in different VTA subregions while stimulating NAcMed terminals in the VTA. (E) Representative voltage-clamp recording of a NAcLat-projecting DA neuron (upper panel) and NAcMed-projecting DA neuron (lower panel) held at −55 mV (recorded in 50 μM picrotoxin, 20 μM CNQX, 50 μM D-AP5) showing outward current produced by 20 Hz light stimulation of NAcMed terminals. Red trace indicates outward current after application of 100 μM CGP35348. (F) Bar graph showing mean GABABR-mediated current amplitudes before (ACSF) and after bath-application of CGP35348 (CGP) in NAcLat-projecting DA neurons (** p < 0.01) (Data represent means ± SEM). (G) Left: Sample whole-cell patch clamp recordings of spontaneous firing from a NAcLat-projecting DA neuron and 20 Hz light stimulation of NAcMed terminals before (black trace) and after (red trace) bath application of 100 μM CGP35348. Right: Bar graph showing the mean firing frequency of NAcLat-projecting DA neurons before (off, white bar) and during 20 Hz light stimulation (blue bars) of NAcMed terminals in the VTA (** p < 0.01) (Data represent means ± SEM). (H) Same as in (G), but recordings were performed from NAcMed-projecting DA neurons (*** p < 0.001) (Data represent means ± SEM).
Figure 7
Figure 7. In vivo opto-pharmacological dissection of NAcMed projections to the VTA
(A) Schematic of AAV injection into the NAcMed of D1-Cre mice and implantation of an optofluidic system in the VTA. (B) Schematic showing experimental approach, which involves infusion of 1μL ACSF or a GABABR antagonist (15 nM/1 μL CGP35348) 3 min before the behavioral assay and two 10 min real-time place preference sessions (light stimulated compartments were switched after 10 min) stimulating NAcMed terminals in the VTA. (C) Trajectory of a typical D1-Cre animal that received ACSF infusion into the VTA and 20 Hz light stimulation in one compartment (Phase 1, blue, top panel) for the initial 10 min period followed by stimulation in the other compartment (Phase 2, blue, lower panel) for an additional 10 min. Bar graph (right panel) shows that optogenetic stimulation of NAcMed terminals in the VTA did not significantly alter the time spent in the stimulated compartment compared to the non-stimulated side (Data represent means ± SEM). (D) Same as in (C) but animals received infusion of CGP35348 into the VTA. Note that mice spent significantly more time on the side of the chamber paired with optical stimulation of NAcMed terminals (** p < 0.01) (Data represent means ± SEM). (E) Schematic showing infusion of ACSF into the VTA and elevated plus maze (EPM) assay in which mice received 20 Hz light stimulation of NAcMed terminals during a 3-min light-on epoch (upper left panel). Representative trajectory of an animal during the initial 3-min light-off epoch (upper right panel), during the 3-min light-on epoch (lower left panel) and during the final 3-min light-off epoch (lower right panel). The bar graph shows that light stimulation of NAcMed terminals in the VTA significantly reduced open arm time during the final 3-min light-off epochs (* p < 0.05) (Data represent means ± SEM). (F) Same as in (E) but animals received infusion of CGP35348 into the VTA. Note that mice spent a similar amount of time in the open arms in the two 3-min light-off epochs (Data represent means ± SEM).
Figure 8
Figure 8. Wiring diagram illustrating direct and indirect feedback loops in the mesolimbic DA system
Our data suggest that the mesolimbic DA system contains both indirect (1) and direct (2) feedback loops. Indirect: D1-expressing medium spiny neurons (MSNs) in the NAcLat predominantly target VTA GABA neurons, which exert inhibitory influence over NAcLat-projecting DA neurons. Thus, activation of the NAcLat pathway increases firing of NAcLat-projecting DA neurons through a net disinhibition. There also appears to be an indirect pathway from D1-expressing MSNs in the NAcMed to mVTA GABA neurons, which inhibit NAcMed-projecting DA neurons. However, NAcMed terminal stimulation in the VTA resulted in a net inhibition in most NAcMed-projecting DA neurons suggesting that the direct pathway from D1-expressing MSN in NAcMed to NAcMed-projecting DA neurons is stronger compared to the indirect pathway. Direct: D1-expressing MSNs in the NAcMed directly inhibit NAcMed-projecting DA neurons via GABAARs and NAcLat-projecting DA neurons via GABABRs. Thus, activation of the NAcMed pathway results in inhibition of both NAcMed- and NAcLat-projecting DA neurons.

Comment in

References

    1. Aragona BJ, Cleaveland NA, Stuber GD, Day JJ, Carelli RM, Wightman RM. Preferential enhancement of dopamine transmission within the nucleus accumbens shell by cocaine is attributable to a direct increase in phasic dopamine release events. J Neurosci. 2008;28:8821–8831. - PMC - PubMed
    1. Bassareo V, De Luca MA, Di Chiara G. Differential expression of motivational stimulus properties by dopamine in nucleus accumbens shell versus core and prefrontal cortex. J Neurosci. 2002;22:4709–4719. - PMC - PubMed
    1. Beier KT, Steinberg EE, DeLoach KE, Xie S, Miyamichi K, Schwarz L, Gao XJ, Kremer EJ, Malenka RC, Luo L. Circuit Architecture of VTA Dopamine Neurons Revealed by Systematic Input-Output Mapping. Cell. 2015;162:622–634. - PMC - PubMed
    1. Berridge KC, Kringelbach ML. Pleasure Systems in the Brain. Neuron. 2015;86:646–664. - PMC - PubMed
    1. Bjorklund A, Dunnett SB. Dopamine neuron systems in the brain: an update. Trends Neurosci. 2007;30:194–202. - PubMed

Publication types

MeSH terms