

doi: 10.1021/jp9121497.
Epub 2010 Apr 2.
Single-Walled Carbon Nanotubes Probing the Denaturation of Lysozyme
Affiliations
- PMID: 29308103
- PMCID: PMC5751950
- DOI: 10.1021/jp9121497
Item in Clipboard
Single-Walled Carbon Nanotubes Probing the Denaturation of Lysozyme
J Phys Chem C Nanomater Interfaces.
.
Abstract
Resonance Raman spectroscopy measurements of lysozyme-bound single-walled carbon nanotubes have been made during different stages of the chemically and thermally induced misfolding and of the denaturation process of nanotube-bound lysozymes. Changes to the Raman intensity of single-walled carbon nanotubes (SWNTs) have been observed during the denaturation of lysozyme. The Raman intensity changes are attributed to excitonic transition energy (Eii ) shifts of the SWNTs during the denaturation of lysozyme. The Eii shift of SWNTs was confirmed by photoluminescence measurements.
Figures

Schematic illustration of structures of a lysozyme-wrapped SWNT and a denatured lysozyme-wrapped SWNT.

(a) Circular dichroism spectra of lysozyme at different GndHCl concentrations. Here, ΘMRW denotes the ellipticity in the mean residue weight. (b) A denaturation plot shown for LYZ-SWNT. The percent denatured lysozyme is calculated from the ellipticity at 222 nm shown in (a).

Raman spectra of the lysozyme–SWNT dispersion with different GndHCl concentrations: (a) at 532 nm excitation for (9,3) SWNTs and (b) at 647 nm excitation for (7,5) and (8,3) SWNTs. (c) Lorentzian fits of RBM bands of (7,5) and (8,3) nanotubes at different GndHCl concentrations. (d) Plot of the RBM integrated intensity ratio (I(7,5)/I(8,3)) for the (7,5) to (8,3) nanotubes vs the GndHCl concentration. (e) PL of the LYZ-SWNT dispersion without any GndHCl (blue line) and with 4 M GndHCl (red line). The excitation wavelength is 658 nm. Emission intensity is normalized at the emission peaks occurring around 1150 nm. (f) Calculated normalized intensity of the Stokes RBM bands for (7,5) (red line) and (8,3) (blue line) at 647 nm (1.916 eV) laser excitation as a function of E22, and the fwhm resonance window width of 65 meV is indicated.
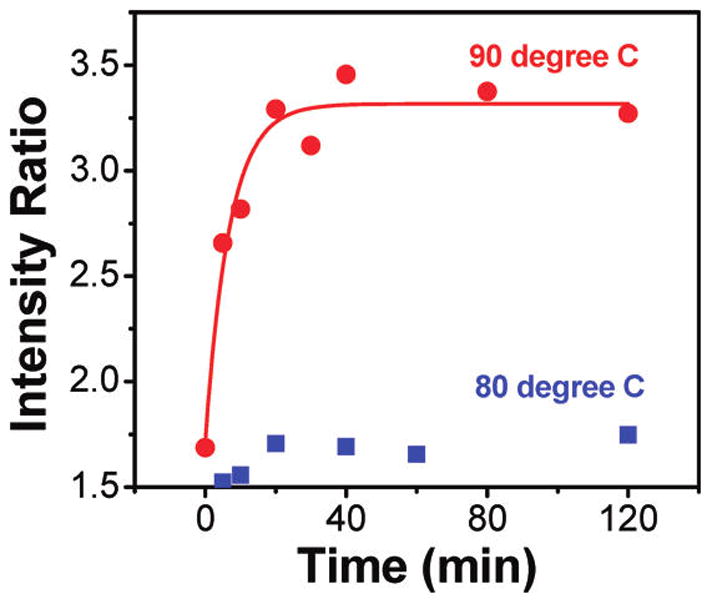
Plot of the RBM intensity ratio I(7,5)/I(8,3) of (7,5) to (8,3) nanotubes as a function of heating time at 80 °C (blue solid squares) and 90 °C (red solid circles). The red line is an exponential-decay fit (y = A*exp(−kx) + B) for data taken at 90 °C, and the rate constant k = 0.15 min−1 is obtained for data at 90 °C.
Similar articles
-
Photophysics of individual single-walled carbon nanotubes.Acc Chem Res. 2008 Feb;41(2):235-43. doi: 10.1021/ar700136v. Acc Chem Res. 2008. PMID: 18281946
-
Excited excitonic states in single-walled carbon nanotubes.Nano Lett. 2008 Jul;8(7):1890-5. doi: 10.1021/nl080518h. Epub 2008 May 28. Nano Lett. 2008. PMID: 18505302
-
Direct observation of deep excitonic states in the photoluminescence spectra of single-walled carbon nanotubes.Phys Rev Lett. 2007 Dec 7;99(23):237402. doi: 10.1103/PhysRevLett.99.237402. Epub 2007 Dec 6. Phys Rev Lett. 2007. PMID: 18233410
-
Employing Raman spectroscopy to qualitatively evaluate the purity of carbon single-wall nanotube materials.J Nanosci Nanotechnol. 2004 Sep;4(7):691-703. doi: 10.1166/jnn.2004.116. J Nanosci Nanotechnol. 2004. PMID: 15570946 Review.
-
Science and applications of single-nanotube Raman spectroscopy.J Nanosci Nanotechnol. 2003 Feb-Apr;3(1-2):19-37. doi: 10.1166/jnn.2003.189. J Nanosci Nanotechnol. 2003. PMID: 12908228 Review.
References
-
- Schellekens H. Nat Rev Drug Discovery. 2002;1:457. - PubMed
-
- Tessier PM, Jinkoji J, Cheng YC, Prentice JL, Lenhoff AM. J Am Chem Soc. 2008;130:3106. - PubMed
-
- Saito R, Dresselhaus G, Dresselhaus MS. Physical Properties of Carbon Nanotubes. Imperial College Press; London, U.K: 1998.
-
- Jorio A, Dresselhaus G, Dresselhaus MS, editors. Topics in Applied Physics. Vol. 111 Springer-Verlag; Berlin: 2008. Carbon Nanotubes.
-
- Mintmire JW, White CT. Phys Rev Lett. 1998;81:2506.
Grants and funding
LinkOut - more resources
Full Text Sources