

Tandem trimer pyrrole-imidazole polyamide probes targeting 18 base pairs in human telomere sequences
- PMID: 29308145
- PMCID: PMC5645774
- DOI: 10.1039/c4sc03755c
Tandem trimer pyrrole-imidazole polyamide probes targeting 18 base pairs in human telomere sequences
Abstract
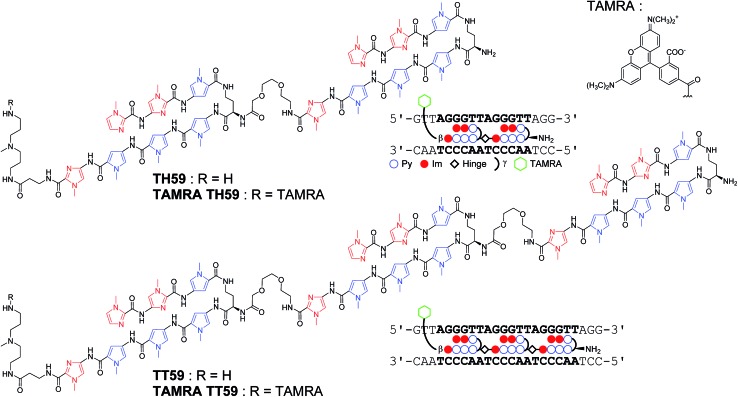
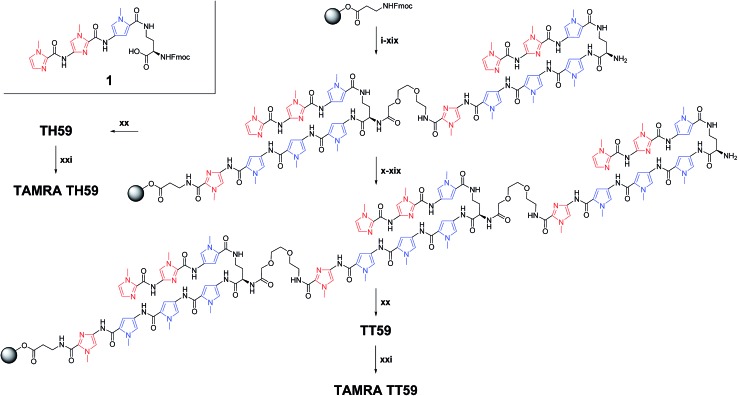
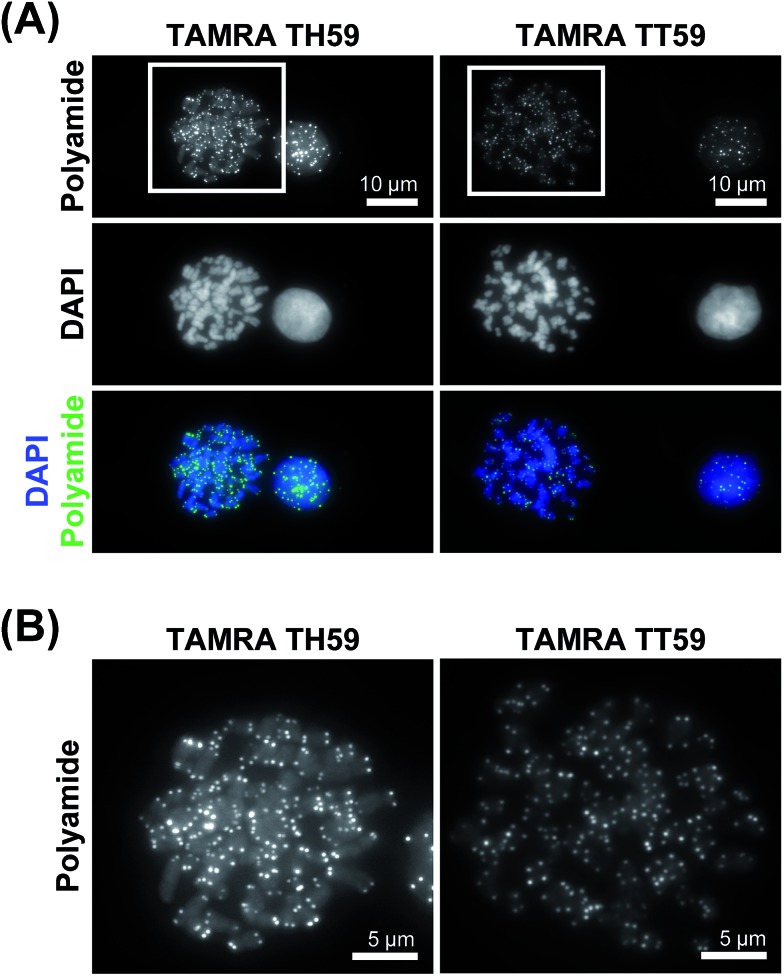
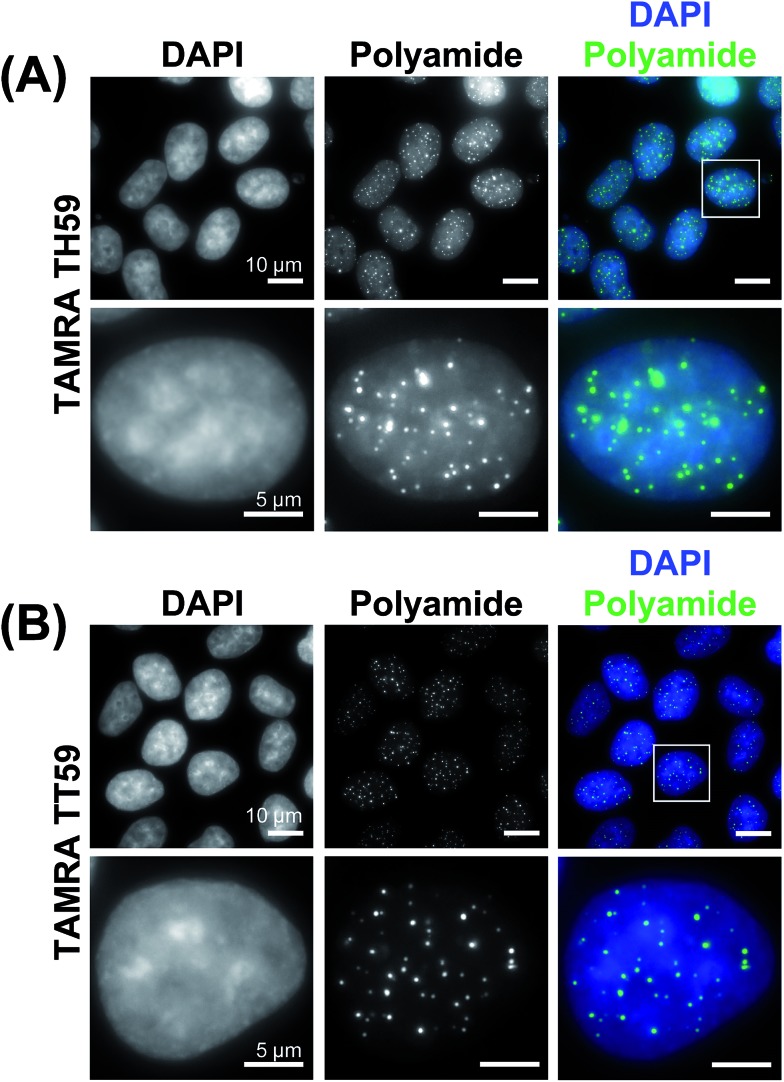
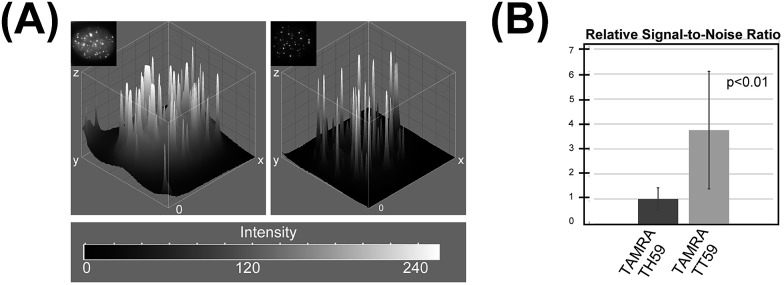
The binding of molecules to specific DNA sequences is important for imaging genome DNA and for studying gene expression. Increasing the number of base pairs targeted by these molecules would provide greater specificity. N-Methylpyrrole-N-methylimidazole (Py-Im) polyamides are one type of such molecules and can bind to the minor groove of DNA in a sequence-specific manner without causing denaturation of DNA. Our recent work has demonstrated that tandem hairpin Py-Im polyamides conjugated with a fluorescent dye can be synthesized easily and can serve as new probes for studying human telomeres under mild conditions. Herein, to improve their selectivities to telomeres by targeting longer sequences, we designed and synthesized a fluorescent tandem trimer Py-Im polyamide probe, comprising three hairpins and two connecting regions (hinges). The new motif bound to 18 bp dsDNA in human telomeric repeats (TTAGGG) n , the longest sequence for specific binding reported for Py-Im polyamides. We compared the binding affinities and the abilities to discriminate mismatch, the UV-visible absorption and fluorescence spectra, and telomere staining in human cells between the tandem trimer and a previously developed tandem hairpin. We found that the tandem trimer Py-Im polyamide probe has higher ability to recognize telomeric repeats and stains telomeres in chemically fixed cells with lower background signal.
Figures
Similar articles
-
Targeting 24 bp within Telomere Repeat Sequences with Tandem Tetramer Pyrrole-Imidazole Polyamide Probes.J Am Chem Soc. 2016 Oct 26;138(42):14100-14107. doi: 10.1021/jacs.6b09023. Epub 2016 Oct 13. J Am Chem Soc. 2016. PMID: 27690451
-
Rational design of specific binding hairpin Py-Im polyamides targeting human telomere sequences.Bioorg Med Chem. 2015 Feb 15;23(4):855-60. doi: 10.1016/j.bmc.2014.12.025. Epub 2014 Dec 30. Bioorg Med Chem. 2015. PMID: 25614111
-
Development of a new method for synthesis of tandem hairpin pyrrole-imidazole polyamide probes targeting human telomeres.J Am Chem Soc. 2013 Nov 6;135(44):16468-77. doi: 10.1021/ja406737n. J Am Chem Soc. 2013. PMID: 24083880
-
Progress and prospects of pyrrole-imidazole polyamide-fluorophore conjugates as sequence-selective DNA probes.Chembiochem. 2012 Oct 15;13(15):2170-85. doi: 10.1002/cbic.201200451. Epub 2012 Sep 28. Chembiochem. 2012. PMID: 23023993 Review.
-
Synthesis and biological properties of sequence-specific DNA-alkylating pyrrole-imidazole polyamides.Acc Chem Res. 2006 Dec;39(12):935-44. doi: 10.1021/ar030287f. Acc Chem Res. 2006. PMID: 17176032 Review.
Cited by
-
Application of Cu(I)-catalyzed azide-alkyne cycloaddition for the design and synthesis of sequence specific probes targeting double-stranded DNA.Beilstein J Org Chem. 2016 Jun 30;12:1348-60. doi: 10.3762/bjoc.12.128. eCollection 2016. Beilstein J Org Chem. 2016. PMID: 27559384 Free PMC article.
-
Submolecular dissection reveals strong and specific binding of polyamide-pyridostatin conjugates to human telomere interface.Nucleic Acids Res. 2019 Apr 23;47(7):3295-3305. doi: 10.1093/nar/gkz135. Nucleic Acids Res. 2019. PMID: 30820532 Free PMC article.
-
Telomere-specific chromatin capture using a pyrrole-imidazole polyamide probe for the identification of proteins and non-coding RNAs.Epigenetics Chromatin. 2021 Oct 9;14(1):46. doi: 10.1186/s13072-021-00421-8. Epigenetics Chromatin. 2021. PMID: 34627342 Free PMC article.
-
The Road Not Taken with Pyrrole-Imidazole Polyamides: Off-Target Effects and Genomic Binding.Biomolecules. 2020 Apr 3;10(4):544. doi: 10.3390/biom10040544. Biomolecules. 2020. PMID: 32260120 Free PMC article. Review.
-
A Near-Infrared Fluorogenic Pyrrole-Imidazole Polyamide Probe for Live-Cell Imaging of Telomeres.J Am Chem Soc. 2020 Oct 14;142(41):17356-17363. doi: 10.1021/jacs.0c04955. Epub 2020 Oct 6. J Am Chem Soc. 2020. PMID: 32955878 Free PMC article.
References
LinkOut - more resources
Full Text Sources
Other Literature Sources