. 2015 May 1;6(5):2660-2686.
doi: 10.1039/c4sc03759f. Epub 2015 Jan 13.

Combination of Ru(ii) complexes and light: new frontiers in cancer therapy

Affiliations

Combination of Ru(ii) complexes and light: new frontiers in cancer therapy

Cristina Mari et al. Chem Sci. .

Abstract

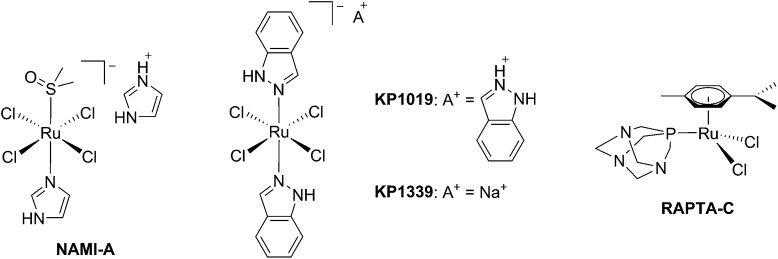
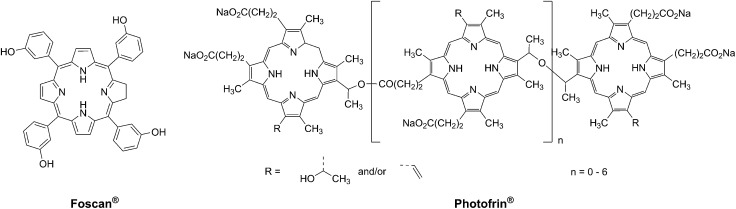
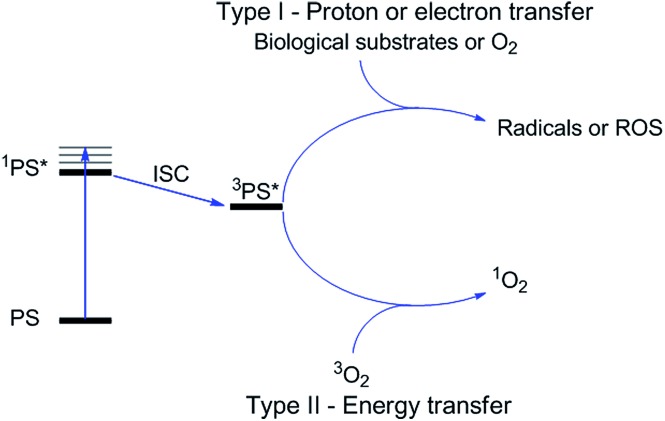
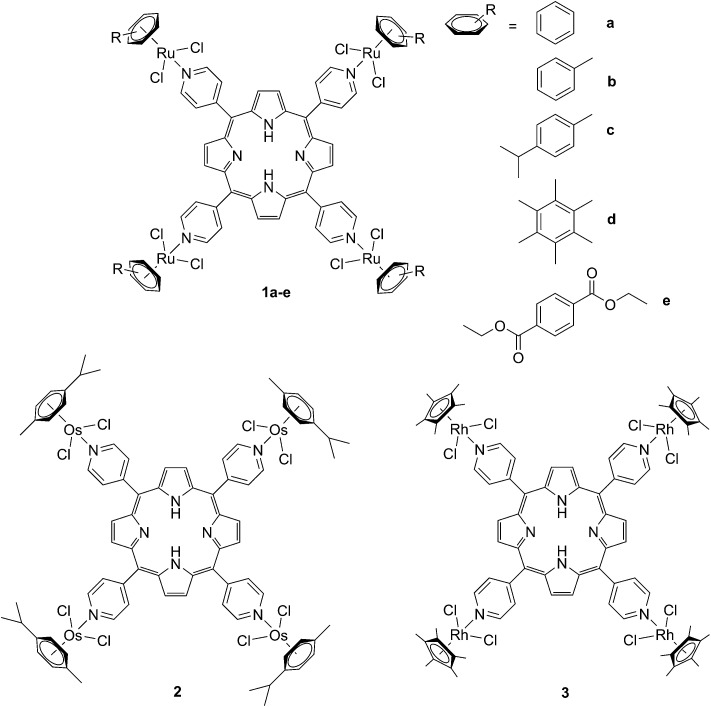
The synergistic action of light, oxygen and a photosensitizer (PS) has found applications for decades in medicine under the name of photodynamic therapy (PDT) for the treatment of skin diseases and, more recently, for the treatment of cancer. However, of the thirteen PSs currently approved for the treatment of cancer over more than 10 countries, only two contain a metal ion. This fact is rather surprising considering that nowadays around 50% of conventional chemotherapies involve the use of cisplatin and other platinum-containing drugs. In this perspective article, we review the opportunities brought by the use of Ru(ii) complexes as PSs in PDT. In addition, we also present the recent achievements in the application of Ru(ii) complexes in photoactivated chemotherapy (PACT). In this strategy, the presence of oxygen is not required to achieve cell toxicity. This is of significance since tumors are generally hypoxic. Importantly, this perspective article focuses particularly on the Ru(ii) complexes for which an in vitro biological evaluation has been performed and the mechanism of action (partially) unveiled.


Figures

Fig. 1
Fig. 1. Structures of NAMI-A, KP1339, KP1019 and RAPTA-C.
Fig. 2
Fig. 2. Structures of porphyrin-based approved PDT agents.
Fig. 3
Fig. 3. Mechanisms of action of PDT.
Fig. 4
Fig. 4. Structures of Ru–porphyrin conjugates (top, 1a–e), and Os and Rh analogs (bottom, 2 and 3).
Fig. 5
Fig. 5. Phototoxicity evaluation of compounds 1a–e, 2 and 3 on Me300 melanoma cells. Cells were incubated with 10 μM of the compounds, incubated for 24 h, then irradiated at 652 nm with 0 J cm–2 (white bar), 5 J cm–2 (light grey bar), 15 J cm–2 (dark grey bar) or 30 J cm–2 (black bar) light doses. Adapted with permission from ref. 34. Copyright 2008 American Chemical Society.
Fig. 6
Fig. 6. Structures of the Ru–porphyrin conjugates evaluated in the SAR study by Schmitt et al.
Fig. 7
Fig. 7. Fluorescence microscopy images of human Me300 melanoma cells incubated for 24 h with 5 μM of 4a (A) and 6a (B), displaying red luminescence. The blue luminescence in the nuclei derives from DAPI co-staining. With kind permission from Springer Science and Business Media.
Fig. 8
Fig. 8. Polynuclear metalla-cubes 8 and 9 synthesized by Therrien to increase phototoxicity.
Fig. 9
Fig. 9. Ruthenium cages 10 and 11 applied as carriers of a porphyrin PS inside cancer cells.
Fig. 10
Fig. 10. Fluorescence microscopy of HeLa cells incubated with 11 (2 μM, 2 h): (A) white light and (B) fluorescence. Reprinted with permission from ref. 38. Copyright 2012 American Chemical Society.
Fig. 11
Fig. 11. Structures of Ru([9]aneS3)(en)Cl]+ (top, left) and of the ruthenium-derivatized porphyrin systems 13 and 14.
Fig. 12
Fig. 12. Porphyrin with pentafluoroaryl and Ru(bipy)2Cl fragments to give 15 (left) and Ru–porphyrin conjugates containing different metals in the ring (16a–d, right).,
Fig. 13
Fig. 13. Phase contrast microscopy images of cells irradiated with a 60 W tungsten lamp for 30 min. Normal fibroblast cells (top) and melanoma cells (bottom) without 16d (control) and in the presence of 5 and 10 μM concentrations of 16d. Reproduced from ref. 44 with permission from The Royal Society of Chemistry.
Fig. 14
Fig. 14. Structures of Ru–porphyrin conjugates 17a–c, with three different bridging linkers.
Fig. 15
Fig. 15. Structures of the six different DNA intercalating Ru complexes 18a–f.
Fig. 16
Fig. 16. Left: Confocal microscopy images of HeLa cells treated for 2 h with 100 μM of complex 18b (excitation at 488 nm, emission above 600 nm, bottom left) and stained with DAPI (nuclear staining, top left) and with Mitotracker green (mitochondrial staining, middle left); in the yellow circle a representative example of the different localization of 18b and Mitotracker green is found (picture on the right). Right: Cellular uptake into HeLa cells treated for 4 h with 20 μM solutions of the complexes 18a–f. Results are expressed as the mean ± error of independent experiments. In the inset: nuclear uptake for complexes 18a and 18b. Reproduced with permission from ref. 53. © 2014 Wiley-VCH Verlag GmbH & Co. KGaA, Weinheim.
Fig. 17
Fig. 17. Structures of the Ru complexes 19 and 20 bearing the tridentate pydppn ligand, which confers very long excited state lifetimes.
Fig. 18
Fig. 18. Structures of the ruthenium complexes 21 and 22 which have PDT and aPDT activity.
Fig. 19
Fig. 19. Fluorescence confocal microscopy images of HeLa cells incubated with 40 μM of 21 for 4 h: (a) DAPI staining, (b) Mitotracker green FM staining, (c) visualization of 21 by excitation at 405 nm, (d) overlay of a–c. Reprinted with permission from ref. 60. Copyright 2014 American Chemical Society.
Fig. 20
Fig. 20. Structures of the Ph2phen complexes 23 and 24 with different charges investigated by Glazer and co-workers.
Fig. 21
Fig. 21. ApoTome microscopy showing subcellular localization of 23 and 24 at 8 h. Co-localization of 23 and 24 in mitochondria or lysosomes is indicated by the apparent yellow emission. (A) Mitotracker green FM was used to image mitochondria. (B) Lysotracker green DND-26 was used to image lysosomes. Red color denotes intrinsic emission of 23 and 24, whereas blue color denotes Hoechst staining of the nucleus. The yellow color results from overlap of the red emission from the ruthenium complexes and green emission of the organelle-specific dyes, indicating co-localization. Compound 23 localizes in both the mitochondria and the lysosomes, while 24 was not predominantly found in either organelle. Reprinted with permission from ref. 61. Copyright 2014 American Chemical Society.
Fig. 22
Fig. 22. Structures of ruthenium complexes 25 and 26 studied by McFarland, characterized by 3IL excited states.,
Fig. 23
Fig. 23. Structures of Ru polypyridyl complexes conjugated with different polythiophene moieties to achieve dual Type I/II photosensitization.
Fig. 24
Fig. 24. Mechanism of the CALI strategy to inhibit enzymes, applied by the Kodadek group.
Fig. 25
Fig. 25. Structures of the strained Ru complexes 30 and 31 that undergo ligand photoejection and the inert control 29.
Fig. 26
Fig. 26. Structures of the photostable control compound 32 and the strained 33 and 34 that undergo ligand photoejection.
Fig. 27
Fig. 27. Structures of the two Ru(ii) complexes 35 and 36 with the biq ligands that are exchanged upon irradiation.
Fig. 28
Fig. 28. Structure of the Ru(ii) complex 37 with labile CH3CN ligand.
Fig. 29
Fig. 29. Schematic representation of the photo-dissociation process. Left branch: pre-irradiated Ru–peptide conjugates followed by addition of the oligonucleotide. Right branch: irradiation of a mixture of peptide-conjugated Ru(ii) complex and the oligonucleotide.
Fig. 30
Fig. 30. Structures of [Ru(TAP)2PHEHAT]2+ 42 studied for DNA intercalation and nicking by de Feyter and [Ru(η6-p-cymene)(dpb)(py)]2+ 43 synthesized by Wang, characterized by high wavelength absorption and ligand release.,
Fig. 31
Fig. 31. Structures of the mixed-metal supramolecular complexes; (44) [{(bipy)2Ru(dpp)}2RhCl2]5+, (45) [{(bipy)2Ru(bpm)}2RhCl2]5+, (46) [{(bipy)2Ru(dpp)}2IrCl2]5+, and (47) [{(bipy)2Ru(dpp)}2OsCl2]5+.,
Fig. 32
Fig. 32. (a) Schematic representation of the Ru–ODN strategy, (b) explanation of the adduct formation. Adapted from ref. 102.
Fig. 33
Fig. 33. Structure of the [Ru(TAP)2dip]2+ conjugated to the ODN sequences.
Fig. 34
Fig. 34. Structures of the Ru(ii) complexes with an ODN sequence coupled either on the dppz (49) or on the TAP (50) moiety.
Fig. 35
Fig. 35. Structure of [Ru(TAP)2(phen)]2+.
Fig. 36
Fig. 36. Structure of the Ru(ii) caged neuroactive 4-AP.
Fig. 37
Fig. 37. Structures of caged cathepsin K inhibitor (Cbz-Leu-NHCH2CN) (RCN).
Fig. 38
Fig. 38. Structures of the Ru(ii) complexes containing cathepsin K inhibitors.
Fig. 39
Fig. 39. Confocal microscopy images of mouse osteoclast cells treated with 54. Cells were pre-incubated with 54 (10–1000 nm) for 30 min at 37 °C in the presence of cathepsin B inhibitor CA074Me (1 mm). Cells were treated with the cathepsin K substrate Z-LR-4MbNA (0.25 mm) and nitrosalicylaldehyde (1.0 mm, a precipitating agent), leading to the release of 4MbNA (green fluorescent precipitate indicative of cathepsin activity, arrows). Cells were fixed and imaged with a confocal laser scanning microscope (Zeiss LSM 780) using a 40× oil immersion lens. For each of the conditions at least six images of individual osteoclast cells were acquired, and fluorescence intensity per osteoclast area was measured and quantified using ImageJ software (NIH). The intensity of green fluorescence is a direct measure of the quantity of hydrolyzed and precipitated substrate (A–D), also visible on DIC images (E–H). The quantified data are shown as column (I) and dot (J) plots; *p < 0.05, **p < 0.001. Results are representative of at least three experiments. Reproduced with permission from ref. 113. © 2014 Wiley-VCH Verlag GmbH & Co. KGaA, Weinheim.
Fig. 40
Fig. 40. Confocal microscopy images of mouse osteoclast cells treated with the ruthenium-caged inhibitor 56 (A–D) or cis-[Ru(bpy)2(MeCN)2](PF6)2 (E–H). Cells were pre-incubated with either complex (0–1000 nm) for 30 min at 37 °C in the presence of cathepsin B inhibitor CA074Me (1 mm), then exposed to dark (no irradiation) or light (irradiation at 250 W, 395–750 nm) conditions for 15 min. Cells were treated with the cathepsin K substrate Z-LR-4MbNA (0.25 mm) and nitrosalicylaldehyde (1.0 mm, a precipitating agent), leading to the release of 4MbNA (green fluorescent precipitate indicative of cathepsin activity). Cells were fixed and imaged with a confocal laser scanning microscope (Zeiss LSM 780) using a 40× oil immersion lens. For each of the conditions at least six images of individual osteoclast cells were acquired, and fluorescence intensity per osteoclast area was measured and quantified using ImageJ (NIH) software as described for Fig. 39 above; **p < 0.001. Results are representative of at least three experiments. Reproduced with permission from ref. 113. © 2014 Wiley-VCH Verlag GmbH & Co. KGaA, Weinheim.
Fig. 41
Fig. 41. Structures of the Ru-inhibitor complexes synthesized by Turro.
Fig. 42
Fig. 42. Structures of the caged Ru(ii) complex 60 and of the toxic photoproduct 61 which is released.
None
(From left to right:) Gilles Gasser, Vanessa Pierroz, Cristina Mari and Stefano Ferrari

References

    1. Bergamo A., Gaiddon C., Schellens J. H. M., Beijnen J. H., Sava G. J. Inorg. Biochem. 2012;106:90–99. - PubMed
    1. Kilah N. L., Meggers E. Aust. J. Chem. 2012;65:1325–1332.
    1. Salassa L. Eur. J. Inorg. Chem. 2011:4931–4947.
    1. Sava G., Zorzet S., Turrin C., Vita F., Soranzo M., Zabucchi G., Cocchietto M., Bergamo A., DiGiovine S., Pezzoni G., Sartor L., Garbisa S. Clin. Cancer Res. 2003;9:1898–1905. - PubMed
    1. Rademaker-Lakhai J. M., van den Bongard D., Pluim D., Beijnen J. H., Schellens J. H. M. Clin. Cancer Res. 2004;10:3717–3727. - PubMed

LinkOut - more resources