

A charge polarization model for the metal-specific activity of superoxide dismutases
- PMID: 29308487
- PMCID: PMC5901066
- DOI: 10.1039/c7cp06829h
A charge polarization model for the metal-specific activity of superoxide dismutases
Abstract
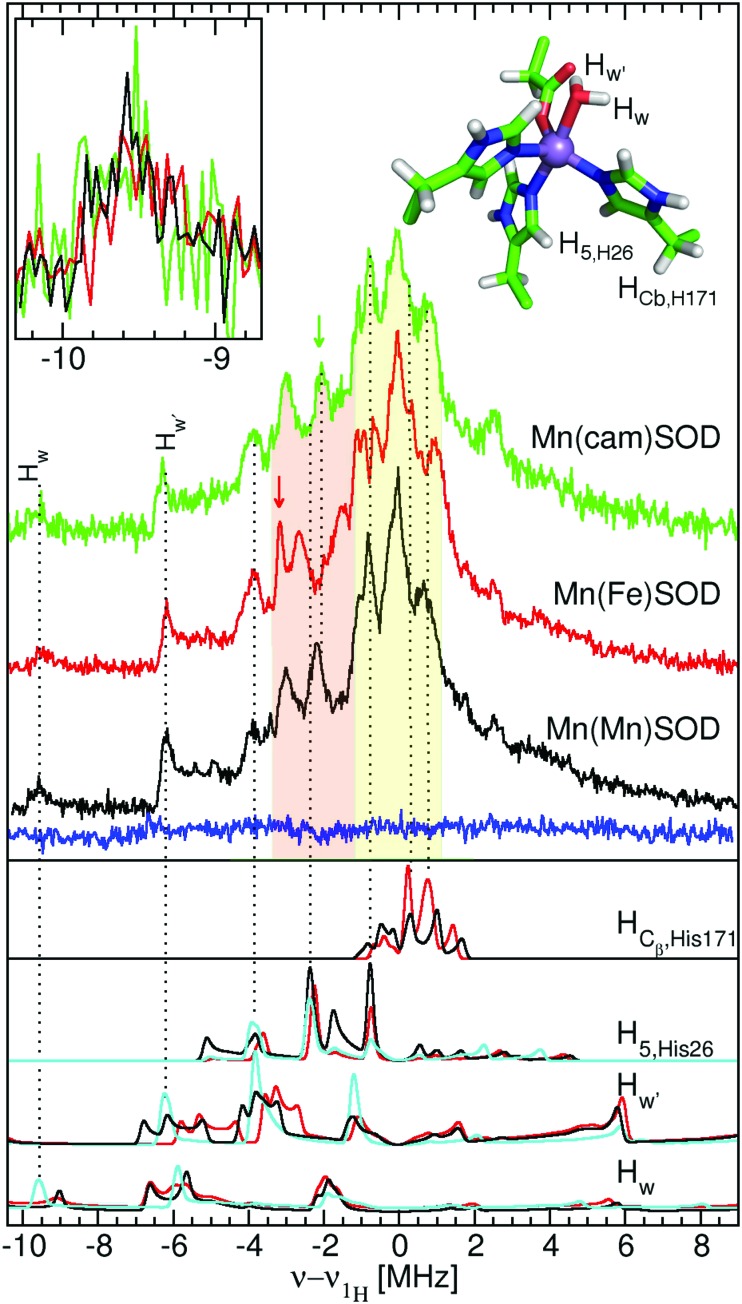
The pathogenicity of Staphylococcus aureus is enhanced by having two superoxide dismutases (SODs): a Mn-specific SOD and another that can use either Mn or Fe. Using 94 GHz electron-nuclear double resonance (ENDOR) and electron double resonance detected (ELDOR)-NMR we show that, despite their different metal-specificities, their structural and electronic similarities extend down to their active-site 1H- and 14N-Mn(ii) hyperfine interactions. However these interactions, and hence the positions of these nuclei, are different in the inactive Mn-reconstituted Escherichia coli Fe-specific SOD. Density functional theory modelling attributes this to a different angular position of the E. coli H171 ligand. This likely disrupts the Mn-H171-E170' triad causing a shift in charge and in metal redox potential, leading to the loss of activity. This is supported by the correlated differences in the Mn(ii) zero-field interactions of the three SOD types and suggests that the triad is important for determining metal specific activity.
Figures


Similar articles
-
Pronounced conversion of the metal-specific activity of superoxide dismutase from Porphyromonas gingivalis by the mutation of a single amino acid (Gly155Thr) located apart from the active site.Biochemistry. 2003 Sep 16;42(36):10790-9. doi: 10.1021/bi0349625. Biochemistry. 2003. PMID: 12962504
-
Mutational and spectroscopic studies of the significance of the active site glutamine to metal ion specificity in superoxide dismutase.J Inorg Biochem. 2000 Jul 1;80(3-4):247-56. doi: 10.1016/s0162-0134(00)00086-6. J Inorg Biochem. 2000. PMID: 11001096
-
Manganese(II) zero-field interaction in cambialistic and manganese superoxide dismutases and its relationship to the structure of the metal binding site.J Am Chem Soc. 2004 Mar 10;126(9):2720-6. doi: 10.1021/ja036503x. J Am Chem Soc. 2004. PMID: 14995187
-
Understanding the influence of the protein environment on the Mn(II) centers in Superoxide Dismutases using High-Field Electron Paramagnetic Resonance.Biochim Biophys Acta. 2010 Feb;1804(2):308-17. doi: 10.1016/j.bbapap.2009.09.027. Epub 2009 Oct 8. Biochim Biophys Acta. 2010. PMID: 19818880 Review.
-
Superoxide dismutases: active sites that save, but a protein that kills.Curr Opin Chem Biol. 2004 Apr;8(2):162-8. doi: 10.1016/j.cbpa.2004.02.011. Curr Opin Chem Biol. 2004. PMID: 15062777 Review.
Cited by
-
An ancient metalloenzyme evolves through metal preference modulation.Nat Ecol Evol. 2023 May;7(5):732-744. doi: 10.1038/s41559-023-02012-0. Epub 2023 Apr 10. Nat Ecol Evol. 2023. PMID: 37037909 Free PMC article.
-
Interchangeable utilization of metals: New perspectives on the impacts of metal ions employed in ancient and extant biomolecules.J Biol Chem. 2021 Dec;297(6):101374. doi: 10.1016/j.jbc.2021.101374. Epub 2021 Oct 31. J Biol Chem. 2021. PMID: 34732319 Free PMC article. Review.
-
The structure-function relationships and physiological roles of MnSOD mutants.Biosci Rep. 2022 Jun 30;42(6):BSR20220202. doi: 10.1042/BSR20220202. Biosci Rep. 2022. PMID: 35662317 Free PMC article. Review.
-
Designing Artificial Metalloenzymes by Tuning of the Environment beyond the Primary Coordination Sphere.Chem Rev. 2022 Jul 27;122(14):11974-12045. doi: 10.1021/acs.chemrev.2c00106. Epub 2022 Jul 11. Chem Rev. 2022. PMID: 35816578 Free PMC article. Review.
-
An evolutionary path to altered cofactor specificity in a metalloenzyme.Nat Commun. 2020 Jun 1;11(1):2738. doi: 10.1038/s41467-020-16478-0. Nat Commun. 2020. PMID: 32483131 Free PMC article.
References
MeSH terms
Substances
Grants and funding
LinkOut - more resources
Full Text Sources
Other Literature Sources