. 2018 Jan 8:7:e30094.
doi: 10.7554/eLife.30094.

Dissection of affinity captured LINE-1 macromolecular complexes

Affiliations

Dissection of affinity captured LINE-1 macromolecular complexes

Martin S Taylor et al. Elife. .

Abstract

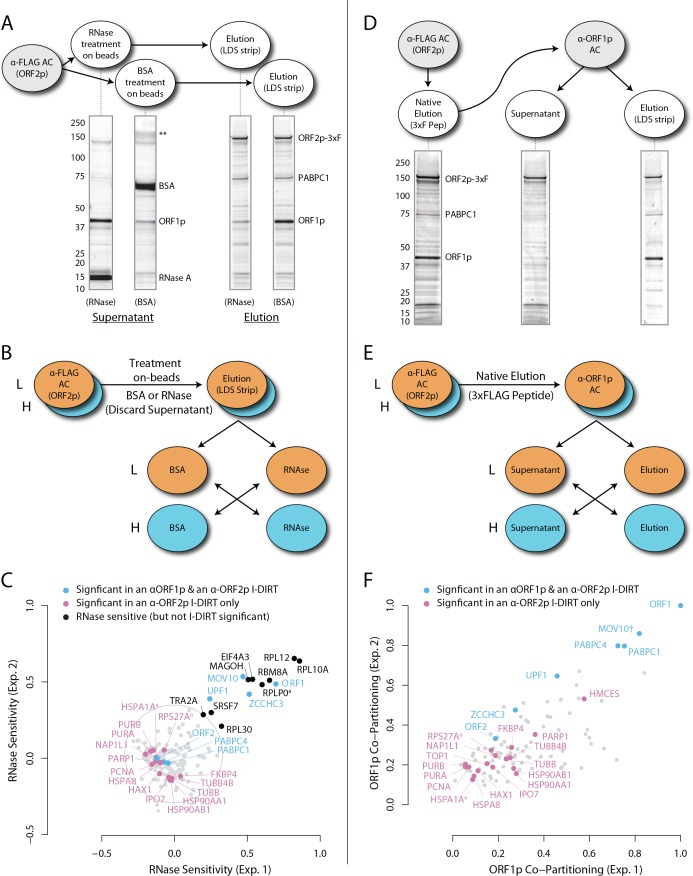
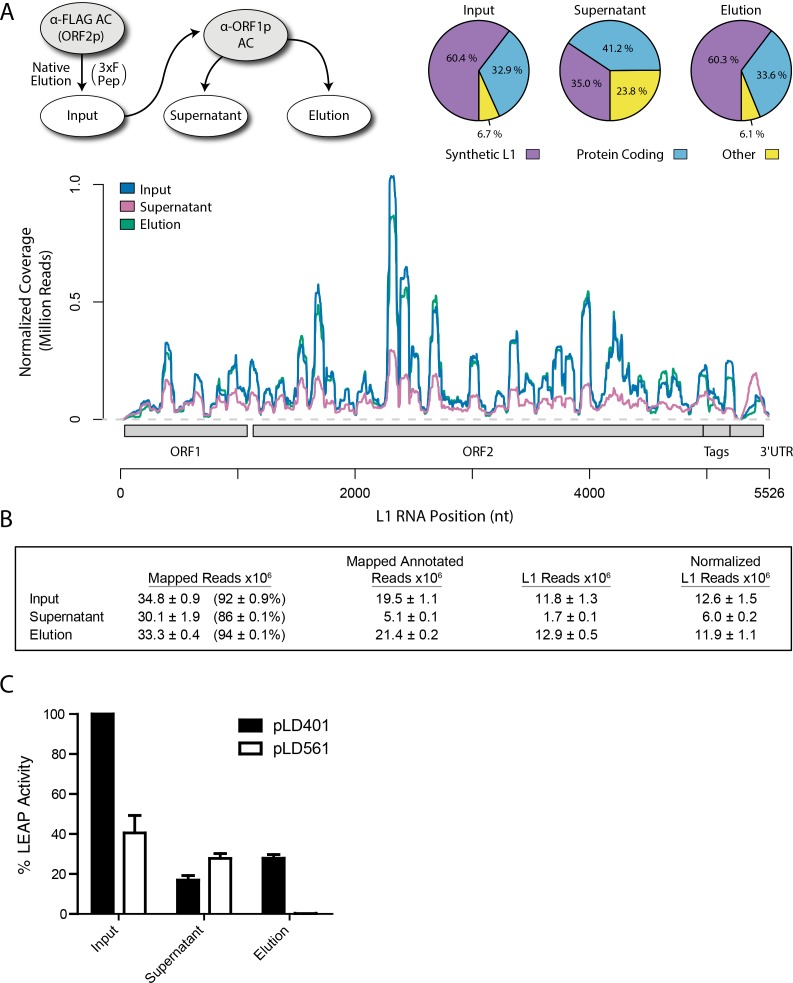
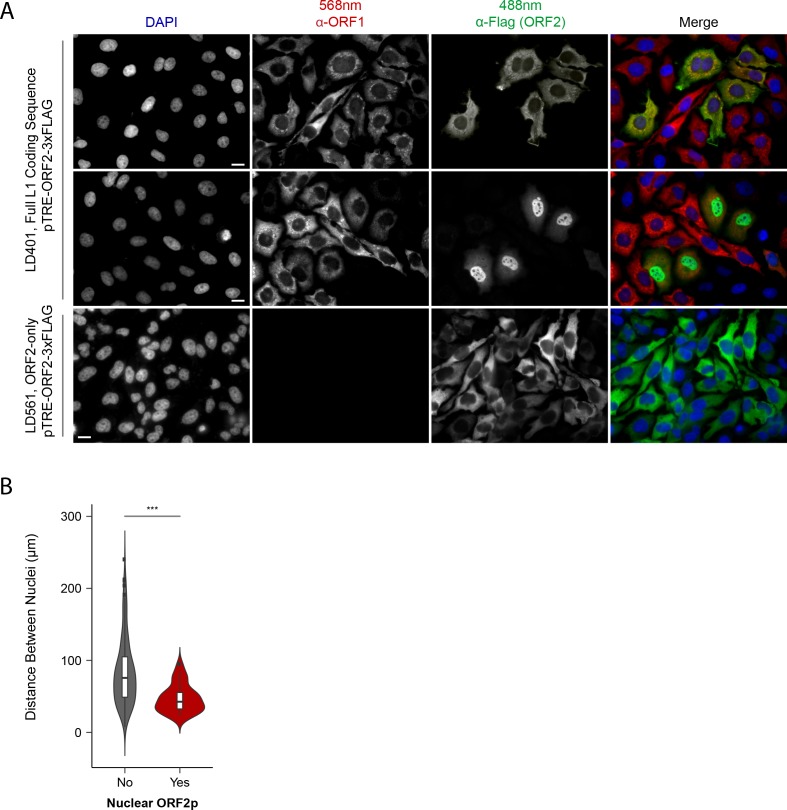
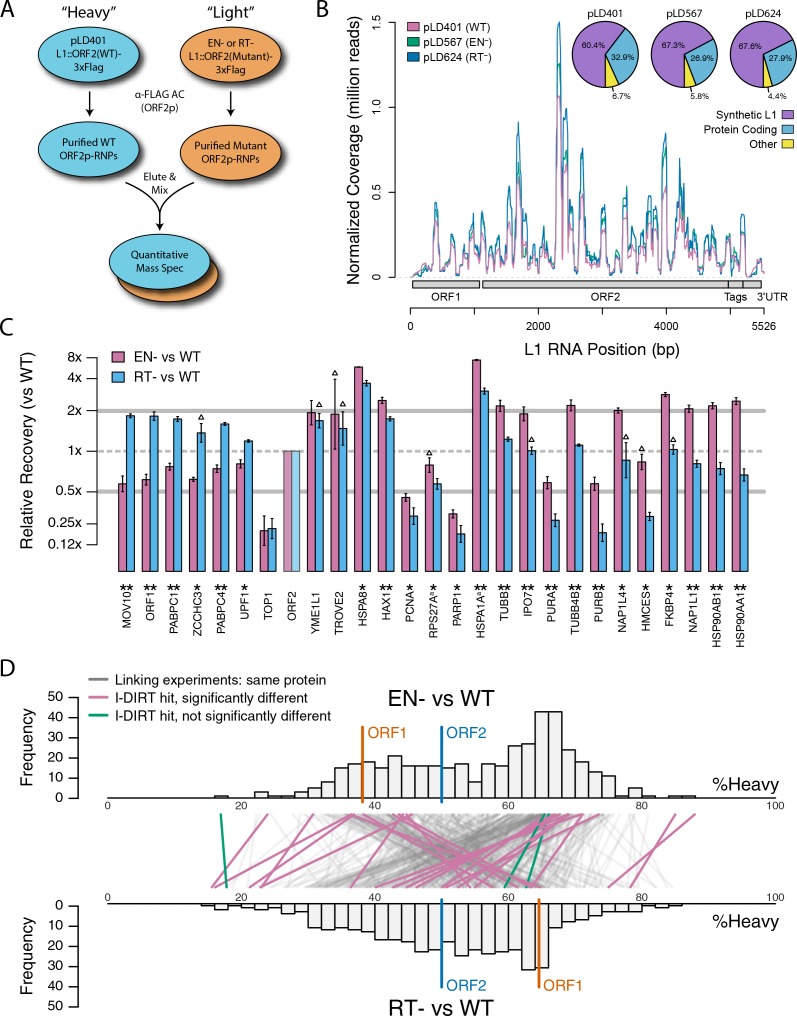
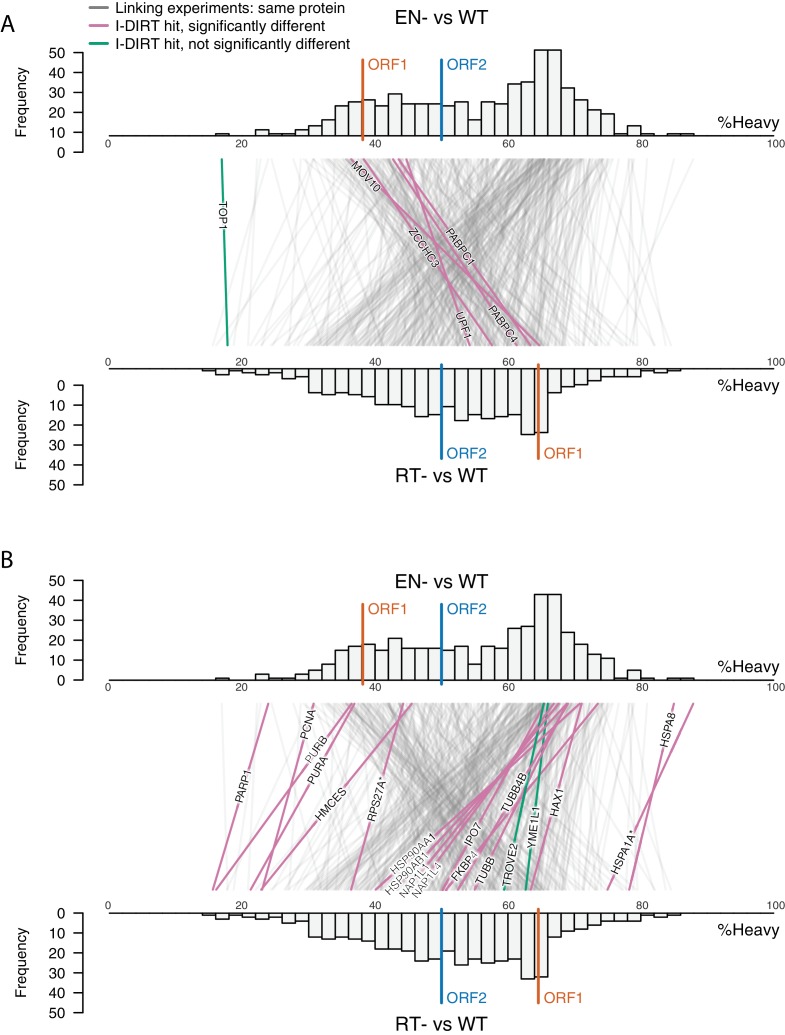
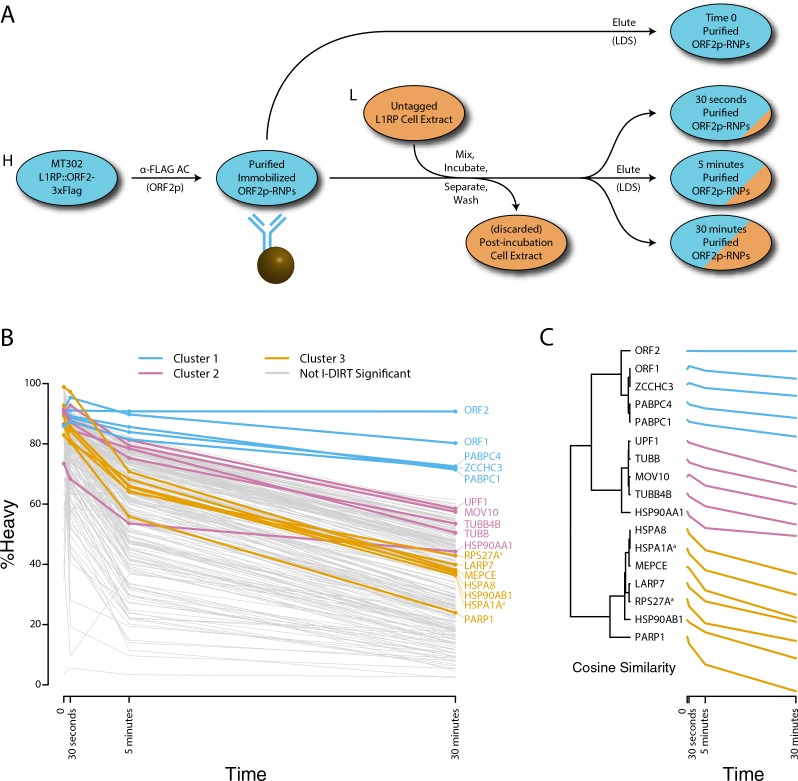
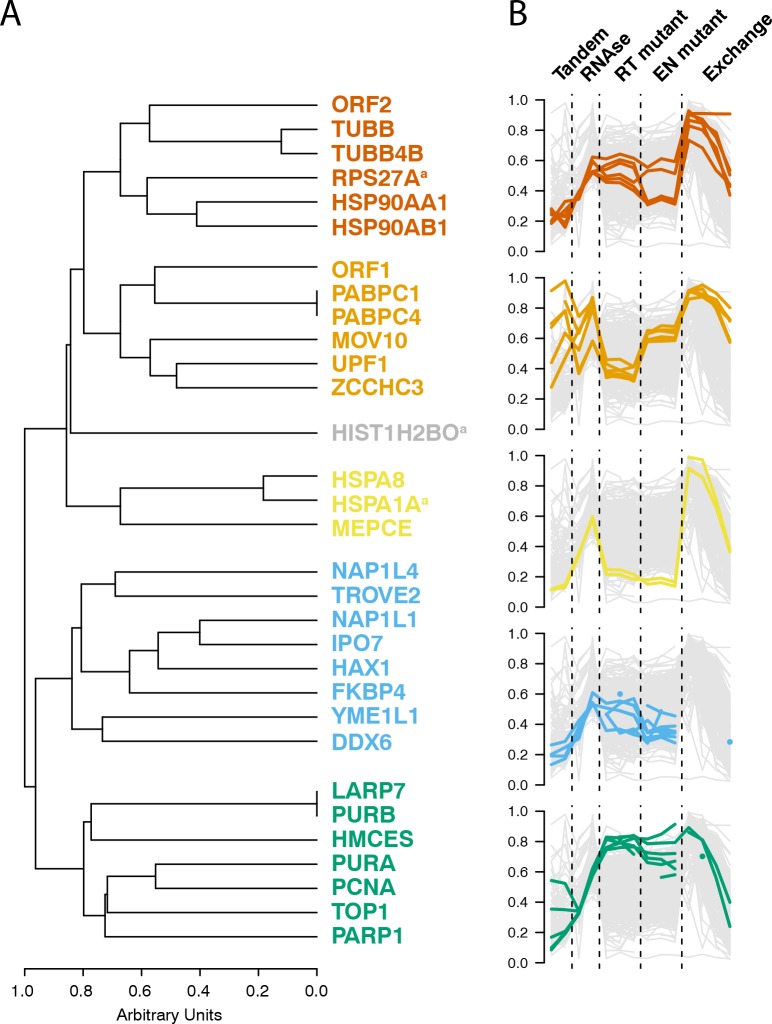
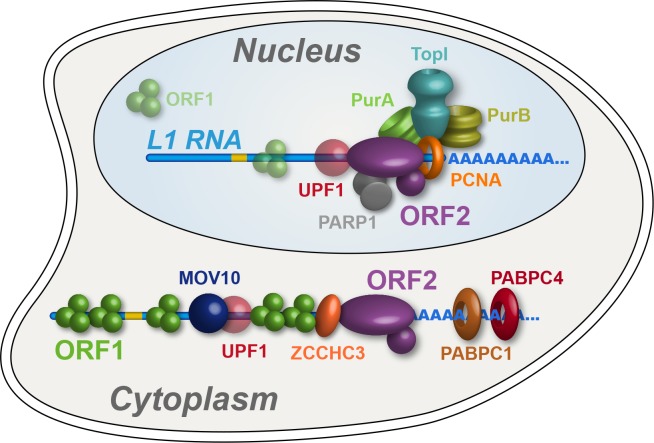
Long Interspersed Nuclear Element-1 (LINE-1, L1) is a mobile genetic element active in human genomes. L1-encoded ORF1 and ORF2 proteins bind L1 RNAs, forming ribonucleoproteins (RNPs). These RNPs interact with diverse host proteins, some repressive and others required for the L1 lifecycle. Using differential affinity purifications, quantitative mass spectrometry, and next generation RNA sequencing, we have characterized the proteins and nucleic acids associated with distinctive, enzymatically active L1 macromolecular complexes. Among them, we describe a cytoplasmic intermediate that we hypothesize to be the canonical ORF1p/ORF2p/L1-RNA-containing RNP, and we describe a nuclear population containing ORF2p, but lacking ORF1p, which likely contains host factors participating in target-primed reverse transcription.

Keywords: LINE-1; affinity proteomics; biochemistry; chemical biology; computational biology; human; interactome; retrotransposon; ribonucleoprotein; systems biology.


Conflict of interest statement

MT, IA, KM, PM, HJ, EA, AW, SB, DI, GE, KB, DF, BC, DA, MR, JB, JL No competing interests declared

Figures

Figure 1.
Figure 1.. RNase sensitivity and split-tandem affinity capture of L1 ORF2p RNPs.
(A) On-bead RNase-sensitivity assay: L1 complexes were affinity captured by ORF2p-3xFLAG. The magnetic media were then treated with a solution containing either a mixture of RNases A and T1 or BSA. After treatment, the supernatants were removed and the remaining bound material was released with LDS. Proteins requiring intact RNA to maintain stable interactions with immobilized ORF2p were released from the RNase-treated medium, while the BSA-treated sample controlled for the spontaneous release of proteins from the medium. Representative SDS-PAGE/Coomassie blue stained gel lanes are shown for each fraction. (B) The experiments described above were carried out in duplicate, once with light isotopically labeled cells (L) and once with heavy isotopically labeled cells (H), resulting in four label-swapped, SILAC duplicates (one light set and one heavy set). The four fractions were cross-mixed and the differential protein retention upon the affinity medium during the treatments (BSA vs. RNase) was assessed by quantitative MS. (C) Results from the RNase-sensitivity assay graphed as the fraction of each detected protein present in the BSA-treated sample (RNase-sensitive proteins are more present in the BSA treated sample), normalized such that proteins that did not change upon treatment with RNases are centered at the origin. A cut-off of p=10−3 for RNase-sensitivity is indicated by a light gray circle; proteins that are RNase-sensitive with a statistical significance of p<10−3 are outside the circle. Proteins previously ranked significant by I-DIRT analysis (Table 1) are labeled and displayed in blue or magenta (as indicated); black nodes were RNase-sensitive but not significant by I-DIRT; gray, unlabeled nodes were neither RNase-sensitive nor significant by I-DIRT. (D) Split-tandem affinity capture: L1 complexes were affinity captured by ORF2p-3xFLAG. After native elution with 3xFLAG peptide, this fraction was depleted of ORF1p-containing complexes using an α-ORF1 conjugated magnetic medium, resulting in a supernatant fraction depleted of ORF1p-containing complexes. The α-ORF1 bound material was then released with LDS, yielding an elution fraction enriched for ORF1p-containing complexes. Representative SDS-PAGE/Coomassie blue stained results for each fraction are shown. (E) SILAC duplicates, two supernatants and two elutions, were cross-mixed to enable an assessment of the relative protein content of each fraction by quantitative MS. (F) The results from split-tandem affinity capture graphed as the fraction of each protein observed in the elution sample. In order to easily visualize the relative degree of co-partitioning of constituent proteins with ORF1p, these data were normalized, setting the fraction of ORF1p in the elution to 1. Proteins which were previously ranked significant by I-DIRT analysis are labeled and displayed in blue or magenta (as indicated); gray, unlabeled nodes were not found to be significant by I-DIRT. MOV10 is marked with a dagger because in one replicate of this experiment it was detected by a single unique peptide, whereas we have enforced a minimum of two peptides (see Materials and methods) for all other proteins, throughout all other proteomic analyses presented here.
Figure 2.
Figure 2.. Transcriptomic and enzymatic analysis of split-tandem RNP fractions.
(A) RNA sequencing affinity captured L1s: L1 complexes were obtained by split-tandem affinity capture, as in Figure 1D (simplified schematic shown); RNA extracted from these three fractions was subjected to next-generation sequencing. The results are summarized with respect to coverage of the synthetic L1 sequence (see schematic with nucleotide coordinates) as well as the relative quantities of mapped, annotated reads (pie charts; the mean of duplicate experiments is displayed). (B) Summary of sequencing reads: displays the total number of sequencing reads that mapped to our reference library, the subset of mapped reads carrying a genome annotation, and the number of reads that corresponding to L1, both raw and normalized (see Materials and methods and Supplementary file 4). The mean of duplicate experiments is displayed; ±indicates the data range. (C) LINE-1 element amplification protocol (LEAP) of affinity captured L1s: L1 complexes were obtained from full length synthetic L1 (pLD401) and an otherwise identical ΔORF1 construct (pLD561) following the same experimental design as in (A), except that elution from α-ORF1p affinity medium was done natively, by competitive elution. In this assay, L1 cDNAs are produced, in cis, by ORF2p catalyzed reverse transcription of L1 RNAs; the resulting cDNAs by were measured by quantitative PCR and presented as relative quantities normalized to pLD401 input (Supplementary file 4). The mean of duplicate experiments is displayed; error bars indicate the data range.
Figure 3.
Figure 3.. Immunofluorescent imaging reveals ORF1p expression is required for nuclear ORF2p staining.
(A) Puromycin-selected HeLa-M2 cells containing pLD401 (Tet promoter, [ORFeus-Hs] full L1 coding sequence, ORF2p-3xFLAG, top two rows) or pLD561 (Tet promoter, ΔORF1, ORF2p-3xFLAG, bottom row) were plated on fibronectin-coated coverslips and induced for 24 hr with doxycycline prior to fixation and staining. With pLD401, the previously-observed pattern of cytoplasmic-only ORFs (top row) and a new pattern of pairs of cells displaying ORF2p in the nucleus (middle row) were apparent. When ORF1p was omitted from the construct (pLD561, bottom row), nuclear ORF2p was not apparent. Scale bars: 10 μm. (B) Statistical analysis of the distances between pairs of ORF2p + nuclei as compared to random: Violin plots of the distributions of shortest distances between 1000 pairs of randomly selected nuclei (‘no’) and the observed pairs of ORF2p + nuclei (‘yes’) in cells transfected with pLD401; n = 262 cells, 47 nuclear ORF2+. ***p=3.955 × 10⁻¹¹ (Welch's t-test).
Figure 4.
Figure 4.. Catalytic inactivation of ORF2p alters the L1 interactome: L1s were affinity captured from cells expressing enzymatically active ORF2p-3xFLAG sequences (pLD401, WT), a catalytically inactivated endonuclease point mutant (pLD567; H230A, EN-), and a catalytically inactivated reverse transcriptase point mutant (pLD624; D702Y, RT-). These were analyzed by next-generation RNA sequencing and quantitative MS.
(A) Proteomic workflow: WT L1s were captured from heavy-labeled cells, EN- and RT- L1s were captured from light-labeled cells. WT and either EN- or RT- fractions were mixed after affinity capture, in triplicate, and the relative abundance of each co-captured protein in the mixture was determined by quantitative MS. (B) L1 RNA yield and coverage between different preparations: As in Figure 2A, RNA extracted from 3xFLAG eluates originating from pLD401, pLD567, and pLD624 were subjected to next-generation sequencing. The results are summarized with respect to coverage of the synthetic L1 sequence (see schematic with nucleotide coordinates) as well as the relative quantities of mapped, annotated reads. The mean of duplicate experiments is displayed. (C) I-DIRT significant proteins displayed were detected in at least two replicates. All values were normalized to ORF2p. Data are represented as mean ±SD. Triangles (▵) mark proteins whose levels of co-capture did not exhibit statistically significant differences in the mutant compared to the WT. A single or double asterisk denotes a statistically significant difference between the relative abundances of the indicated protein in EN- and RT- mutants: p-values of between 0.05–0.01 (*) and below 0.01 (**), respectively. Gray horizontal bars on the plot mark the 2x (upper) and 0.5x (lower) effect levels. (D) The double histogram plot displays the distributions of all proteins identified in at least two replicates, in common between both EN/WT (TOP) and RT/WT (LOWER) affinity capture experiments. The x-axis indicates the relative recovery of each copurifying protein and the y-axis indicates the number of proteins at that value (binned in two unit increments). The data are normalized to ORF2p. The relative positions of ORF2p and ORF1p are marked by colored bars. Differently colored lines illustrate the relative change in positions of the proteins within the two distributions (as indicated). Colored lines denote I-DIRT significance, with magenta lines indicating a statistically significant shift in position (p≤0.05) within the two distributions and green lines indicating that statistical significance was not reached (entities labeled in Figure 4—figure supplement 1). A cluster of magenta lines can be seen to track with ORF1p (red line, upper and lower histogram), and another cluster can be seen to behave oppositely, creating a crisscross pattern in the center of the diagram. A similar crisscross pattern is exhibited by many gray lines.
Figure 4—figure supplement 1.
Figure 4—figure supplement 1.. Double histogram plot with entities labeled.
In the top plot (A), entities crossing from left to right, increasing between EN- and RT- mutants (and TOP1, in green), are labeled. In the bottom plot (B), entities crossing from right to left, decreasing between EN- and RT- mutants (and TROVE2 and YMEL1, in green).
Figure 5.
Figure 5.. Monitoring coordinated dissociation and exchange exhibited by L1 interactors in vitro: L1s were affinity captured from heavy-labeled cells expressing ORF2p-3xFLAG in the context of the naturally occurring L1RP sequence (pMT302); the stabilities of the protein constituents of the captured heavy-labeled L1 population were monitored in vitro by competitive exchange with light-labeled cell extracts containing untagged L1s (pMT298) (Taylor et al., 2013).
(A) 3xFLAG-tagged L1s were captured from heavy-labeled cells and then, while immobilized on the affinity medium, were treated with an otherwise identically prepared, light-labeled, untagged-L1-expressing cell extract. Untreated complexes were compared to independently prepared complexes incubated for 30 s, 5 min, and 30 min, (respectively) to determine the relative levels of in vivo assembled heavy-labeled interactors and in vitro exchanged light-labeled interactors, using quantitative MS. (B) The results were plotted to compare the percentage of heavy-labeled protein versus time. I-DIRT significant proteins from Table 1 are highlighted if present. Three clusters were observed (as indicated). (C) The cosine distance between the observed I-DIRT significant proteins was plotted along with time.
Figure 6.
Figure 6.. Interactomic data integration
(A) All MS-based affinity proteomic experiments presented were combined and analyzed for similarities across all I-DIRT significant proteins, producing five groupings. Distance are presented on a one-unit arbitrary scale (see Materials and methods: Mass Spectrometry Data Analysis). (B) The traces of each protein in each cluster, across all experiments, are displayed. The y-axis indicates the raw relative-enrichment value and the x-axis indicates the categories of each experiment-type. Each category is as wide as the number of replicates or time-point samples collected.
Figure 7.
Figure 7.. Refined interatomic model: Our results support the existence of distinct cytoplasmic and nuclear L1 interactomes.
Affinity capture of L1 via 3xFLAG-tagged ORF2p from cell extracts results in a composite purification consisting of several macromolecular (sub)complexes. Among these, we propose a canonical cytoplasmic L1 RNP (depicted) and one or more nuclear macromolecules. UPF1 exhibited equivocal behavior within our fractionations and was also co-captured with chromatin associated ORF2p, suggesting it participates in both cytoplasmic and nuclear L1 interactomes. Within the nuclear L1 interactome, our data support the existence of a physically linked entity consisting of (at least) PCNA, PURA/B, TOP1, and PARP1 (depicted).
Appendix 1—figure 1.
Appendix 1—figure 1.. SILAC suspension expression of L1 constructs: western blotting.
Appendix 1—figure 2.
Appendix 1—figure 2.. RNase sensitivity affinity capture: data normalization.
Appendix 1—figure 3.
Appendix 1—figure 3.. RNase sensitivity affinity capture: normality test.
Appendix 1—figure 4.
Appendix 1—figure 4.. Split-tandem affinity capture: data normalization.
Appendix 1—figure 5.
Appendix 1—figure 5.. Distances between two-node groups.
Appendix 1—figure 6.
Appendix 1—figure 6.. Distances between three-node groups.
Appendix 1—figure 7.
Appendix 1—figure 7.. Efficacy of elution using ORF1p peptides: Coomassie blue stained gel .
Appendix 1—figure 8.
Appendix 1—figure 8.. Retrotransposition mutants affinity capture: distributions of normalized affinities.
Appendix 1—figure 9.
Appendix 1—figure 9.. Protein in vitro exchange: the distributions of H/(H+L) values.

Comment in

  • On the move.
    Martin SL. Martin SL. Elife. 2018 Feb 21;7:e34901. doi: 10.7554/eLife.34901. Elife. 2018. PMID: 29465398 Free PMC article.

Similar articles

Cited by

References

    1. Alisch RS, Garcia-Perez JL, Muotri AR, Gage FH, Moran JV. Unconventional translation of mammalian LINE-1 retrotransposons. Genes & Development. 2006;20:210–224. doi: 10.1101/gad.1380406. - DOI - PMC - PubMed
    1. Altukhov I. LINE-1. 1e90c62Bitbucket. 2017 https://bitbucket.org/altukhov/line-1/
    1. An W, Dai L, Niewiadomska AM, Yetil A, O'Donnell KA, Han JS, Boeke JD. Characterization of a synthetic human LINE-1 retrotransposon ORFeus-Hs. Mobile DNA. 2011;2:2. doi: 10.1186/1759-8753-2-2. - DOI - PMC - PubMed
    1. Arjan-Odedra S, Swanson CM, Sherer NM, Wolinsky SM, Malim MH. Endogenous MOV10 inhibits the retrotransposition of endogenous retroelements but not the replication of exogenous retroviruses. Retrovirology. 2012;9:53. doi: 10.1186/1742-4690-9-53. - DOI - PMC - PubMed
    1. Arlander SJ, Eapen AK, Vroman BT, McDonald RJ, Toft DO, Karnitz LM. Hsp90 inhibition depletes Chk1 and sensitizes tumor cells to replication stress. Journal of Biological Chemistry. 2003;278:52572–52577. doi: 10.1074/jbc.M309054200. - DOI - PubMed

Publication types