. 2018 Feb 1;128(2):721-733.
doi: 10.1172/JCI96957. Epub 2018 Jan 8.

Influenza-specific lung-resident memory T cells are proliferative and polyfunctional and maintain diverse TCR profiles

Affiliations

Influenza-specific lung-resident memory T cells are proliferative and polyfunctional and maintain diverse TCR profiles

Angela Pizzolla et al. J Clin Invest. .

Abstract

The human lung harbors a large population of resident memory T cells (Trm cells). These cells are perfectly positioned to mediate rapid protection against respiratory pathogens such as influenza virus, a highly contagious respiratory pathogen that continues to be a major public health burden. Animal models show that influenza-specific lung CD8+ Trm cells are indispensable for crossprotection against pulmonary infection with different influenza virus strains. However, it is not known whether influenza-specific CD8+ Trm cells present within the human lung have the same critical role in modulating the course of the disease. Here, we showed that human lung contains a population of CD8+ Trm cells that are highly proliferative and have polyfunctional progeny. We observed that different influenza virus-specific CD8+ T cell specificities differentiated into Trm cells with varying efficiencies and that the size of the influenza-specific CD8+ T cell population persisting in the lung directly correlated with the efficiency of differentiation into Trm cells. To our knowledge, we provide the first ex vivo dissection of paired T cell receptor (TCR) repertoires of human influenza-specific CD8+ Trm cells. Our data reveal diverse TCR profiles within the human lung Trm cells and a high degree of clonal sharing with other CD8+ T cell populations, a feature important for effective T cell function and protection against the generation of viral-escape mutants.

Keywords: Adaptive immunity; Immunology; Infectious disease; Influenza; T cells.


Conflict of interest statement

Conflict of interest: The authors have declared that no conflict of interest exists.

Figures

Figure 1
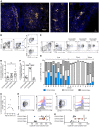
Figure 1. Location and phenotype of resident memory T cells in healthy human lung.
(A) Microscopy of human lung tissue with CD3 (yellow) and DAPI staining. Scale bars: 1000mm. (B) Flow cytometry profiles depicting the level of expression of CD103 and CD69 on memory CD8+ (CD45RO+CD8+CD3+) T cells isolated from human lung. (C) Flow cytometry profiles depicting the level of expression of CD103 and CD69 on memory CD8+, CD4+, and CD4CD8 (CD45RO+CD3+) T cells isolated from human lung. (D) The percentages of antigen-experienced (CD3+CD45RO+) CD8+ T cells in human lung tissue that express CD103+ and CD69+. Dots represent individual donors (n = 10 healthy lungs), and bars depict mean ± SEM (1-way ANOVA, Tukey’s multiple comparison). (E) The percentage of CD8+ Trm cells (CD8+CD45RO+CD103+CD69+) of the total antigen-experienced CD8+ T cell pool (CD3+CD8+CD45RO+) in the lungs of donors plotted against age (years). Dots represent individual donors. (F) The percentage of antigen-experienced (CD3+CD45RO+) CD8 T cells in human lung tissue that express CD103+ and CD69+. Dots represent individual donors (n = 10 healthy lung tissues), and bars depict mean ± SEM (1-way ANOVA, Tukey’s multiple comparison). (G) The proportion of antigen-experienced CD8+ T cells (CD3+CD45RO+CD8+) isolated from the lung, blood, or spleen of donors that express CD103 and CD69. Bars represent individual donors. (H and I) Representative histograms depicting the level of expression of CD28 on CD103+CD69+, CD103CD69, and CD103CD69+ subsets of antigen-experienced CD8+ T cells (CD3+CD8+CD45RO+) isolated from the (H) lung and (I) spleen of healthy donors. (J and K) Graphs depict the mean fluorescence intensity (MFI) of CD28 on subsets of antigen-experienced CD8+ T cells isolated from the (J) lung and (K) spleen. Symbols represent individual donors (1-way ANOVA, Tukey’s multiple comparison). *P < 0.05; ****P < 0.0001.
Figure 2
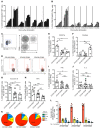
Figure 2. Functional profiles of memory CD8+ T cells in human lung tissue.
Proportion of antigen-experienced CD8+ T cells isolated from lung tissue expressing (A) TNF-α or (B) IFN-γ at various time points after stimulation with PMA/ION. Seven donors are shown. (C) CD103 and CD69 expression by CD8+CD45RO+ T cells delineates 3 subsets: CD103+CD69+ (Trm), CD103CD69+, and CD103CD69. (D and E) Representative flow cytometry profiles showing the proportion of CD107a+ cells for each subset following 4 hours of stimulation with PMA/ION. Red dots indicate stimulated samples, while contour plots show unstimulated control cells. (E) Graph depicts data pooled from 4 donors; dots represent individual donors and bars represent mean ± SEM (n = 4, 1-way ANOVA, Tukey’s multiple comparison). (FJ) T cells isolated from human lung were stimulated for 5 hours with PMA/ION and the proportion of each CD8+ T cell subset (delineated as described in C) synthesizing (F) perforin, (G) granzyme B, (H) TNF-α, (I) IFN-γ, and (J) IL-2 was assessed by intracellular cytokine staining. Dots represent individual donors, and bars represent mean ± SEM (n = 4–7, 1-way ANOVA, Tukey’s multiple comparison). (K) Polyfunctional profiles of antigen-experienced CD8+ T cell subsets. Pie charts corresponding to polyfunctional profiles of CD103+CD69+ (Trm), CD103CD69+, and CD103CD69 T cell subsets isolated from human lung tissue (n = 7) following 5 hours of stimulation with PMA/ION. Assessment of the mean proportion of cells making any combination of 1–4 cytokines (IFN-γ, TNF, IL-2, and granzyme B). (L) Dots depict individual donors, with bars representing mean + SEM. *P < 0.05; **P < 0.01; ***P < 0.001.
Figure 3
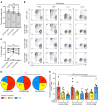
Figure 3. Lung Trm cells are highly proliferative and produce polyfunctional secondary effector cells.
Memory CD8+ T cell subsets, delineated based on the expression of CD103 and CD69, were sort purified from human lung tissue and cultured overnight. (A) The graph depicts the proportion of viable cells within each subset (n = 6 donors, 2-way ANOVA, Tukey’s multiple comparison). Memory CD4+ and CD8+ T cell subsets, delineated based on the expression of CD103 and CD69, were purified from human lung tissue. (B) Representative flow cytometry plots show the dilution of CFSE dye following stimulation for 10 days with anti-CD3 and cytokine production following 5 hours restimulation with PMA/ION. (C) Graph shows the proportion of divided cells for each of the CD8+ T cell subsets; line connects samples from individual donors (n = 8 donors, 1-way ANOVA, Tukey’s multiple comparison). (D and E) Polyfunctional profiles of antigen-experienced CD8+ T cell subsets. Pie charts corresponding to polyfunctional profiles of CD103+CD69+ (Trm), CD103CD69+, and CD103CD69 T cell subsets isolated from human lung tissue, cultured for 10 days, and then stimulated for 5 hours with PMA/ION. Assessment of the mean proportion of CD8+ T cells making any combination of 1–3 cytokines ± SEM (IFN-γ, TNF, and granzyme B). (E) Graph depicts values for individual donors (n = 7 donors, 2-way ANOVA, Šidák’s multiple comparison). *P < 0.05; **P < 0.01.
Figure 4
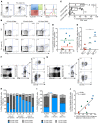
Figure 4. Enrichment of influenza-specific CD8+ T cells in the lung Trm cell pool.
(A) Whole lung tissue was infected with influenza virus (PR8) at MOI of 10 and the proportion and identity of infected cells was measured 18 hours later by intracellular staining for influenza virus NP. (B and C) Proportion of each memory CD8+ T cell subset (delineated based on the expression of CD103 and CD69) producing cytokines (IFN-γ and TNF-α) following 18 hours of stimulation with influenza virus. (B) Representative flow cytometry profile staining for TNF-α and IFN-γ on antigen-experienced CD8+ T cell subsets with (Flu moi 10) or without (Nil) virus stimulation. (C) Data shown are the mean ± SEM (n = 5 donors, 1-way ANOVA, Tukey’s multiple comparison). (D) The percentages of influenza tetramer+CD8+ of the total antigen-experienced CD8+ T cell pool (CD3+CD8+CD45RO+) in the lungs of donors plotted against age (years). (E) The percentage of influenza tetramer+CD8+ T cells of the total antigen-experienced CD8+ T cell pool (CD3+CD8+CD45RO+) in the lungs of donors plotted against HLA type (n = 3-4 donors, 1-way ANOVA, Tukey’s multiple comparison). (F and G) Representative flow cytometry staining assessing the expression of CD103 and CD69 on (F) HLA-B57-NP199–specific or (G) HLA-A2-M158–specific CD8+ T cells isolated from lung tissue. (H) The proportion of influenza virus–specific CD8+ T cells (CD3+CD45RO+CD8+tetramer+) isolated from the lung of donors that express CD103 and CD69. Bars represent individual donors. (I) Data pooled for all donors (A2, n = 3; B57, n = 3; A3, n = 3). Shown is the mean ± SEM (2-way ANOVA, Šidák’s multiple comparison). (J) Graph depicts the Pearson’s correlation between the proportion of tetramer-binding cells of the total CD3+CD8+CD45RO+ pool relative to the proportion of Trm cells (CD103+CD69+) among the tetramer+ cells. Dots represent individual donors. *P < 0.05; **P < 0.01; ***P < 0.001.
Figure 5
Figure 5. Common TCRαβ repertoire within lung Trm cells and CD103CD69+ and CD103CD69 subsets.
Influenza virus–specific CD8+ T cells (CD3+CD45RO+CD8+tetramer+) isolated from the lung of healthy donors were single-cell sorted based on the expression of CD103 and CD69 into Trm (CD103+CD69+), CD103CD69+, and CD103CD69 populations. TCRβ analysis across 3 prominent influenza-specific epitopes (HLA-A2-M158–66, HLA-A3-NP265–273, or HLA-B57-NP199–207) were analyzed according to their (A) CDR3α and CDR3β length; (B) frequency of TCRαβ clonotype sharing between Trm and either CD103CD69+ or CD103CD69 populations; and (C) Simpson’s diversity index.
Figure 6
Figure 6. Shared TCRαβ repertoire within lung Trm cells and CD103CD69+ and CD103CD69 subsets.
Circos plots of frequencies of Vβ-Jβ (BV) and Vα-Jα (AV) usage in paired TCRαβ sequences are shown for CD103+CD69+ (left), CD103CD69+ (middle), and CD69CD103 (right) for donor C (top), donor D (middle), and donor B (bottom). Frequency of each unique clone is represented by the width of the band. In each donor band, colors across the 3 populations represent the same clone. Circos plots were generated with the Circos software package (38).

References

    1. Gao R, et al. Human infection with a novel avian-origin influenza A (H7N9) virus. N Engl J Med. 2013;368(20):1888–1897. doi: 10.1056/NEJMoa1304459. - DOI - PubMed
    1. Braciale TJ. Immunologic recognition of influenza virus-infected cells. II. Expression of influenza A matrix protein on the infected cell surface and its role in recognition by cross-reactive cytotoxic T cells. J Exp Med. 1977;146(3):673–689. doi: 10.1084/jem.146.3.673. - DOI - PMC - PubMed
    1. Kees U, Krammer PH. Most influenza A virus-specific memory cytotoxic T lymphocytes react with antigenic epitopes associated with internal virus determinants. J Exp Med. 1984;159(2):365–377. doi: 10.1084/jem.159.2.365. - DOI - PMC - PubMed
    1. Yewdell JW, Bennink JR, Smith GL, Moss B. Influenza A virus nucleoprotein is a major target antigen for cross-reactive anti-influenza A virus cytotoxic T lymphocytes. Proc Natl Acad Sci U S A. 1985;82(6):1785–1789. doi: 10.1073/pnas.82.6.1785. - DOI - PMC - PubMed
    1. Quiñones-Parra S, et al. Preexisting CD8+ T-cell immunity to the H7N9 influenza A virus varies across ethnicities. Proc Natl Acad Sci U S A. 2014;111(3):1049–1054. doi: 10.1073/pnas.1322229111. - DOI - PMC - PubMed

Publication types

Substances