. 2018 Feb 1;128(2):668-681.
doi: 10.1172/JCI92812. Epub 2018 Jan 8.

Hepatitis B virus-specific T cells associate with viral control upon nucleos(t)ide-analogue therapy discontinuation

Affiliations

Hepatitis B virus-specific T cells associate with viral control upon nucleos(t)ide-analogue therapy discontinuation

Laura Rivino et al. J Clin Invest. .

Abstract

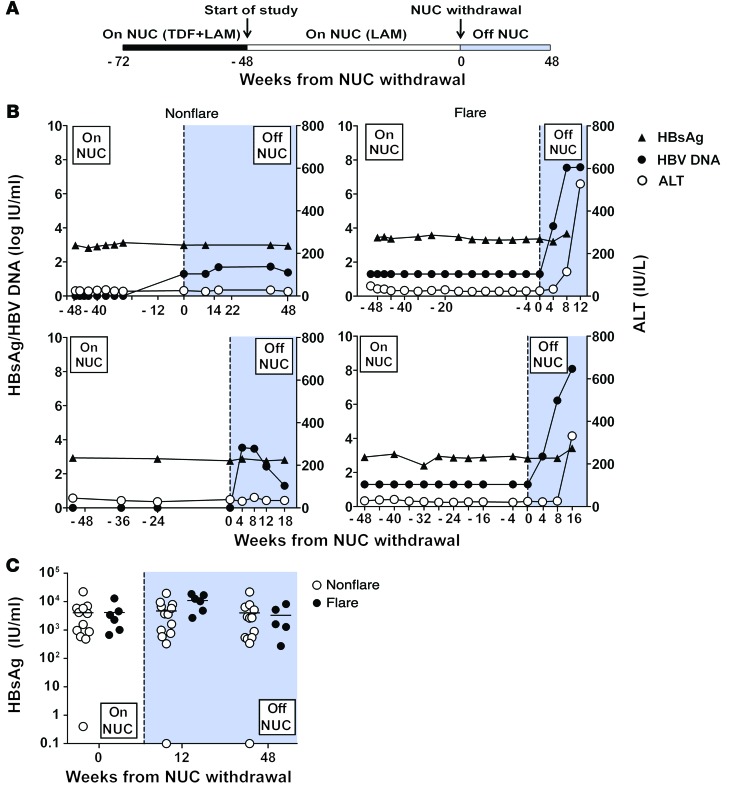
Background: The clinical management of chronic hepatitis B virus (HBV) patients is based exclusively on virological parameters that cannot independently determine in which patients nucleos(t)ide-analogue (NUC) therapy can be safely discontinued. NUCs efficiently suppress viral replication, but do not eliminate HBV. Thus, therapy discontinuation can be associated with virological and biochemical relapse and, consequently, therapy in the majority is life-long.

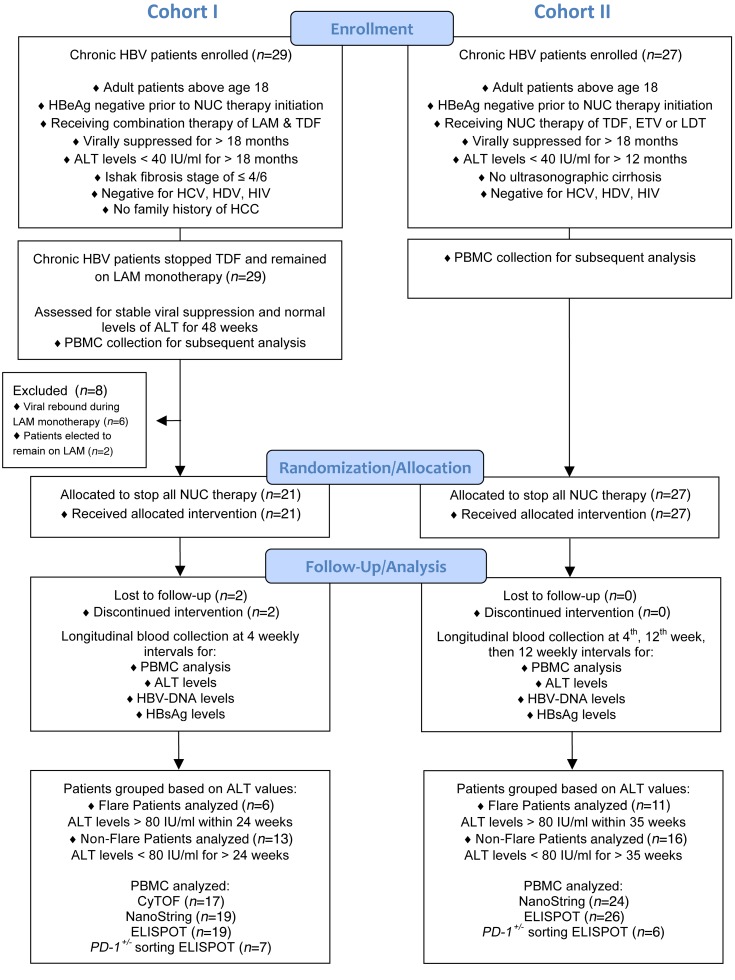
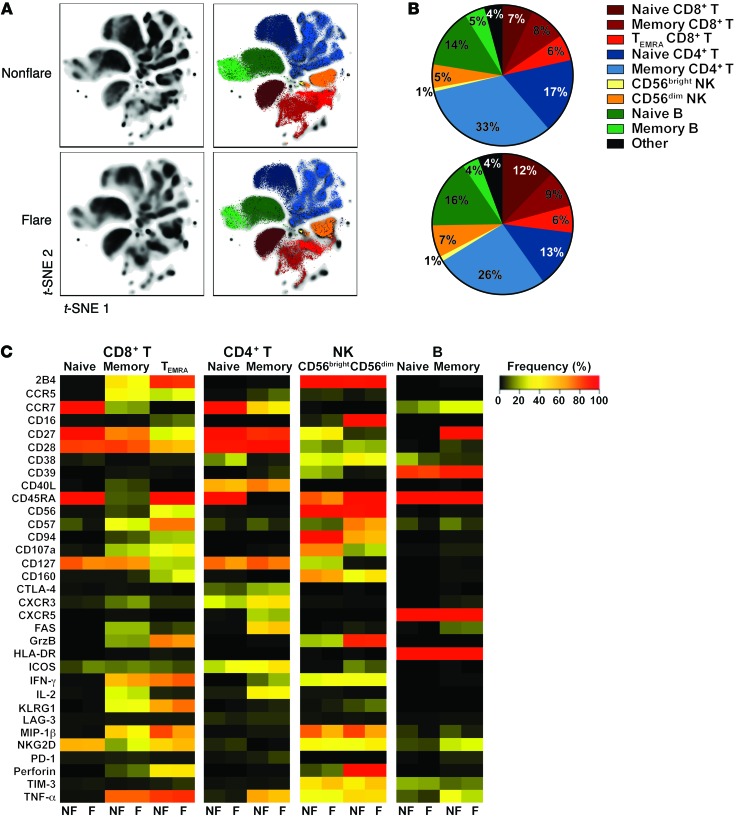
Methods: Since antiviral immunity is pivotal for HBV control, we investigated potential biomarkers for the safe discontinuation of NUCs within immune profiles of chronic HBV patients by utilizing traditional immunological assays (ELISPOT, flow cytometry) in conjunction with analyses of global non-antigen-specific immune populations (NanoString and CyTOF). Two distinct cohorts of 19 and 27 chronic HBV patients, respectively, were analyzed longitudinally prior to and after discontinuation of 2 different NUC therapy strategies.

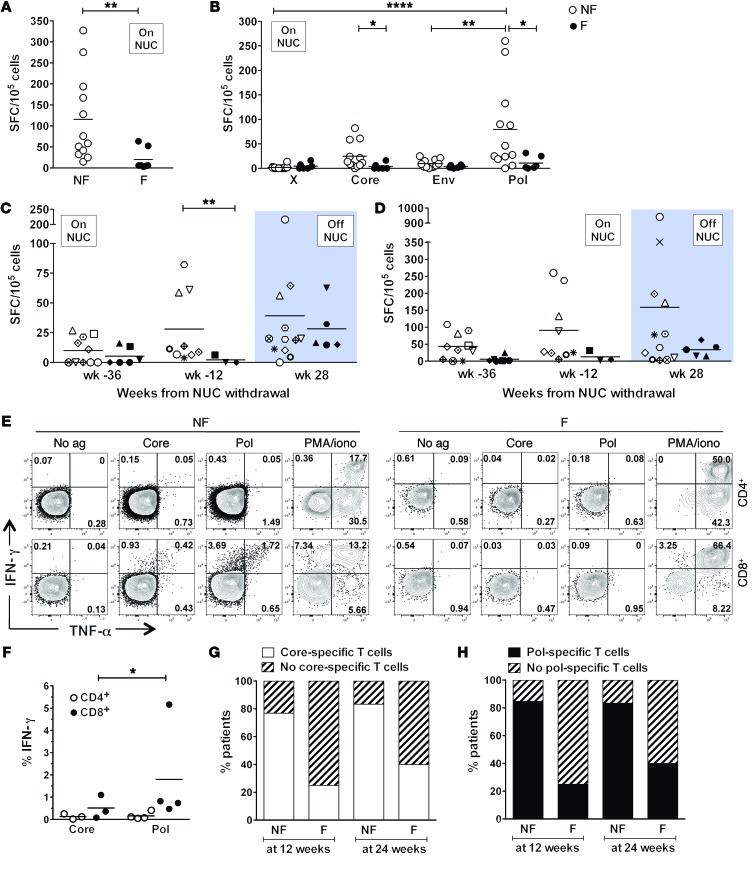
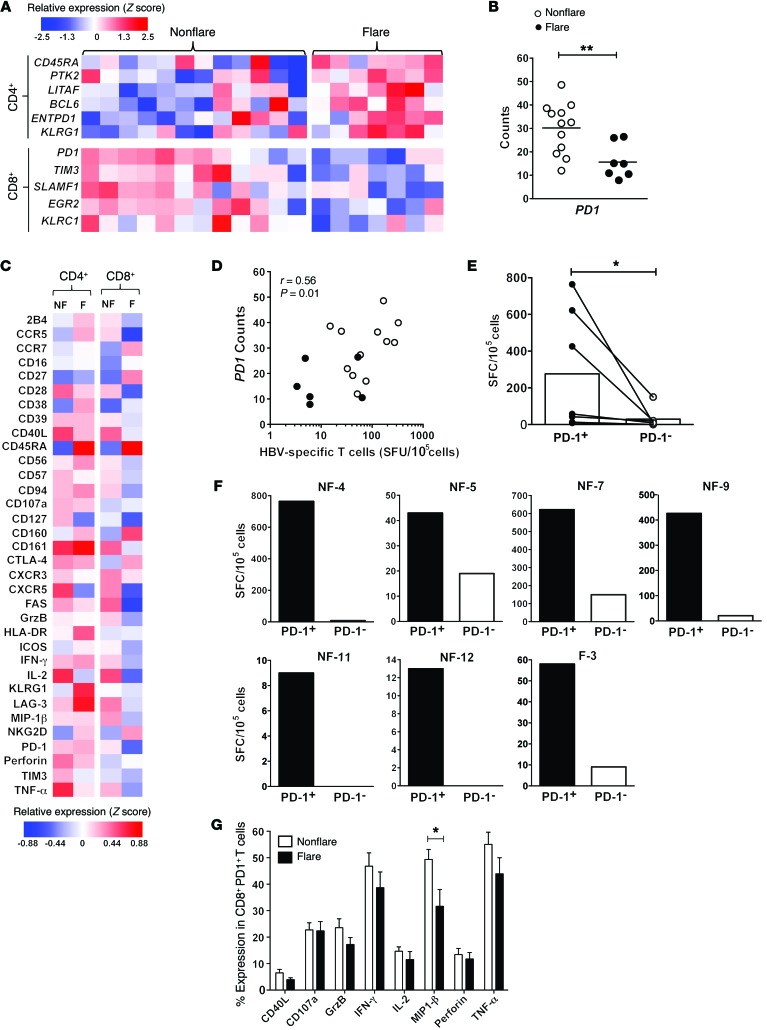
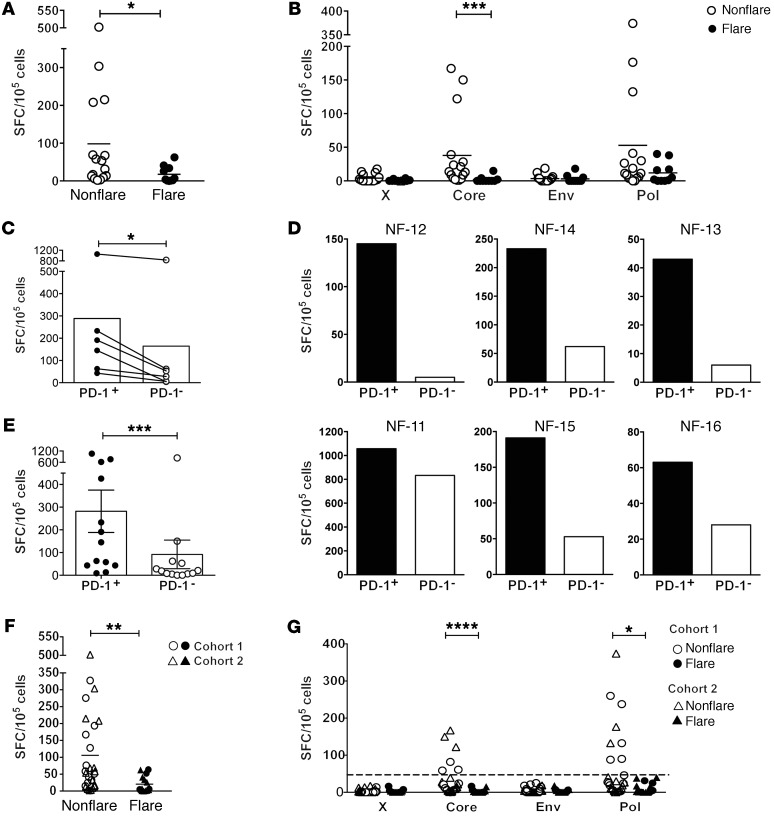
Results: Absence of hepatic flares following discontinuation of NUC treatment correlated with the presence, during NUC viral suppression, of HBV core and polymerase-specific T cells that were contained within the ex vivo PD-1+ population.

Conclusions: This study identifies the presence of functional HBV-specific T cells as a candidate immunological biomarker for safe therapy discontinuation in chronic HBV patients. Furthermore, the persistent and functional antiviral activity of PD-1+ HBV-specific T cells highlights the potential beneficial role of the expression of T cell exhaustion markers during human chronic viral infection.

Funding: This work was funded by a Singapore Translational Research Investigator Award (NMRC/STaR/013/2012), the Eradication of HBV TCR Program (NMRC/TCR/014-NUHS/2015), the Singapore Immunology Network, the Wellcome Trust (107389/Z/15/Z), and a Barts and The London Charity (723/1795) grant.

Keywords: Drug therapy; Hepatitis; Hepatology; Immunology; T cells.


Conflict of interest statement

Conflict of interest: A. Bertoletti declares the following relationship with commercial entities developing therapeutics for HBV treatment. He collaborates and receives research support from Gilead Sciences Inc. to test the effect of HBV antigens on immune cell function. He acted as a consultant and served on the advisory boards of Gilead Sciences Inc., MedImmune, Janssen-Cilag, IONIS Pharmaceuticals, Abivax, and HUMABS BioMed. He is also a cofounder of Lion TCR, a biotech company developing T cell receptors for treatment of virus-related cancers and chronic viral diseases. P.T.F. Kennedy has collaborative grant funding from Gilead Sciences Inc., participates in advisory board/provides consultancy to Gilead Sciences Inc. and Janssen, and is an investigator for industry-led trials with Gilead Sciences Inc., Janssen, Alere, and Assembly Biosciences.

Figures

Figure 1
Figure 1. CONSORT-style flow diagram.
Enrollment, follow-up, and analysis before and after stopping NUC therapy for the UK (cohort 1, left) and Asian (cohort 2, right) chronic HBV patient cohorts. For more details on the enrolled patients, refer to Tables 1 and 2. HCC, hepatocellular carcinoma.
Figure 2
Figure 2. Characteristics of the patient cohort.
(A) Schematic depicting the study design. Patients were enrolled for the study and maintained on NUC therapy for 1 year (48 weeks), after which therapy was discontinued. Weeks are calculated from therapy discontinuation (week 0). (B) Upon stopping therapy, patients were classified as nonflare (2 representative patients [n = 13], left top and bottom panels) or flare (2 representative patients [n = 6], right top and bottom panels) based on ALT and HBV DNA values observed in the 6 months (24 weeks) following therapy discontinuation. Nonflare and flare, patients with ALT values below or above 2× ULN (80 IU/ml), respectively. (C) Serum HBsAg values observed in all patients, subdivided as flare and nonflare upon therapy withdrawal. HBsAg values are measured longitudinally at weeks 0, 12, and 48 from NUC withdrawal. HBsAg values are expressed as IU/ml.
Figure 3
Figure 3. Increased frequencies of circulating HBV core and polymerase-specific T cells in chronic HBV patients undergoing NUC therapy that do not flare upon therapy discontinuation.
HBV-specific T cells were assessed after a 10-day expansion of patient PBMCs with a panel of overlapping 15-mer peptides spanning the HBV proteome, followed by IFN-γ ELISPOT in the presence of peptides pooled according to the single proteins (x, core, env, and pol). Results are expressed as spot-forming cells (SFC) relative to 105 PBMCs. (A) Total HBV-specific T cell responses during NUC therapy (n = 17). (B) Deconvolution of the HBV-specific T cell response from A into the single HBV proteins. T cell responses directed against core (C) or polymerase (D) are shown longitudinally at week –36 (±4 weeks) and –12 (±12 weeks) of NUC therapy and 28 (±8 weeks) weeks after therapy withdrawal. Each symbol represents a single patient; black and white symbols represent flare and nonflare patients, respectively. (E and F) Intracellular cytokine staining for the detection of IFN-γ and TNF-α production by in vitro–expanded CD4+ and CD8+ T cells stimulated in the absence or presence of core and polymerase overlapping peptides or with PMA/ionomycin. Shown are plots from representative nonflare (left panel) and flare (right panel) patients (E). IFN-γ release assessed as in E is summarized for 4 patients from the nonflare group (F). The presence or absence of T cells targeting core (G) or polymerase (H) is shown for patients with or without flares in the 12 or 24 weeks immediately after therapy withdrawal. NF, nonflare; F, flare. *P ≤ 0.05; **P ≤ 0.01; ****P ≤ 0.0001. Statistics were calculated using the nonparametric, 2-tailed Mann-Whitney U test.
Figure 4
Figure 4. High-dimensional analyses by CyTOF of immune populations present in the peripheral blood of patients with and without evidence of flares upon therapy discontinuation.
PBMCs from patients with and without flares upon therapy discontinuation were briefly stimulated with PMA/ionomycin, stained with a panel of 40 antibodies, and analyzed by CyTOF. (A) Live cells were concatenated after downsampling and analyzed in parallel by t-SNE (left panels). Manually gated lymphocyte populations were then overlaid onto the total t-SNE map (right panels). (B) Pie charts showing the average relative frequency of the different lymphocyte populations within the 2 groups of patients. (C) Heatmaps showing the average frequency of expression of each immunological marker within the indicated lymphocyte populations of patients that flared or did not flare upon therapy discontinuation. The percentages of positive expression are shown from low (black) to high (red). t-SNE plot shown in A shows 1 representative experiment. Data shown in B and C represent the average expression from 17 patients (n = 12 nonflare; n = 5 flare). All P values in C are greater than 0.05 as calculated by unpaired t test. See also Supplemental Figures 2 and 3.
Figure 5
Figure 5. Functional HBV-specific T cells are enriched in the PD-1+ T cell fraction.
(AC) mRNA expression of immune-regulatory genes was analyzed by NanoString in CD4+ and CD8+ T cells sorted from the peripheral blood of patients that flared (n = 7) or did not flare (n = 12) upon therapy discontinuation. The differentially expressed genes (>1.5-fold difference, P < 0.05) in CD4+ and CD8+ T cells from the 2 patient groups are shown by heatmap (A). PD1 expression by CD8+ T cells is also shown as normalized NanoString counts (B). Statistics are calculated by nonparametric, 2-tailed Mann-Whitney U test. The expression of immune-regulatory markers by CD4+ and CD8+ T cells from patients that did not flare or from those that flared upon therapy withdrawal was evaluated by CyTOF (C). Relative expression of each marker is plotted as z-score calculated for each experiment (n = 12 nonflare; n = 5 flare; see Methods). All differences are not statistically significant after correcting for multiple comparisons with Holm-Šidák or Šidák-Bonferroni method. (D) Pearson correlation of PD1 mRNA expression in total CD8+ T cells and frequencies of HBV-specific T cells. (EF) PD-1+ and PD-1 T cells were sorted ex vivo from peripheral blood of patients (n = 7: n = 6 nonflare, n = 1 flare) and expanded in the presence of autologous antigen-presenting cells pulsed with HBV peptides. Expanded PD-1+ and PD-1 cells were tested for recognition of HBV peptides by IFN-γ. Data are summarized for 7 patients (E) and are shown for single patients (F). The ability of PD-1+ CD8+ T cells to produce cytokines and effector molecules following polyclonal stimulation was assessed by CyTOF in PBMCs of patients from the 2 groups (n = 12 nonflare; n = 5 flare) (G). Statistics were calculated using the nonparametric, 2-tailed Mann-Whitney U test except for in E, where the nonparametric Wilcoxon matched-pairs signed rank test was used. *P ≤ 0.05; **P ≤ 0.01.
Figure 6
Figure 6. Validation in an Asian patient cohort (cohort 2) of the increased frequencies of circulating HBV core and polymerase-specific T cells in chronic HBV patients undergoing NUC therapy that did not flare upon therapy discontinuation.
HBV-specific T cells were assessed after 10-day expansion of patient PBMCs with a panel of overlapping 15-mer peptides spanning the HBV proteome, followed by IFN-γ ELISPOT in the presence of peptides pooled according to the single proteins (x, core, env, and pol). Results are expressed as spot-forming cells relative to 105 PBMCs. (A) Total HBV-specific T cell responses during NUC therapy (n = 26). (B) Deconvolution of the HBV-specific T cell response from A into single HBV proteins. (C) PD-1+ and PD-1 T cells were sorted ex vivo from peripheral blood of patients (n = 6) and expanded in the presence of autologous antigen-presenting cells pulsed with HBV core and polymerase peptides. Expanded PD-1+ and PD-1 cells were tested for recognition of HBV peptides by IFN-γ. Data are summarized for 6 patients (C) and are shown for the single patients (D). (EG) Pooled data from cohorts 1 and 2 show IFN-γ production of ex vivo–sorted PD-1+ and PD-1 cells after in vitro expansion (n = 13; E), total HBV-specific T cell responses during therapy (n = 43; F), and the HBV-specific T cell response to single HBV proteins (G). The dotted line in G marks the threshold of HBV-specific T cell response associated with absence of hepatic flares upon therapy withdrawal. Circle and triangle symbols in F and G represent patients from cohort 1 and 2, respectively. Statistics were calculated using the nonparametric, 2-tailed Mann-Whitney U test except for in C and E, where the nonparametric Wilcoxon matched-pairs signed rank test was used. *P ≤ 0.05; **P ≤ 0.01; ***P ≤ 0.001; ****P ≤ 0.0001.

Comment in

References

    1. Stanaway JD, et al. The global burden of viral hepatitis from 1990 to 2013: findings from the Global Burden of Disease Study 2013. Lancet. 2016;388(10049):1081–1088. doi: 10.1016/S0140-6736(16)30579-7. - DOI - PMC - PubMed
    1. Seeger C, Mason WS. Hepatitis B virus biology. Microbiol Mol Biol Rev. 2000;64(1):51–68. doi: 10.1128/MMBR.64.1.51-68.2000. - DOI - PMC - PubMed
    1. Höner Zu Siederdissen C, et al. Viral and host responses after stopping long-term nucleos (t)ide analogue therapy in HBeAg-negative chronic hepatitis B. J Infect Dis. 2016;214(10):1492–1497. doi: 10.1093/infdis/jiw412. - DOI - PubMed
    1. Gill US, et al. Assessment of bone mineral density in tenofovir-treated patients with chronic hepatitis B: can the fracture risk assessment tool identify those at greatest risk? J Infect Dis. 2015;211(3):374–382. doi: 10.1093/infdis/jiu471. - DOI - PubMed
    1. Sheldon J, et al. Selection of hepatitis B virus (HBV) vaccine escape mutants in HBV-infected and HBV/HIV-coinfected patients failing antiretroviral drugs with anti-HBV activity. J Acquir Immune Defic Syndr. 2007;46(3):279–282. doi: 10.1097/QAI.0b013e318154bd89. - DOI - PubMed

Publication types

MeSH terms