. 2018 Jan 8;14(1):e1006769.
doi: 10.1371/journal.ppat.1006769. eCollection 2018 Jan.

Distinct temporal roles for the promyelocytic leukaemia (PML) protein in the sequential regulation of intracellular host immunity to HSV-1 infection

Affiliations

Distinct temporal roles for the promyelocytic leukaemia (PML) protein in the sequential regulation of intracellular host immunity to HSV-1 infection

Thamir Alandijany et al. PLoS Pathog. .

Erratum in

Abstract

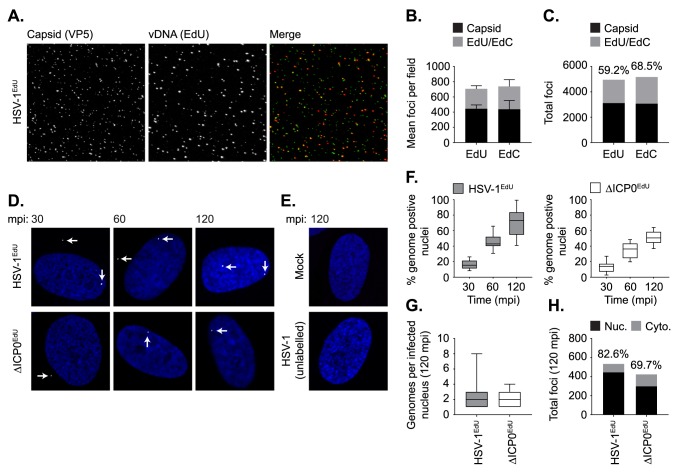
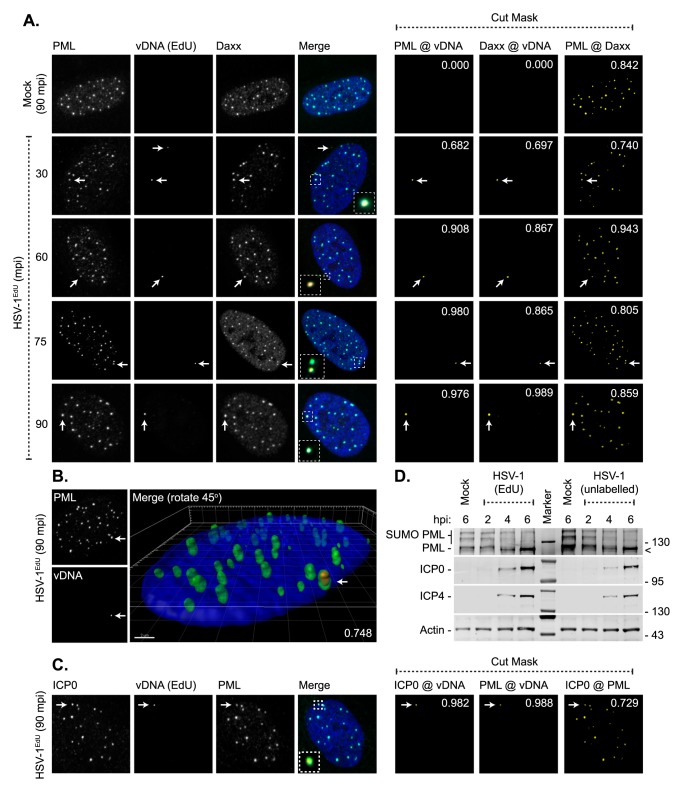
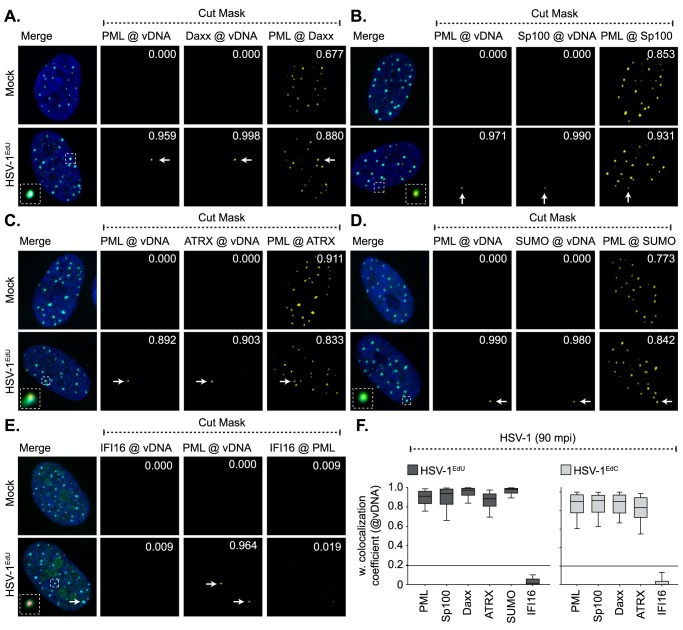
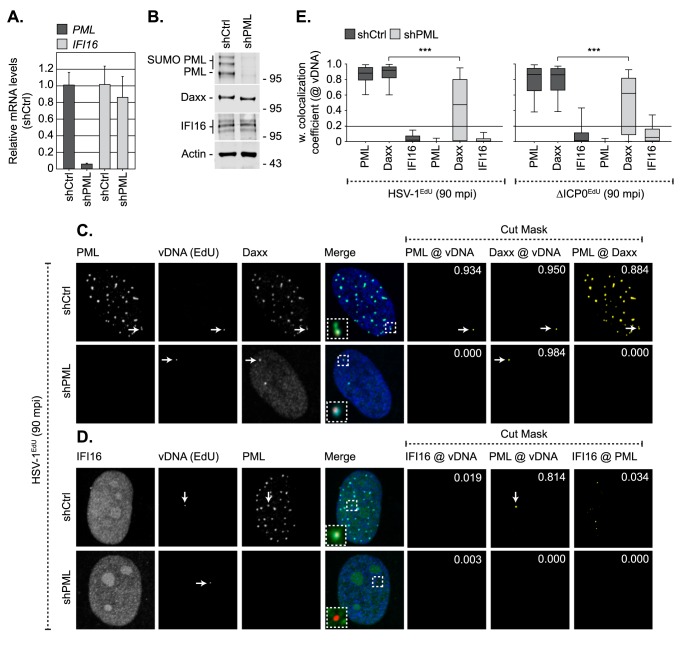
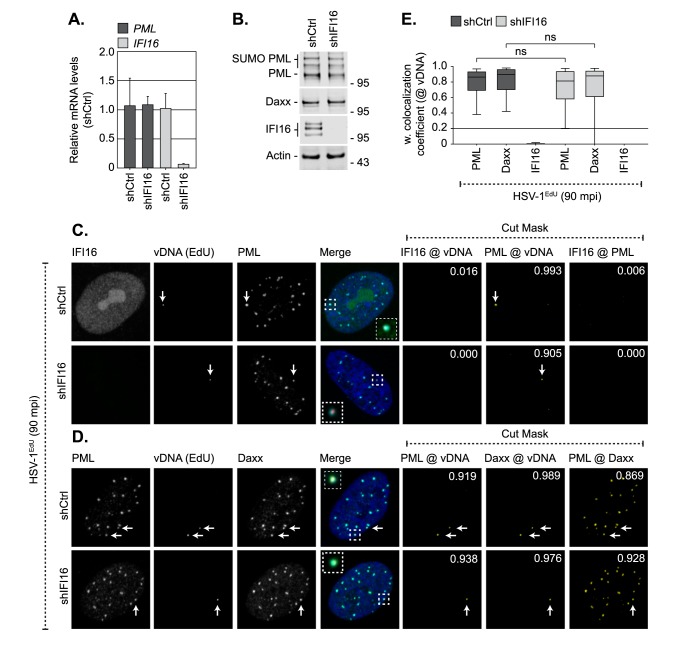
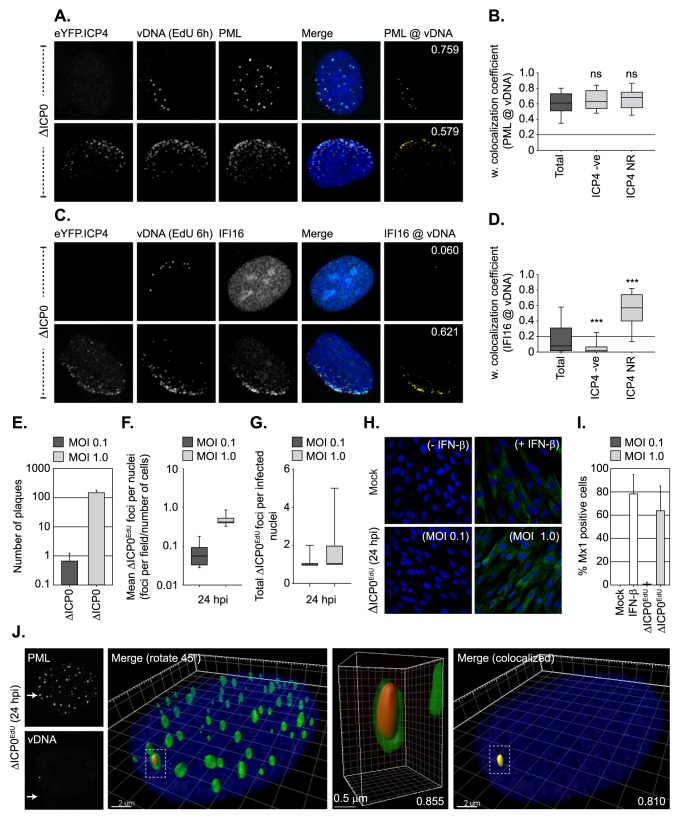
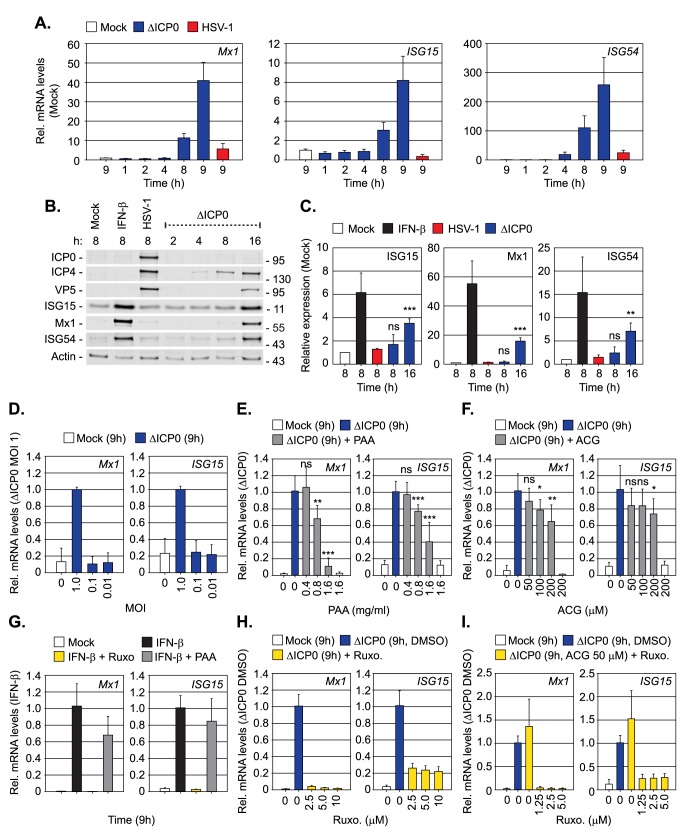
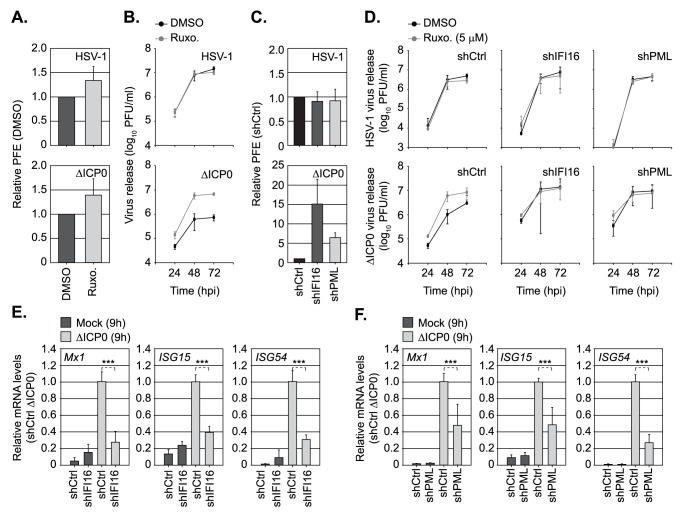
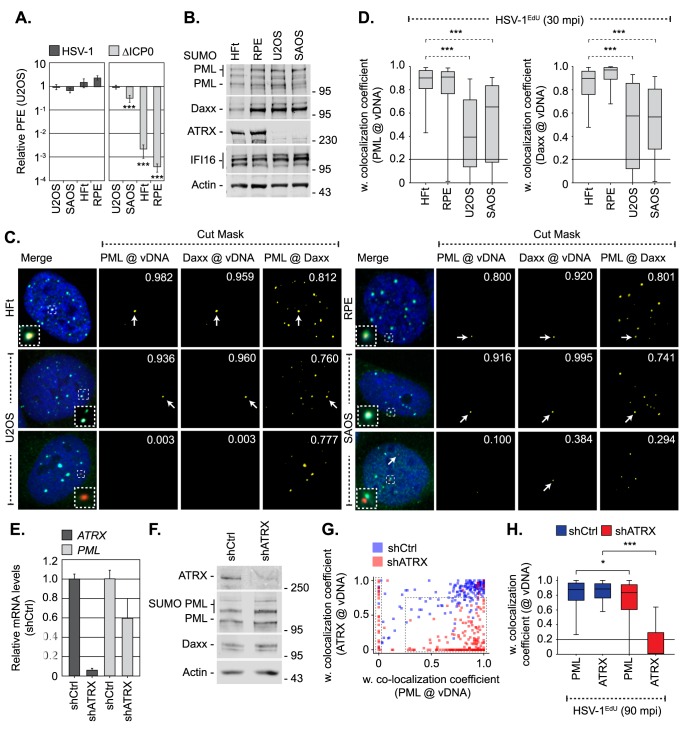
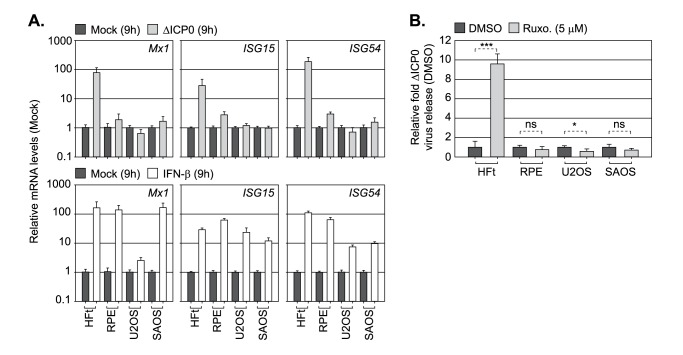
Detection of viral nucleic acids plays a critical role in the induction of intracellular host immune defences. However, the temporal recruitment of immune regulators to infecting viral genomes remains poorly defined due to the technical difficulties associated with low genome copy-number detection. Here we utilize 5-Ethynyl-2'-deoxyuridine (EdU) labelling of herpes simplex virus 1 (HSV-1) DNA in combination with click chemistry to examine the sequential recruitment of host immune regulators to infecting viral genomes under low multiplicity of infection conditions. Following viral genome entry into the nucleus, PML-nuclear bodies (PML-NBs) rapidly entrapped viral DNA (vDNA) leading to a block in viral replication in the absence of the viral PML-NB antagonist ICP0. This pre-existing intrinsic host defence to infection occurred independently of the vDNA pathogen sensor IFI16 (Interferon Gamma Inducible Protein 16) and the induction of interferon stimulated gene (ISG) expression, demonstrating that vDNA entry into the nucleus alone is not sufficient to induce a robust innate immune response. Saturation of this pre-existing intrinsic host defence during HSV-1 ICP0-null mutant infection led to the stable recruitment of PML and IFI16 into vDNA complexes associated with ICP4, and led to the induction of ISG expression. This induced innate immune response occurred in a PML-, IFI16-, and Janus-Associated Kinase (JAK)-dependent manner and was restricted by phosphonoacetic acid, demonstrating that vDNA polymerase activity is required for the robust induction of ISG expression during HSV-1 infection. Our data identifies dual roles for PML in the sequential regulation of intrinsic and innate immunity to HSV-1 infection that are dependent on viral genome delivery to the nucleus and the onset of vDNA replication, respectively. These intracellular host defences are counteracted by ICP0, which targets PML for degradation from the outset of nuclear infection to promote vDNA release from PML-NBs and the onset of HSV-1 lytic replication.


Conflict of interest statement

The authors declare no competing interests

Figures

Fig 1
Fig 1. Direct visualization of bio-orthogonally labelled HSV-1 genomes.
Quantitation of bio-orthogonally labelled vDNA in HSV-1 virions. HSV-1EdU or HSV-1EdC virions were subjected to partial denaturation with 2M GuHCl at 4°C for 60 mins to release vDNA [47]. vDNA (red) was detected by click chemistry and capsid (green) by indirect immunofluorescence staining. (A) Representative confocal images showing vDNA release and expansion from partially denatured HSV-1EdU virions following GuHCl treatment. (B,C) Stack plots showing the relative population of EdU or EdC positive vDNA labelled HSV-1 virions. n ≥ 3000 particles per population derived from 3 independent experiments. Minimum estimates for viral genome labelling efficiency are shown (%). (D,E) HFt cells were mock or HSV-1 infected with either unlabelled or EdU labelled WT (HSV-1EdU) or ICP0-null mutant HSV-1 (ΔICP0EdU) at an MOI of 3 PFU/cell. Cells were fixed and permeabilized at the indicated times minutes post-infection (mpi; post-addition of virus). vDNA was detected by click chemistry (white arrows) and nuclei stained with DAPI (blue). Representative confocal images showing the nuclear accumulation of HSV-1EdU and ΔICP0EdU genomes over time (30–120 mpi; as indicated), with genome detection specific to input EdU labelled virus. (F) Quantitation of HSV-1EdU or ΔICP0EdU genome positive nuclei over time (as in D). Boxes: 25th to 75th percentile range; black line: median; whiskers: 5th to 95th percentile range. n ≥ 300 cells per sample population derived from a minimum of 3 independent experiments. (G) Number of genomes detected within infected nuclei at 120 mpi. Boxes: 25th to 75th percentile range; black line: median; whiskers: minimum and maximum range of sample. n ≥ 200 cells per sample population derived from a minimum of 3 independent experiments. (H) Nuclear (Nuc.) and cytoplasmic (Cyto.) distribution of genome foci detected at 120 mpi. n ≥ 300 cells per sample population derived from a minimum of 3 independent experiments. Percentage of total genomes detected within the nucleus is shown (%).
Fig 2
Fig 2. PML-NBs stably entrap vDNA upon nuclear entry.
HFt cells were mock or HSV-1EdU infected at an MOI of 3 PFU/cell. Cells were fixed and permeabilized at the indicated times (mpi; post-addition of virus). vDNA, or PML-NB host factors and ICP0, were detected by click chemistry and indirect immunofluorescence staining, respectively. (A) Localization of PML (green) and Daxx (cyan) to HSV-1 vDNA (red, white arrows) at 30–90 mpi (as indicated). Insets show magnified regions of interest (dashed boxes) highlighting PML-NB colocalization with vDNA. Cut mask (yellow) highlights regions of colocalization between PML, Daxx, and vDNA (as indicated). Weighted colocalization coefficients are shown. (B) 3D reconstruction of high-resolution confocal Z-series images showing PML (green) entrapment of vDNA (red, white arrow) at 90 mpi. Single channel maximum intensity projections (left-hand panels) and 3D rendered image (right-hand panel). Pearson coefficient for PML-vDNA colocalization is shown. Scale bar 2 μm. (C) Nuclear localization of ICP0 (green) to vDNA (red, white arrow) and PML (cyan) in HSV-1EdU infected cells at 90 mpi. Cut mask (yellow) highlights regions of colocalization between ICP0, PML, and vDNA (as indicated). Weighted colocalization coefficients are shown. Nuclei stained with DAPI (blue). (D) EdU labelling of viral genomes does not affect the initiation of infection. HFt cells were mock or HSV-1 infected with unlabelled (HSV-1) or EdU labelled (HSV-1EdU) HSV-1 at an MOI of 3 PFU/cell. Whole cell lysates were collected at the indicated times (hours post-infection; hpi) for western blot analysis to monitor the rate of PML degradation and the accumulation of the viral immediate early (IE) gene products (ICP0, ICP4). Actin is shown as a loading control. Molecular mass markers are shown, < denotes the detection of a non-specific background band.
Fig 3
Fig 3. Core PML-NB proteins, but not IFI16, associate with infecting HSV-1 genomes.
HFt cells were mock or infected with either HSV-1EdU or HSV-1EdC at an MOI of 3 PFU/cell. Cells were fixed and permeabilized at the indicated times (mpi; post-addition of virus). vDNA and PML-NB host factors were detected by click chemistry and indirect immunofluorescence staining, respectively. (A-E) Localization of PML (green), and either Daxx, Sp100, ATRX, SUMO2/3 (SUMO), or IFI16 (cyan; as indicated) to infecting HSV-1EdU vDNA (red, white arrows). Insets show magnified regions of interest (dashed boxes) highlighting host protein localization with vDNA. Cut mask (yellow) highlights regions of colocalization between host proteins and vDNA (as indicated). Weighted colocalization coefficients are shown. Individual channel images shown in S3 Fig. Nuclei were stained with DAPI (blue). (F) Quantitation of host protein recruitment to infecting viral genomes labelled with EdU (as shown in A-E) or EdC. Boxes: 25th to 75th percentile range; black line: median weighted (w.) colocalization coefficient; whiskers: 5th to 95th percentile range. Solid line indicates coincident threshold level (weighted colocalization coefficients < 0.2). n ≥ 50 vDNA foci per sample population from a minimum of three independent infections.
Fig 4
Fig 4. Depletion of PML does not enhance the recruitment of IFI16 to infecting viral genomes.
HFt cells were stably transduced with lentiviruses expressing PML-targeting (shPML) or non-targeting control (shCtrl) shRNAs. (A) qRT-PCR quantitation of PML or IFI16 mRNA levels in HFt shCtrl and shPML cells. Mean (RQ) and standard deviation (RQmin/max) shown and expressed relative to HFt shCtrl cells (1). (B) Western blot analysis of the expression levels of PML, Daxx and IFI16 in whole cell lysates derived from HFt shCtrl and shPML cells. Actin is shown as a loading control. Molecular mass markers are shown. (C, D) Localization of PML (green), and either Daxx or IFI16 (cyan; as indicated), to infecting HSV-1EdU vDNA (red, white arrows) in HFt shCtrl and shPML cells at 90 mpi (post-addition of virus). Cells were infected with HSV-1EdU or ΔICP0EdU at an MOI of 3 PFU/cell. Insets show magnified regions of interest (dashed boxes) highlighting host protein localization with vDNA. Cut mask (yellow) highlights regions of colocalization between PML, IFI16, Daxx, and vDNA (as indicated). Weighted colocalization coefficients are shown. Nuclei were stained with DAPI (blue). Images for ΔICP0EdU infected cells are shown in S6 Fig. (E) Quantitation of host protein recruitment to infecting viral genomes (as shown in C, D, S6). Boxes: 25th to 75th percentile range; black line: median weighted (w.) colocalization coefficient; whiskers: 5th to 95th percentile range. Solid line indicates coincident threshold level (weighted colocalization coefficients < 0.2). n ≥ 50 vDNA foci per sample population from a minimum of four independent infections. *** P < 0.001, Mann-Whitney U-test.
Fig 5
Fig 5. IFI16 does not influence the recruitment of PML or Daxx to infecting viral genomes.
HFt cells were stably transduced with lentiviruses expressing IFI16-targeting (shIFI16) or non-targeting control (shCtrl) shRNAs. (A) qRT-PCR quantitation of IFI16 or PML mRNA levels in HFt shCtrl and shIFI16 cells. Mean (RQ) and standard deviation (RQmin/max) shown and expressed relative to HFt shCtrl cells (1). (B) Western blot analysis of the expression levels of IFI16, PML, and Daxx in whole cell lysates from HFt shCtrl and shIFI16 cells. Actin is shown as a loading control. Molecular mass markers are shown. (C, D) Localization of PML (green), and either IFI16 or Daxx (cyan; as indicated) to infecting HSV-1EdU vDNA (red, white arrows) in HFt shCtrl and shIFI16 cells at 90 mpi (post-addition of virus). Cells were infected with HSV-1EdU at an MOI of 3 PFU/cell. Insets show magnified regions of interest (dashed boxes) highlighting host protein localization with vDNA. Cut mask (yellow) highlights regions of colocalization between IFI16, PML, Daxx, and vDNA (as indicated). Weighted colocalization coefficients are shown. Nuclei were stained with DAPI (blue). (E) Quantitation of host protein recruitment to infecting viral genomes (as shown in C, D). Boxes: 25th to 75th percentile range; black line: median weighted (w.) colocalization coefficient; whiskers: 5th to 95th percentile range. Solid line indicates coincident threshold level (weighted colocalization coefficients < 0.2). n ≥ 50 vDNA foci per sample population from a minimum of four independent infections. ns (not significant), Mann-Whitney U-test.
Fig 6
Fig 6. Nuclear entry of vDNA is not sufficient to induce robust Mx1 ISG expression.
(A-D) Recruitment of PML, IFI16, and eYFP.ICP4 to ΔICP0 infecting viral genomes in an asynchronous plaque-edge recruitment assay (as described in [10]). HFt cells were infected with ΔICP0 expressing eYFP.ICP4 under conditions (MOI 2 PFU/cell) that enable plaque-formation to occur. Cells were pulse labelled at 24 hpi with 1 μM EdU for 6h to label vDNA. (A, C) Localization of eYFP.ICP4 (green), PML or IFI16 (cyan; as indicated) to vDNA (red) in newly infected cells on the periphery of a developing plaque-edge. Cut mask (yellow) highlights regions of colocalization between either PML or IFI16 and vDNA (as indicated). Weighted (w.) colocalization coefficients shown. (B, D) Quantitation of PML and IFI16 recruitment to infecting vDNA in the presence or absence of eYFP.ICP4 at the nuclear rim (ICP4 NR and ICP4 -ve, respectively; as shown in A and C). Boxes: 25th to 75th percentile range; black line: median weighted (w.) colocalization coefficient; whiskers: 5th to 95th percentile range. Solid line indicates coincident threshold level (weighted colocalization coefficients < 0.2). n = 100 plaque-edge cells +ve for vDNA per PML or IFI16 sample population from 4 independent infections. *** P < 0.001, ns (not significant), Mann-Whitney U-test. (E-I) Mx1 expression is only induced under infection conditions that permit ΔICP0 plaque formation. (E) Number of plaques detected at 24 hpi following ΔICP0 infection of HFt cells at an input MOI of 0.1 or 1 PFU/cell (as indicated). n = 3, means and standard deviations shown. (F) Quantitation of ΔICP0EdU nuclear genomes in HFt cells (as infected in E). Boxes: 25th to 75th percentile range; black line: median; whiskers: 5th to 95th percentile range. n ≥ 250 cells derived from 3 independent experiments per condition. (G) Frequency of ΔICP0EdU genomes detected within infected cell nuclei (as described in E/F). Boxes: 25th to 75th percentile range; black line: median; whiskers: minimum and maximum range of sample. (H) HFt cells were mock treated, IFN-β stimulated (100 IU/ml), or infected with ΔICP0 at a MOI of 0.1 or 1 PFU/cell. Samples were fixed at 24 post-treatment and analysed by confocal microscopy for Mx1 (green) ISG expression. (I) Quantitation of Mx1 positive cells (as shown in H). n ≥ 250 cells derived from 3 independent experiments per condition. (J) PML-NB entrapment of vDNA is maintained under low MOI conditions (0.1 PFU/cell) that restrict ΔICP0EdU replication and plaque formation at 24 hpi. 3D reconstruction of high-resolution Z-series confocal images showing PML entrapment of ΔICP0EdU vDNA. Single channel maximum intensity projection images (left), 3D rendered images of the whole nucleus showing PML (green) and vDNA (red), with a single vDNA focus entrapped by PML (dashed box; right). Scale bar 2 μm. Enlargement of PML entrapped vDNA (centre-right). Scale bar 0.5 μm. Cut mask (yellow) highlights colocalization between PML and vDNA (far-right). Pearson coefficient for PML-vDNA colocalization shown. Nuclei were stained with DAPI (blue).
Fig 7
Fig 7. Inhibition of vDNA replication impairs the induction of innate immunity during HSV-1 infection.
HFt cells were mock, WT, or ΔICP0 HSV-1 infected at an MOI of 1 PFU/cell (unless stated otherwise). Samples were collected at the indicated times (hours; h) post-treatment or infection. (A) Relative mRNA levels of Mx1, ISG15, and ISG54 during WT or ΔICP0 HSV-1 infection. n = 2, means (RQ) and standard deviations (RQmin/max) are shown and expressed relative to mock (1). (B) Western blot analysis of the expression levels of ISGs (ISG15, Mx1, ISG54), viral proteins (ICP0, ICP4, VP5), and actin (as a loading control), from whole cell lysates of mock, IFN-β stimulated (100 IU/ml), WT or ΔICP0 HSV-1 infected HFt cells at the indicated times. Molecular mass markers are shown. (C) Quantitation of ISG expression levels (as shown in B). n = 3, means and standard deviations shown expressed relative to mock (1). ** P < 0.01, *** P < 0.001, ns (not significant); two-tailed t-test. (D) Relative mRNA levels of Mx1 and ISG15 in mock or ΔICP0 infected HFt cells (MOI of 0.01 to 1 PFU/cell, as indicated). n = 3, means (RQ) and standard deviations (RQmin/max) are shown and expressed relative to ΔICP0 MOI 1 (1). (E, F) Relative mRNA levels of Mx1 and ISG15 in mock or ΔICP0 infected HFt cells in the presence of phosphonoacetic acid (PAA) or acycloguanosine (ACG) at the indicated concentrations. n = 3, means (RQ) and standard deviations (RQmin/max) are shown and expressed relative to ΔICP0 (1). * P < 0.05, ** P < 0.01, *** P < 0.001, ns (not significant); two-tailed t-test. (G) Relative mRNA levels of Mx1 and ISG15 in mock or IFN-β stimulated (100 IU/ml) HFt cells co-incubated in the presence Ruxolitinib (5 μM; Ruxo) or PAA (1.6 mg/ml), as indicated. n = 2, means (RQ) and standard deviations (RQmin/max) are shown and expressed relative to IFN-β treatment (1). (H, I) Relative Mx1 and ISG15 mRNA levels in mock or ΔICP0 infected HFt cells treated with Ruxo (2.5–10 μM, as indicated) or Ruxo (5 μM) and ACG (50 μM), as indicated. n = 2, means (RQ) and standard deviations (RQmin/max) are shown and expressed relative to ΔICP0 infection (1).
Fig 8
Fig 8. Dual roles for PML and IFI16 in the regulation of intrinsic and innate immunity to HSV-1 infection.
(A) HFt cells were DMSO or Ruxolitinib (5μM; Ruxo) treated and infected with serial dilutions of WT or ΔICP0 HSV-1 for 24 h prior to immuno-staining for plaque formation. Plaque counts expressed relative to control cell monolayers (# of plaques treated / # of plaques DMSO control) at equivalent serial dilutions of virus and presented as relative plaque formation efficiency (PFE). n ≥ 3, means and standard deviations shown. (B) HFt cells were DMSO or Ruxo treated and infected with WT (MOI 0.001 PFU/cell) or ΔICP0 (MOI 1 PFU/cell) HSV-1. Cell released virus (CRV) was harvested at the indicated times (hpi) and CRV titres determined on U2OS cells. n = 3, means and standard deviations shown. (C) Stably transduced HFt cells expressing non-targeting control (shCtrl), or targeting IFI16 (shIFI16) or PML (shPML) shRNAs, were infected with WT or ΔICP0 HSV-1 (as in A). Plaque counts expressed relative to infected shCtrl cell monolayer plaque counts (1) and presented as relative PFE. n = 3, means and standard deviations shown. (D) shCtrl, shIFI16, or shPML HFt cells were treated with DMSO or Ruxo and infected with either WT or ΔICP0 HSV-1 (as in B). CRV was collected at the indicated times (hpi) and titres determined on U2OS cells. n = 3, means and standard deviations shown. (E, F) Relative Mx1, ISG15, and ISG54 mRNA levels in HFt shCtrl, shIFI16, or shPML cells mock or ΔICP0 infected (MOI 1 PFU/cell) at 9 hpi. n = 3, means (RQ) and standard deviations (RQmin/max) shown and expressed relative to ΔICP0 infected shCtrl (1). *** P < 0.001; two-tailed t-test.
Fig 9
Fig 9. PML-NB entrapment of infecting HSV-1 vDNA occurs in a cell type and ATRX dependent manner.
(A) U2OS, SAOS, RPE, and HFt cells were infected with serial dilutions of WT or ΔICP0 HSV-1 for 24 h. Plaque counts expressed relative to U2OS, a cell line permissive to ΔICP0 replication [34], (# of plaques / # of plaques U2OS control) at equivalent serial dilutions of virus and presented as relative plaque formation efficiency (PFE). n ≥ 3, means and standard deviations shown. (B) Western blot analysis of the relative expression levels of PML, Daxx, ATRX, and IFI16 in whole cell lysates derived from HFt, RPE, U2OS and SAOS cells. Actin is shown as a loading control. Molecular mass markers are indicated. (C) Localization of PML (green) and Daxx (cyan) to HSV-1EdU vDNA (red, white arrows) in restrictive (HFt, RPE) and permissive (U2OS, SAOS) cell types at 30 mpi (post-addition of virus; MOI of 3 PFU/cell). Insets show magnified regions of interest (dashed boxes) highlighting host protein localization with vDNA. Cut mask (yellow) highlights regions of colocalization between PML, Daxx, and vDNA (as indicated). Weighted (w.) colocalization coefficients shown. (D) Quantitation of PML and Daxx recruitment to infecting vDNA in restrictive (HFt, RPE) and permissive (U2OS, SAOS) cell lines (as shown in C). Boxes: 25th to 75th percentile range; black line: median weighted (w.) colocalization coefficient; whiskers: 5th to 95th percentile range. Solid line indicates coincident threshold level (weighted colocalization coefficients < 0.2). n ≥ 50 vDNA foci per sample population from 4 independent infections. (E-H) ATRX is required for efficient PML-NB entrapment of vDNA. HFt cells were stably transduced with lentiviruses expressing ATRX-targeting (shATRX) or non-targeting control (shCtrl) shRNAs. (E) qRT-PCR quantitation of ATRX or PML mRNA levels in HFt shCtrl and shATRX cells. Mean (RQ) and standard deviation (RQmin/max) shown and expressed relative to HFt shCtrl cells (1). (F) Western blot analysis of the relative expression levels of ATRX, PML, and Daxx in whole cell lysates from HFt shCtrl and shATRX cells. Actin is shown as a loading control. Molecular mass markers are shown. (G) Scatter plot showing paired w. colocalization coefficients of ATRX and PML to individual nuclear infecting viral genomes in shCtrl (blue) and shATRX (red) cells infected with HSV-1EdU at an MOI of 3 PFU/cell at 90 mpi (post-addition of virus). n ≥ 200 genomes per sample population. Dotted boxes highlight genome populations identified to have altered distribution of colocalization frequency in comparison to infected shCtrl cells. (H) Quantitation of PML and ATRX recruitment to infecting viral genomes (as shown in G). Boxes: 25th to 75th percentile range; black line: median weighted (w.) colocalization coefficient; whiskers: 5th to 95th percentile range. Solid line indicates coincident threshold level (weighted colocalization coefficients < 0.2). * P < 0.05, *** P < 0.001; Mann-Whitney U-test.
Fig 10
Fig 10. PML-NB entrapment of vDNA does not lead to the induction of innate immunity.
(A) Relative Mx1, ISG15, and ISG54 mRNA levels in cell lines restrictive (HFt, RPE) or permissive (U2OS, SAOS) to HSV-1 ICP0-null mutant (ΔICP0) infection. Cells were mock treated, IFN-β (100 IU/ml) stimulated, or infected with ΔICP0 at an MOI of 1 PFU/cell for 9 h. n = 3, means (RQ) and standard deviations (RQmin/max) are shown and expressed relative to mock for each cell line (1). (B) Restrictive (HFt, RPE) or permissive (U2OS, SAOS) cell lines were infected with ΔICP0 at an MOI of 1 PFU/cell and treated with either DMSO or Ruxolitinib (Ruxo, 5μM). CRV was harvested at 48 hpi and titres determined on U2OS cells. n = 3, means and standard deviations shown and expressed as relative fold-change to DMSO titres (1) for each cell line. * P < 0.05, *** P < 0.001, ns (not significant); two-tailed t-test.

References

    1. Komatsu T, Nagata K, Wodrich H. The Role of Nuclear Antiviral Factors against Invading DNA Viruses: The Immediate Fate of Incoming Viral Genomes. Viruses. 2016;8(10). doi: 10.3390/v8100290 ; PubMed Central PMCID: PMCPMC5086622. - DOI - PMC - PubMed
    1. Yan N, Chen ZJ. Intrinsic antiviral immunity. Nat Immunol. 2012;13(3):214–22. doi: 10.1038/ni.2229 ; PubMed Central PMCID: PMCPMC3549670. - DOI - PMC - PubMed
    1. Blanco-Melo D, Venkatesh S, Bieniasz PD. Intrinsic cellular defenses against human immunodeficiency viruses. Immunity. 2012;37(3):399–411. Epub 2012/09/25. doi: 10.1016/j.immuni.2012.08.013 [pii]. . - DOI - PMC - PubMed
    1. Diner BA, Lum KK, Cristea IM. The emerging role of nuclear viral DNA sensors. J Biol Chem. 2015;290(44):26412–21. doi: 10.1074/jbc.R115.652289 ; PubMed Central PMCID: PMCPMC4646299. - DOI - PMC - PubMed
    1. Knipe DM. Nuclear sensing of viral DNA, epigenetic regulation of herpes simplex virus infection, and innate immunity. Virology. 2015;479–480:153–9. doi: 10.1016/j.virol.2015.02.009 ; PubMed Central PMCID: PMCPMC4424148. - DOI - PMC - PubMed

Publication types

MeSH terms