

Multimorbidity, Mortality, and Long-Term Physical Functioning in 3 Prospective Cohorts of Community-Dwelling Adults
- PMID: 29309518
- PMCID: PMC5860284
- DOI: 10.1093/aje/kwx198
Multimorbidity, Mortality, and Long-Term Physical Functioning in 3 Prospective Cohorts of Community-Dwelling Adults
Abstract
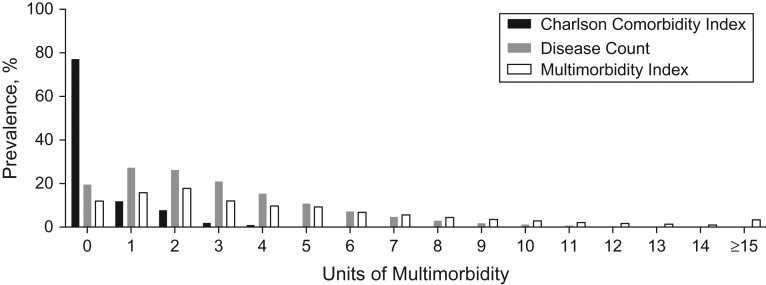
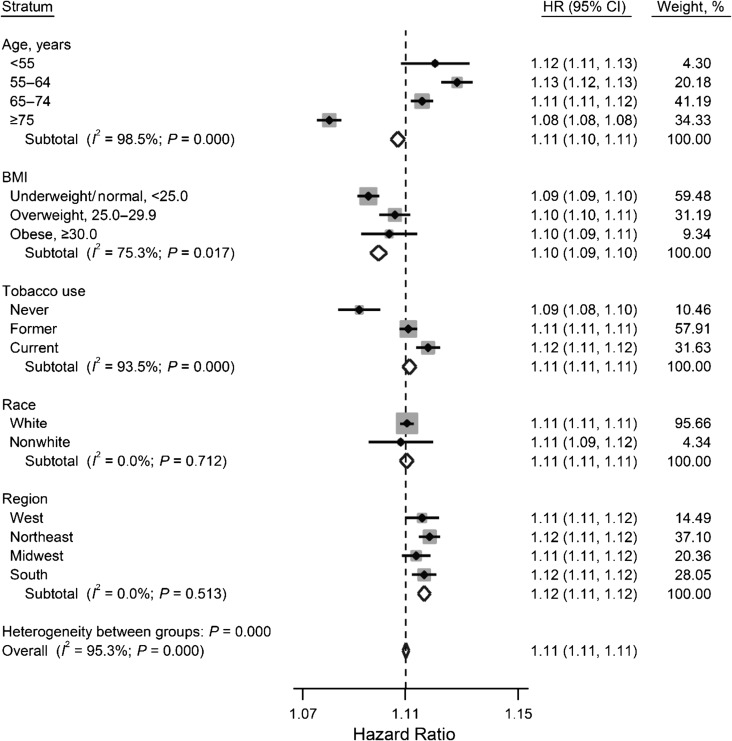
Multimorbidity is prevalent, but its optimal quantification and associations with mortality rate and physical functioning in young through older adults are uncertain. We used data collected using the Short Form-36 in the Nurses' Health Study (enrollment started in 1976), Nurses' Health Study II (begun in 1989), and Health Professionals Follow-up Study (begun in 1986) to identify associations of a multimorbidity-weighted index (MWI) and common alternative indices with mortality and future physical functioning. We used Cox proportional hazard ratios to determine incident 10-year mortality and general linear models to obtain coefficients for the associations of MWI with 4- and 8-year physical functioning. At baseline, mean values for the 219,950 participants were 55.0 (standard deviation, 3.7) years for age; 3.8 (range, 0-51) for MWI; 2.7 (range, 0-23) for disease count, and 0.43 (range, 0-13) for Charlson Comorbidity Index (CCI). During follow-up, 23,709 deaths (10.8%) occurred. CCI, MWI, and disease count were 0 for 77%, 12%, and 19% of participants, respectively. When comparing persons in the highest quartiles with those in the lowest, the hazard ratios for mortality were 6.04 (95% confidence interval (CI): 6.00, 6.09; P for trend < 0.0001) for the MWI, 4.86 (95% CI: 4.81, 4.91; P for trend < 0.0001) for disease count, and 3.29 (95% CI: 3.26, 3.32; P for trend < 0.0001) for the CCI. For future physical functioning, MWI had the best model fit and explained the greatest variance. Multimorbidity has important associations with future physical functioning and mortality that are easily captured with a readily measured index.
Keywords: Charlson Comorbidity Index; Short Form-36; comorbidity; mortality; multimorbidity; multiple chronic conditions; physical functioning; simple disease count.
© The Author(s) 2017. Published by Oxford University Press on behalf of the Johns Hopkins Bloomberg School of Public Health. All rights reserved. For permissions, please e-mail: journals.permissions@oup.com.
Figures

References
-
- Ornstein SM, Nietert PJ, Jenkins RG, et al. The prevalence of chronic diseases and multimorbidity in primary care practice: a PPRNet report. J Am Board Fam Med. 2013;26(5):518–524. - PubMed
-
- Radner H, Yoshida K, Mjaavatten MD, et al. Development of a multimorbidity index: impact on quality of life using a rheumatoid arthritis cohort. Semin Arthritis Rheum. 2015;45(2):167–173. - PubMed
-
- Wei MY, Kabeto MU, Langa KM, et al. Multimorbidity and physical and cognitive function in nationally-representative US adults: performance of a new multimorbidity-weighted index [published online ahead of print June 9, 2017]. J Gerontol A Biol Sci Med Sci. (doi: 10.1093/gerona/glx114). - PMC - PubMed
Publication types
MeSH terms
Grants and funding
LinkOut - more resources
Full Text Sources
Other Literature Sources
