. 2018 Mar 1;141(3):822-836.
doi: 10.1093/brain/awx354.

Spatial patterns of progressive brain volume loss after moderate-severe traumatic brain injury

Affiliations

Spatial patterns of progressive brain volume loss after moderate-severe traumatic brain injury

James H Cole et al. Brain. .

Abstract

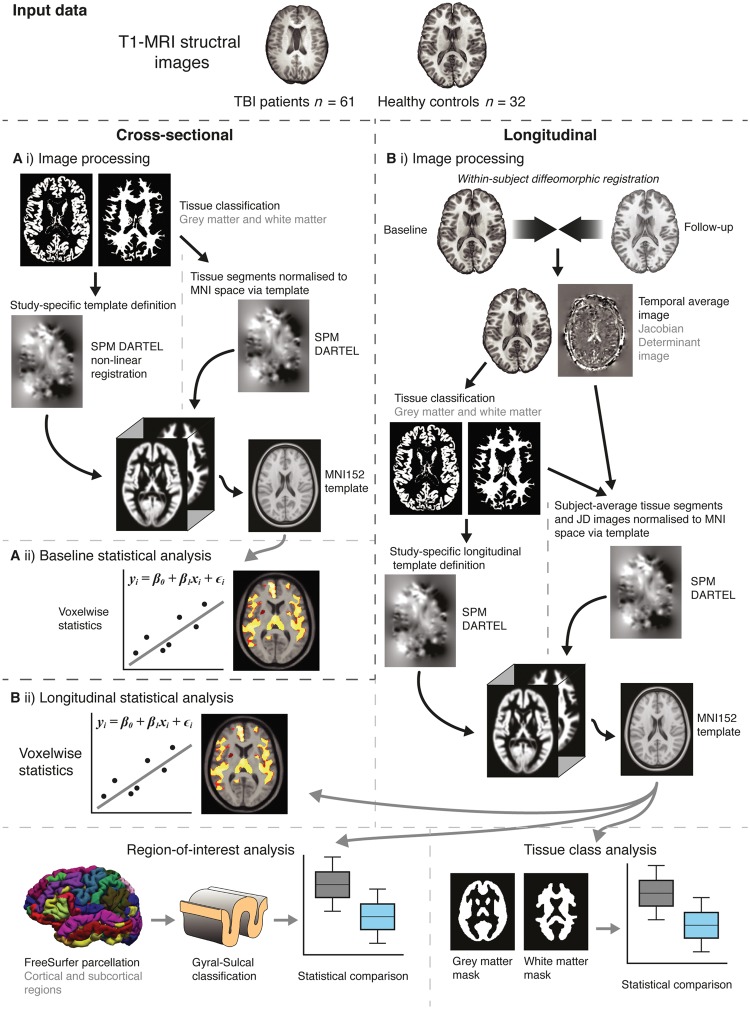
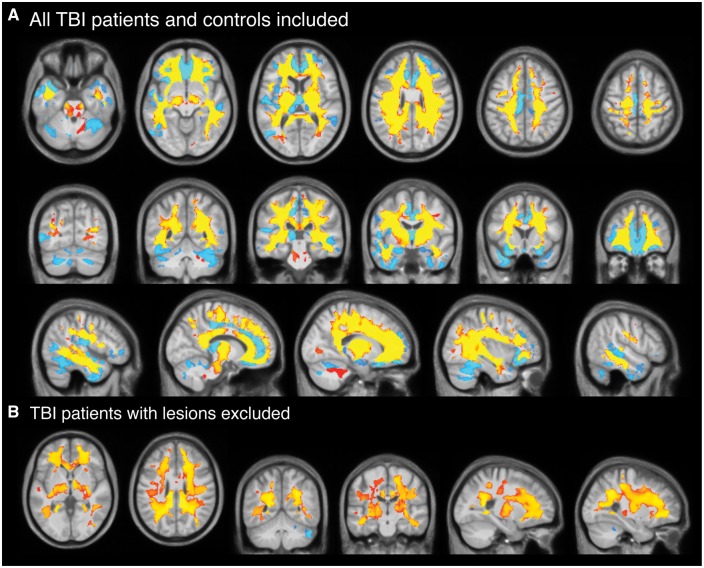
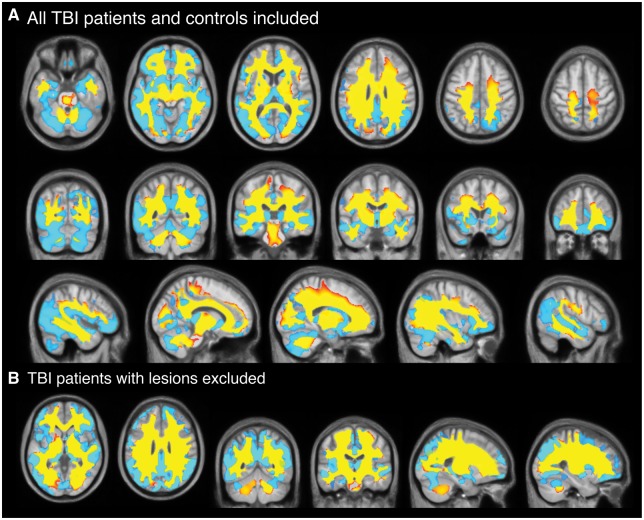
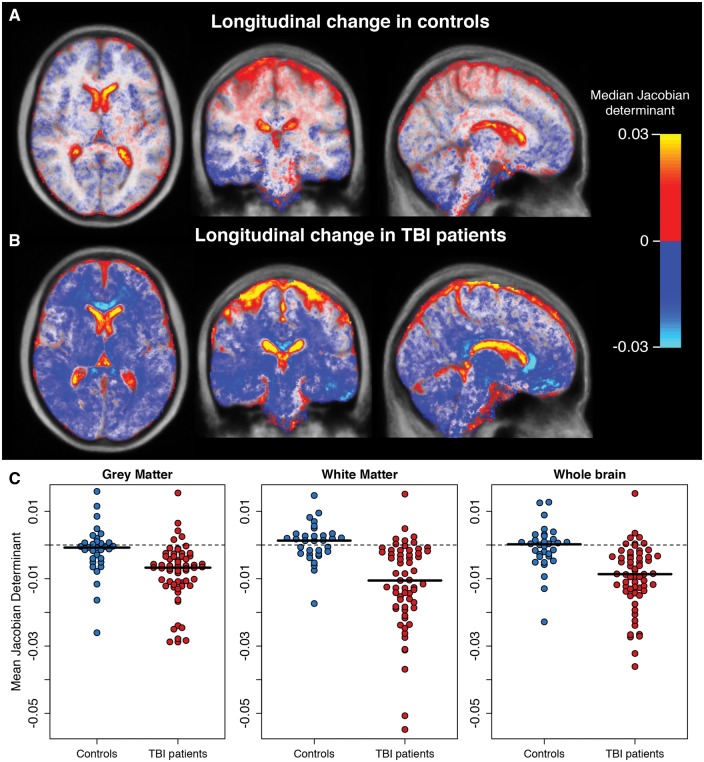
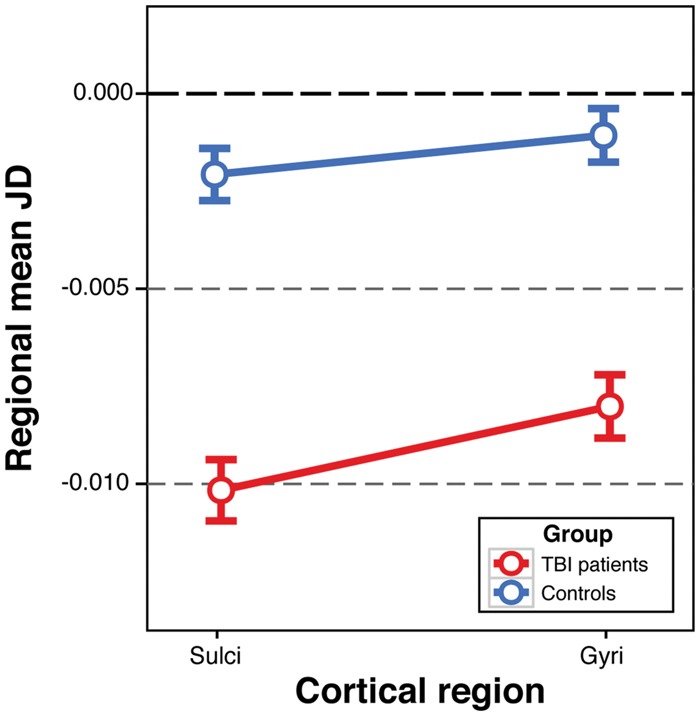
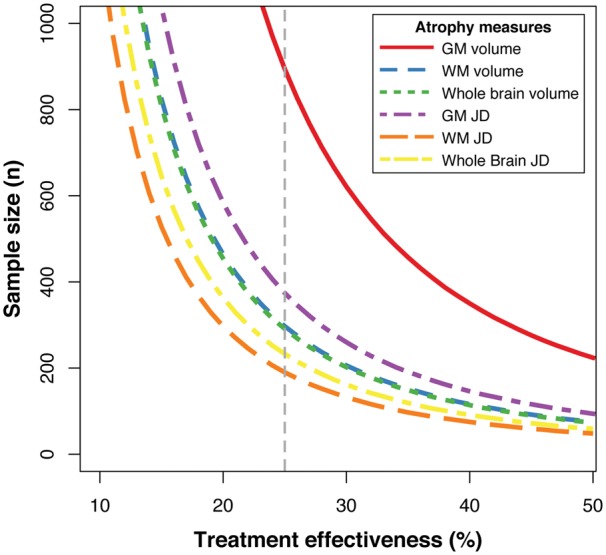
Traumatic brain injury leads to significant loss of brain volume, which continues into the chronic stage. This can be sensitively measured using volumetric analysis of MRI. Here we: (i) investigated longitudinal patterns of brain atrophy; (ii) tested whether atrophy is greatest in sulcal cortical regions; and (iii) showed how atrophy could be used to power intervention trials aimed at slowing neurodegeneration. In 61 patients with moderate-severe traumatic brain injury (mean age = 41.55 years ± 12.77) and 32 healthy controls (mean age = 34.22 years ± 10.29), cross-sectional and longitudinal (1-year follow-up) brain structure was assessed using voxel-based morphometry on T1-weighted scans. Longitudinal brain volume changes were characterized using a novel neuroimaging analysis pipeline that generates a Jacobian determinant metric, reflecting spatial warping between baseline and follow-up scans. Jacobian determinant values were summarized regionally and compared with clinical and neuropsychological measures. Patients with traumatic brain injury showed lower grey and white matter volume in multiple brain regions compared to controls at baseline. Atrophy over 1 year was pronounced following traumatic brain injury. Patients with traumatic brain injury lost a mean (± standard deviation) of 1.55% ± 2.19 of grey matter volume per year, 1.49% ± 2.20 of white matter volume or 1.51% ± 1.60 of whole brain volume. Healthy controls lost 0.55% ± 1.13 of grey matter volume and gained 0.26% ± 1.11 of white matter volume; equating to a 0.22% ± 0.83 reduction in whole brain volume. Atrophy was greatest in white matter, where the majority (84%) of regions were affected. This effect was independent of and substantially greater than that of ageing. Increased atrophy was also seen in cortical sulci compared to gyri. There was no relationship between atrophy and time since injury or age at baseline. Atrophy rates were related to memory performance at the end of the follow-up period, as well as to changes in memory performance, prior to multiple comparison correction. In conclusion, traumatic brain injury results in progressive loss of brain tissue volume, which continues for many years post-injury. Atrophy is most prominent in the white matter, but is also more pronounced in cortical sulci compared to gyri. These findings suggest the Jacobian determinant provides a method of quantifying brain atrophy following a traumatic brain injury and is informative in determining the long-term neurodegenerative effects after injury. Power calculations indicate that Jacobian determinant images are an efficient surrogate marker in clinical trials of neuroprotective therapeutics.


Figures

Figure 1
Figure 1
Overview of study methods. [A(i)] Initial processing used SPM to segment T1 images into grey and white matter probability maps. A study-specific template was defined based on 40 randomly selected participants (20 TBI patients, 20 controls), using DARTEL registration for non-linear spatial normalization. The template was then affine registered to MNI152 space. All images were then normalized (smoothed by 8 mm and modulated) to MNI152 space via the study template. [A(ii)] Statistical analysis was carried out voxelwise across the normalized grey and white matter images, using Randomise (FSL) with 5000 permutations using the threshold-free cluster enhancement, adjusting for age and intracranial volume. [B(i)] Image processing entailed an initial symmetric within-subject registration for each subject’s baseline and follow-up images. This generated a within-subject ‘temporal average’ and Jacobian determinant image, representing the voxelwise spatial expansion and contraction necessary to match baseline and follow-up images. Average images were then segmented into grey and white matter. A random selection of 20 TBI patients and 20 controls was used to define a study-specific longitudinal template with DARTEL, which was then affine registered MNI152 space. Individual average images and Jacobian determinant images were then normalized (smoothed by 8 mm and modulated) to MNI152 space via the longitudinal template. [B(ii)] Longitudinal analysis included voxelwise group comparisons using Randomise, region of interest analysis based on FreeSurfer (Destriuex) atlas regions and tissue class (i.e. grey and white matter) analysis.
Figure 2
Figure 2
Cross-sectional voxelwise comparison of brain volume in TBI patients and healthy controls. (A) Voxels showing significantly (corrected P < 0.05) lower grey matter (light blue) and white matter (yellow-red) volumes in TBI patients compared to controls at baseline, corrected for multiple comparisons using 10 000 permutations. Slices displayed are axial, coronal and sagittal and overlaid on the study template image. (B) Lower grey and white matter volumes in lesion-free TBI patients (n = 20) compared to controls at baseline, using the same contrast. TBI patients with lesions (n = 41) were excluded.
Figure 3
Figure 3
Longitudinal comparison of voxelwise volume reductions TBI patients and controls. (A) Voxels showing significantly (corrected P < 0.05) lower Jacobian determinant values in grey matter (light blue) and white matter (yellow-red) regions in TBI patients compared to controls based on longitudinal image processing and corrected for multiple comparisons using 10 000 permutations. Slices displayed are axial, coronal and sagittal and overlaid on the study template image. (B) Voxels showing significantly (corrected P < 0.05) lower Jacobian determinant values in grey and white matter regions in lesion-free TBI patients (n = 20) compared to controls at baseline, using the same contrast. TBI patients with lesions (n = 41) were excluded.
Figure 4
Figure 4
Jacobian determinant of volumetric change over 12 months in TBI patients and controls. Median Jacobian determinant images as qualitative illustration of longitudinal change over 1 year in (A) healthy controls and (B) TBI patients. Hot colours (red–yellow) indicate volumetric increases, while cool colours (blue–light blue) reflect volumetric decreases. Mean Jacobian determinant images are orthogonal slices overlaid on the longitudinal study template. (C) Grouped scatterplots representing the mean Jacobian determinant values in both healthy controls and TBI patients, when averaging across grey and white matter regions or the whole brain.
Figure 5
Figure 5
Atrophy according to cortical region classification in TBI patients and controls. Plot showing the mean and standard error of Jacobian determinant (JD) values in TBI patients (red) and controls (blue) according to classification of cortical grey matter regions of interest as either sulci or gyri. Differences between TBI patients and controls are observed in both sulci and gyri, however the interaction between group and region of interest was significant (b = 0.001, SE = 0.0006, t = 2.08, P = 0.037), reflecting greater atrophy in the sulci of TBI patients compared to the gyri.
Figure 6
Figure 6
Clinical trial sample size requirements based on brain atrophy measures. Sample size requirements for a placebo-controlled clinical trial of a treatment aimed at reducing atrophy in cases relative to controls. Sample sizes are plotted against potential treatment effectiveness. Coloured lines depict this relationship for different atrophy measures, either volumetric or deformation-based (i.e. Jacobian determinant values), using either grey matter, white matter or whole brain volume. Grey dashed vertical line indicates the effectiveness level used in the sample size calculations presented in the ‘Results’ section (i.e. 25% effectiveness). GM = grey matter; JD = Jacobian determinant; WM = white matter.

References

    1. Ashburner J, Good C, Friston KJ. Tensor based morphometry. Neuroimage 2000; 11 (5, Supplement): S465.
    1. Ashburner J, Ridgway GR. Symmetric diffeomorphic modelling of longitudinal structural MRI. Front Neurosci 2013; 6: 197. - PMC - PubMed
    1. Beckett LA. Community-based studies of Alzheimer's disease: statistical challenges in design and analysis. Stat Med 2000; 19: 1469–80. - PubMed
    1. Bendlin BB, Ries ML, Lazar M, Alexander AL, Dempsey RJ, Rowley HA, et al. Longitudinal changes in patients with traumatic brain injury assessed with diffusion-tensor and volumetric imaging. Neuroimage 2008; 42: 503–14. - PMC - PubMed
    1. Bigler ED. Neuroinflammation and the dynamic lesion in traumatic brain injury. Brain 2013; 136: 9–11. - PubMed

Publication types