. 2018 Mar 14;69(6):1387-1402.
doi: 10.1093/jxb/erx455.

Autophagy is activated and involved in cell death with participation of cathepsins during stress-induced microspore embryogenesis in barley

Affiliations

Autophagy is activated and involved in cell death with participation of cathepsins during stress-induced microspore embryogenesis in barley

Ivett Bárány et al. J Exp Bot. .

Abstract

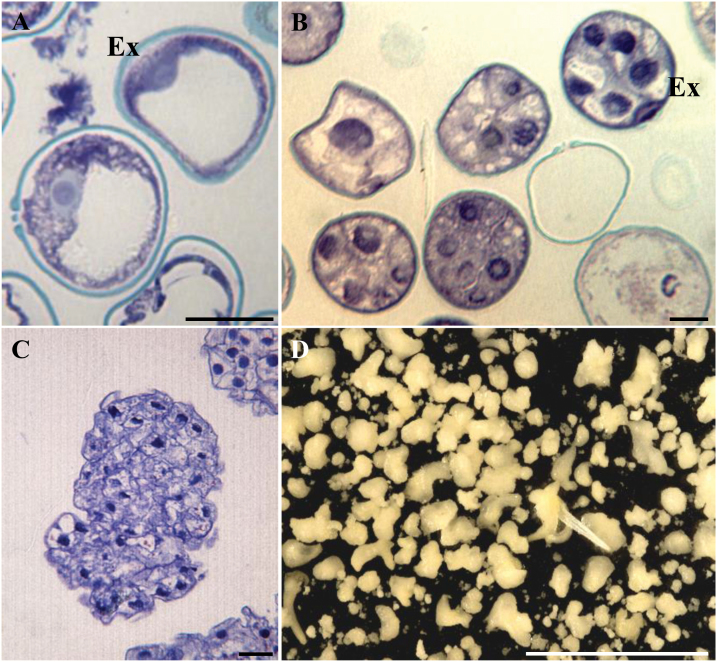
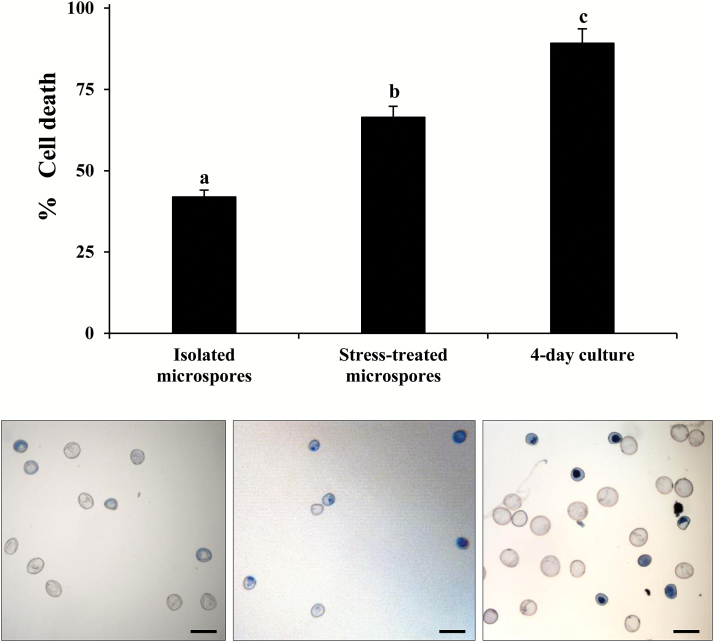
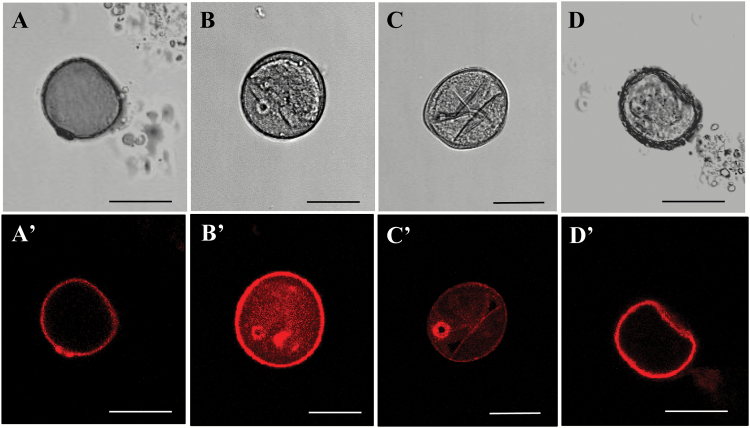
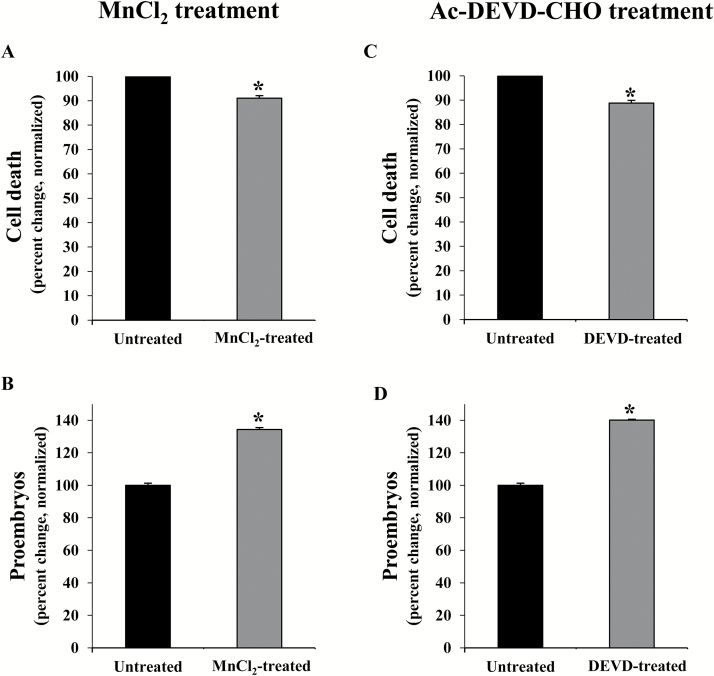
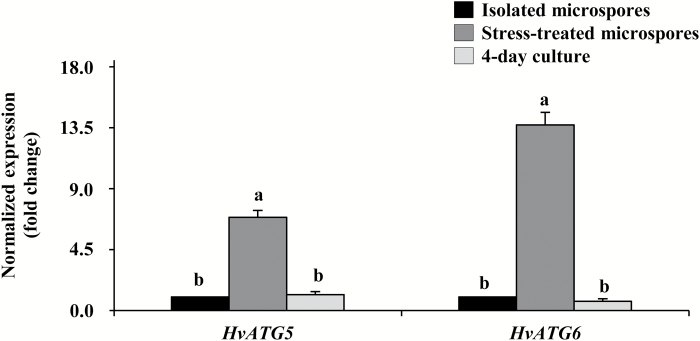
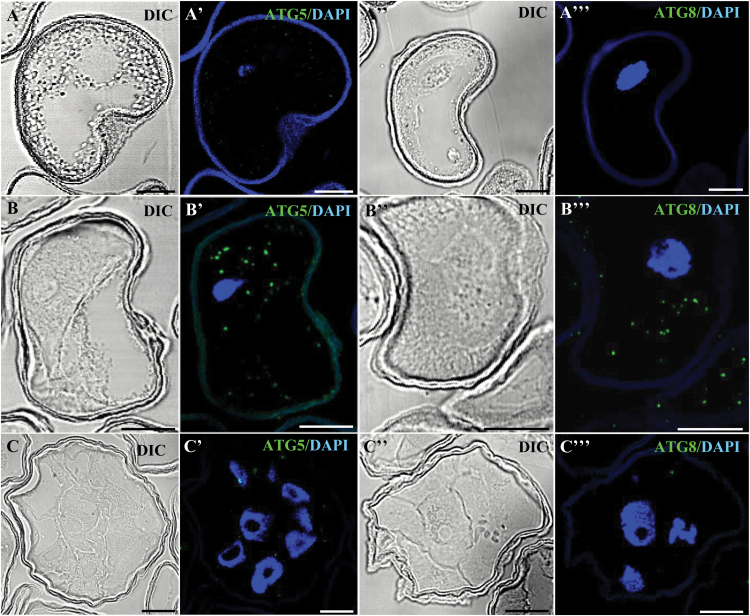
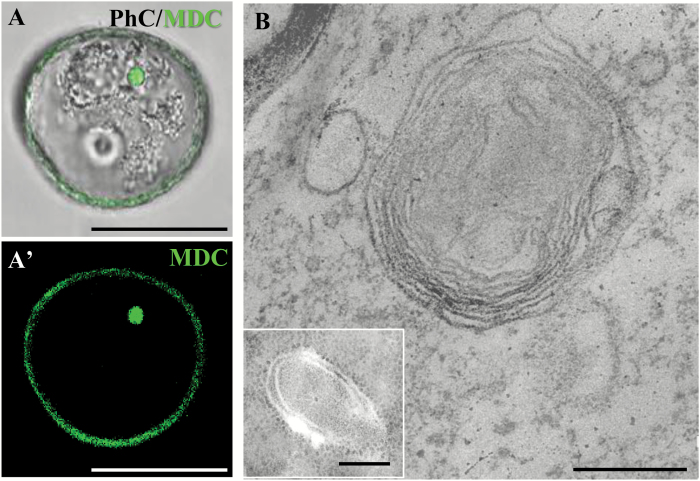
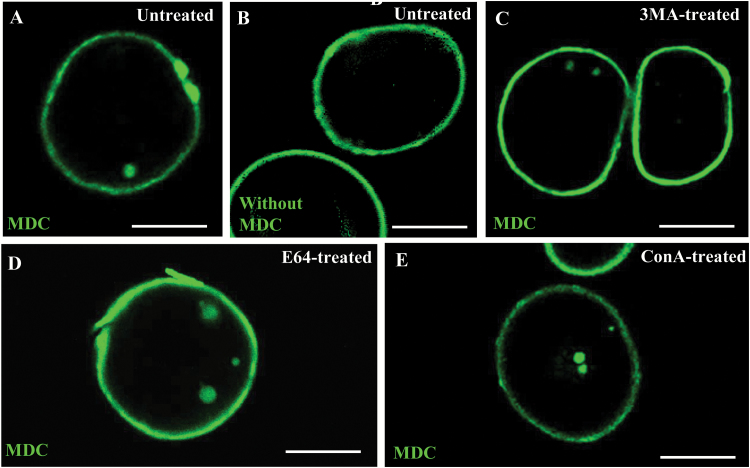
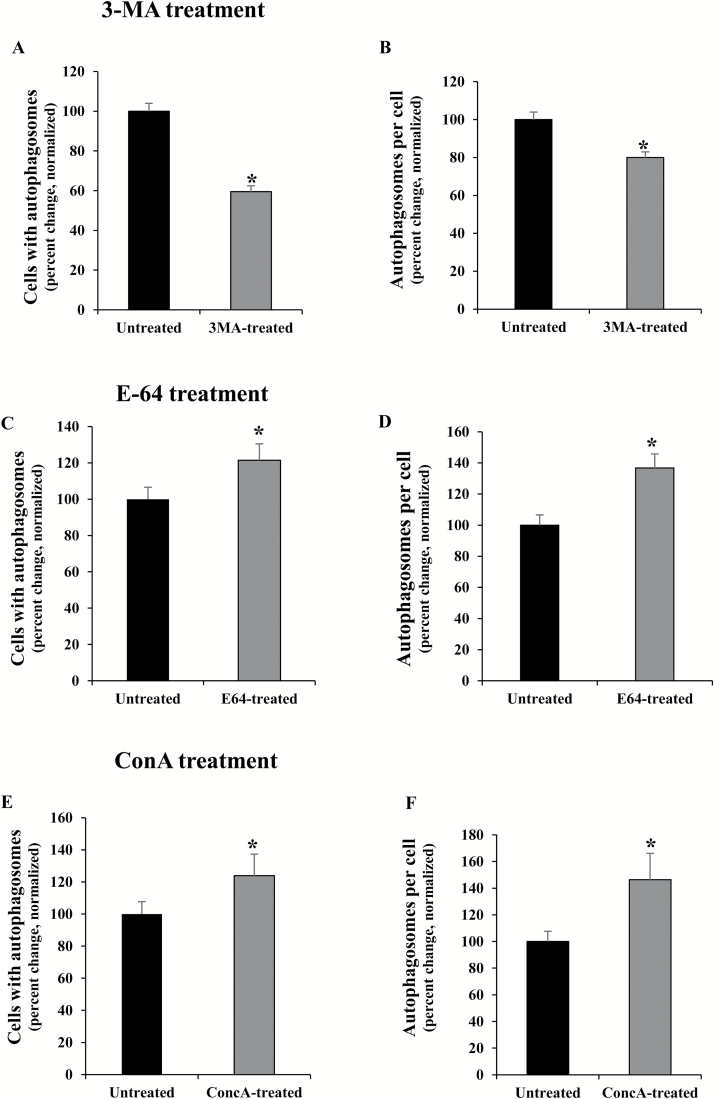
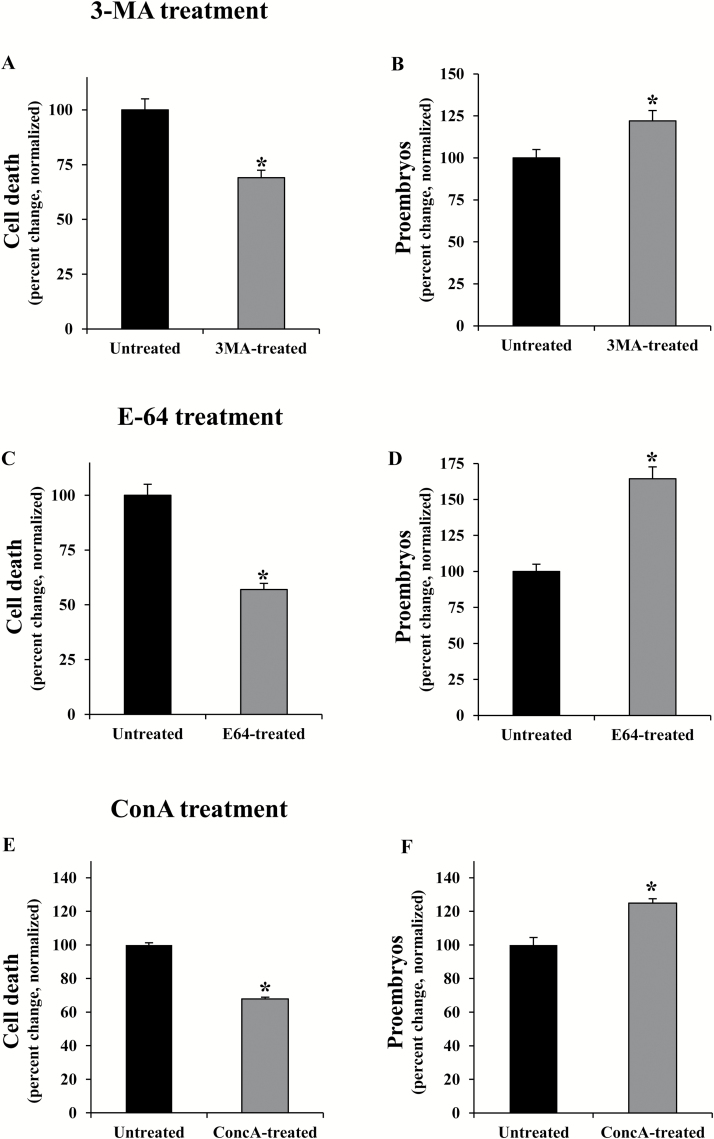
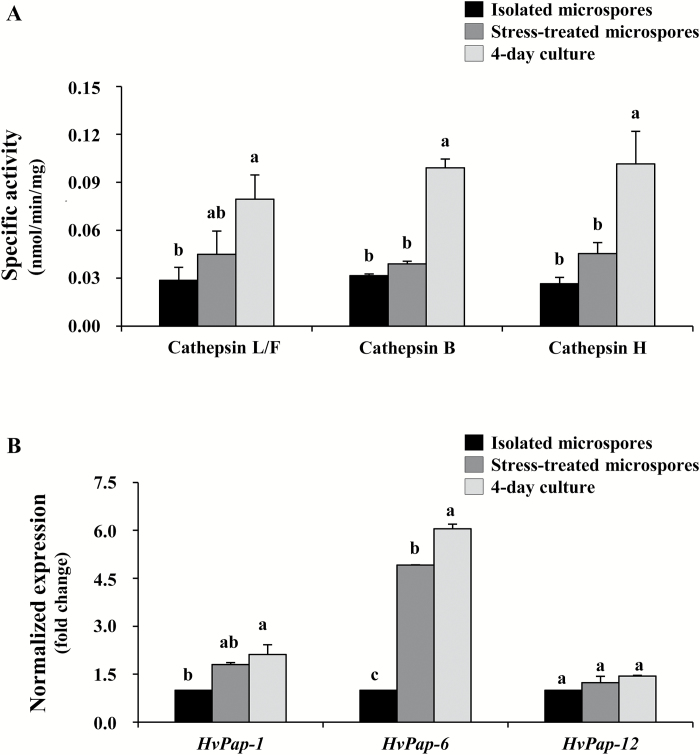
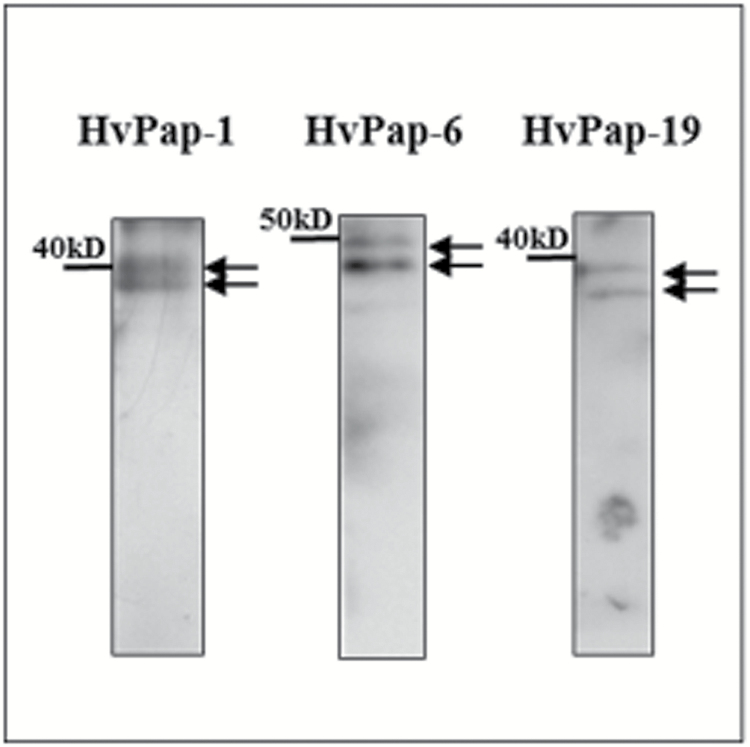
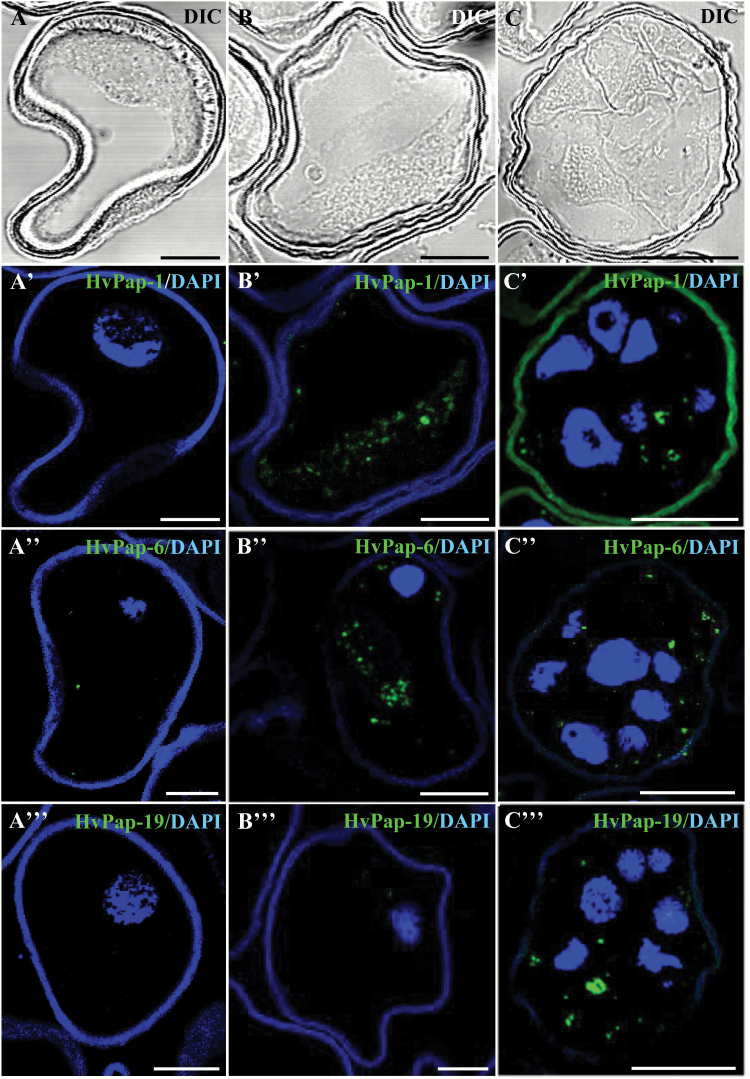
Microspores are reprogrammed towards embryogenesis by stress. Many microspores die after this stress, limiting the efficiency of microspore embryogenesis. Autophagy is a degradation pathway that plays critical roles in stress response and cell death. In animals, cathepsins have an integral role in autophagy by degrading autophagic material; less is known in plants. Plant cathepsins are papain-like C1A cysteine proteases involved in many physiological processes, including programmed cell death. We have analysed the involvement of autophagy in cell death, in relation to cathepsin activation, during stress-induced microspore embryogenesis in Hordeum vulgare. After stress, reactive oxygen species (ROS) and cell death increased and autophagy was activated, including HvATG5 and HvATG6 up-regulation and increase of ATG5, ATG8, and autophagosomes. Concomitantly, cathepsin L/F-, B-, and H-like activities were induced, cathepsin-like genes HvPap-1 and HvPap-6 were up-regulated, and HvPap-1, HvPap-6, and HvPap-19 proteins increased and localized in the cytoplasm, resembling autophagy structures. Inhibitors of autophagy and cysteine proteases reduced cell death and promoted embryogenesis. The findings reveal a role for autophagy in stress-induced cell death during microspore embryogenesis, and the participation of cathepsins. Similar patterns of activation, expression, and localization suggest a possible connection between cathepsins and autophagy. The results open up new possibilities to enhance microspore embryogenesis efficiency with autophagy and/or cysteine protease modulators.


Figures

Fig. 1.
Fig. 1.
Stress-induced microspore embryogenesis in Hordeum vulgare. Micrographs of toluidine blue-stained semi-thin sections for general structural analysis. (A) Vacuolated microspore at culture initiation. (B) Proembryos on microspore culture 4 d after stress, still surrounded by the exine. (C) Early transitional embryo. (D) Microspore-derived embryos after 30 d in culture observed under the stereomicroscope. Ex, exine. Scale bars represent in (A–C) 20 µm, in (D) 10 mm.
Fig. 2.
Fig. 2.
Cell death in stress-induced microspore embryogenesis. Histogram showing the percentage of cell death after cell isolation and inductive stress identified by Evan’s blue staining. Micrographs showing dead microspores as blue cells after Evan’s blue staining. Bars in columns indicate the SE. Scale bars in micrographs represent 60 µm. Different letters on columns indicate significant differences among stages, according to ANOVA and Tukey’s tests at P<0.05.
Fig. 3.
Fig. 3.
ROS staining during stress-induced microspore embryogenesis. Specific staining with dihydroethidium (DHE). Confocal laser scanning microscopy analysis of (A, A') isolated microspore, (B, B') stress-treated microspore, (C, C') 4 d culture proembryo, (D, D') stress-treated microspore after incubation with MnCl2 (O2 scavenger). Scale bars represent 25 µm.
Fig. 4.
Fig. 4.
Effect of treatments with MnCl2 (O2 scavenger) and Ac-DEVD-CHO (caspase-3 inhibitor) in stress-induced microspore embryogenesis. (A, C) Quantification of cell death levels, identified by Evan’s blue staining, 4 d after stress in untreated microspore cultures and cultures treated with MnCl2 (A) and Ac-DEVD-CHO (C). (B, D) Quantification of proembryos (as an indicator of microspore embryogenesis initiation) in microspore cultures, 4 d after stress, treated with MnCl2 (B) and Ac-DEVD-CHO (D). In all histograms, results are expressed as percentages (percent change) and referred to the mean percentage of dead cells or proembryos in control cultures which has been normalized to 100%. Bars indicate the SE. Asterisks indicate significant differences between treated and untreated cultures, within each treatment, assessed by Student’s t-test, at P<0.05.
Fig. 5.
Fig. 5.
Gene expression patterns of autophagy genes HvATG5 and HvATG6 during stress-induced microspore embryogenesis. Histogram showing relative changes of mRNA levels normalized to isolated microspore levels, as determined by RT-qPCR. Bars indicate the SE. Different letters indicate significant differences among stages within the expression of each gene according to ANOVA and Tukey’s tests at P<0.05.
Fig. 6.
Fig. 6.
Immunolocalization of autophagy proteins HvATG5 and HvATG8 during stress-induced microspore embryogenesis. Immunofluorescence and confocal laser scanning microscopy analysis of isolated microspore (A–A'''), stress-treated microspore (B–B'''), and 4 d culture proembryo (C–C'''). (A–C, A''–C'') Normarsky’s differential interference contrast (DIC). (A'–C', A'''–C''') Merged images of ATG immunofluorescence (green) and DAPI staining of nuclei (blue). (A'–C') HvATG5. (A'''–C''') HvATG8. Scale bars represent in (A–B'') 10 µm, in (C–C'') 20 µm.
Fig. 7.
Fig. 7.
Detection of autophagosomes and autophagic bodies in stress-treated microspores by monodansylcadaverine (MDC) staining and ultrastructural analysis. (A, A') MDC staining of an autophagosome/autophagic body (green) under confocal microscopy, (A) merged DIC and fluorescence image. (B) Electron microscopy images of autophagosomes. The main micrograph shows an advanced/mature autophagosome that has engulfed cytoplasmic organelles/material. The inset shows an autophagosome at an early stage of its formation. Bars represent in (A, A') 25 µm, in (B) 0.5 µm, in (inset) 0.2 µm.
Fig. 8.
Fig. 8.
Effects of treatments with 3-MA, E-64, and ConA on autophagosome presence in microspore cultures. (A, C–E) MDC staining and confocal laser scanning microscopy analysis of stress-treated microspores. (B) Control without MDC in stress-treated microspores, which show unspecific autofluorescence of the microspore wall, the exine. (A) Untreated microspore culture. (C) Microspore culture treated with 3-MA. (D) Microspore culture treated with E-64. (E) Microspore culture treated with ConA. Scale bars in micrographs represent 20 µm.
Fig. 9.
Fig. 9.
Quantitative analyses of autophagy in microspore cultures after treatments with autophagy inhibitors 3-MA, E64, and ConA. (A, B) 3-MA treatment. (C, D) E-64 treatment. (E, F) ConA treatment. (A, C, E) Cells with autophagosomes (MDC-positive cells) in untreated and treated microspore cultures. (B, D, F) Autophagosomes per cell in untreated and treated microspore cultures. In all histograms, results are expressed as percentages (percent change) and referred to the mean percentage in untreated cultures which has been normalized to 100%. Bars in histograms indicate the SE. Asterisks indicate significant differences between treated and untreated cultures, within each treatment, assessed by Student’s t-test, at P<0.05.
Fig. 10.
Fig. 10.
Effects of treatments with 3-MA, E-64, and ConA on cell death and embryogenesis induction in microspore cultures. Quantification of the percentage of dead cells (A, C, E) and proembryos (B, D, F) on microspore cultures 4 d after stress in untreated cultures and cultures treated with 3-MA (A, B), E-64 (C, D), and ConA (E, F). In all histograms, results are expressed as percentages (percent change) and referred to the mean percentage of dead cells or proembryos in untreated cultures which has been normalized to 100%. Bars indicate the SE. Asterisks indicate significant differences between treated and untreated cultures, within each treatment, assessed by Student’s t-test, at P<0.05.
Fig. 11.
Fig. 11.
Patterns of cathepsin proteolytic activities and gene expression during stress-induced microspore embryogenesis. (A) Proteolytic pattern of cathepsin L-/F-like, cathepsin B-like, and cathepsin H-like cysteine proteases. Specific activity, in nmol mg–1 min–1. (B) Transcript levels of the HvPap-1 gene (cathepsin F-like protease), HvPap-6 gene (cathepsin L-like protease), and HvPap-12 gene (cathepsin H-like protease) normalized to the isolated microspore within each gene. Bars indicate the SE. Different letters indicate significant differences among stages within each activity/gene studied, according to ANOVA and Tukey’s tests at P<0.05.
Fig. 12.
Fig. 12.
Protein patterns of cathepsins HvPap-1, HvPap-6, and HvPap-19 in microspore-derived embryos detected by immunoblot. Arrows indicate bands corresponding to the inactive (upper) and active (lower) forms of each protease.
Fig. 13.
Fig. 13.
Immunolocalization of barley cysteine proteases (HvPap-1, -6, and -19) during stress-induced microspore embryogenesis. Immunofluorescence and confocal laser scanning microscopy analysis of (A–A''') isolated microspore, (B–B''') stress-treated microspore, and (C–C''') 4 d culture proembryo confined by the exine. (A-C) Normarsky’s differential interference contrast (DIC). (A'–C''') Merged images of cysteine protease immunofluorescence (green) and DAPI staining of nuclei (blue). (A'–C') HvPap-1 cysteine protease. (A''-C'') HvPap-6 cysteine protease. (A'''-C''') HvPap-19 cysteine protease. Scale bars represent in (A–B''') 10 µm, in (C–C''') 20 µm.

References

    1. Álvarez C, García I, Moreno I, Pérez-Pérez ME, Crespo JL, Romero LC, Gotor C. 2012. Cysteine-generated sulfide in the cytosol negatively regulates autophagy and modulates the transcriptional profile in Arabidopsis. The Plant Cell 24, 4621–4634. - PMC - PubMed
    1. Apel K, Hirt H. 2004. Reactive oxygen species: metabolism, oxidative stress, and signal transduction. Annual Review of Plant Biology 55, 373–399. - PubMed
    1. Avila-Ospina L, Marmagne A, Soulay F, Masclaux-Daubresse C. 2016. Identification of barley (Hordeum vulgare L.) autophagy genes and their expression levels during leaf senescence, chronic nitrogen limitation and in response to dark exposure. Agronomy 6, 15.
    1. Bárány I, González-Melendi P, Fadón B, Mitykó J, Risueño MC, Testillano PS. 2005. Microspore-derived embryogenesis in pepper (Capsicum annuum L.): subcellular rearrangements through development. Biology of the Cell 97, 709–722. - PubMed
    1. Bassham DC. 2007. Plant autophagy—more than a starvation response. Current Opinion in Plant Biology 10, 587–593. - PubMed

Publication types